
关于k Line Chart (k线图)
K Line Chart
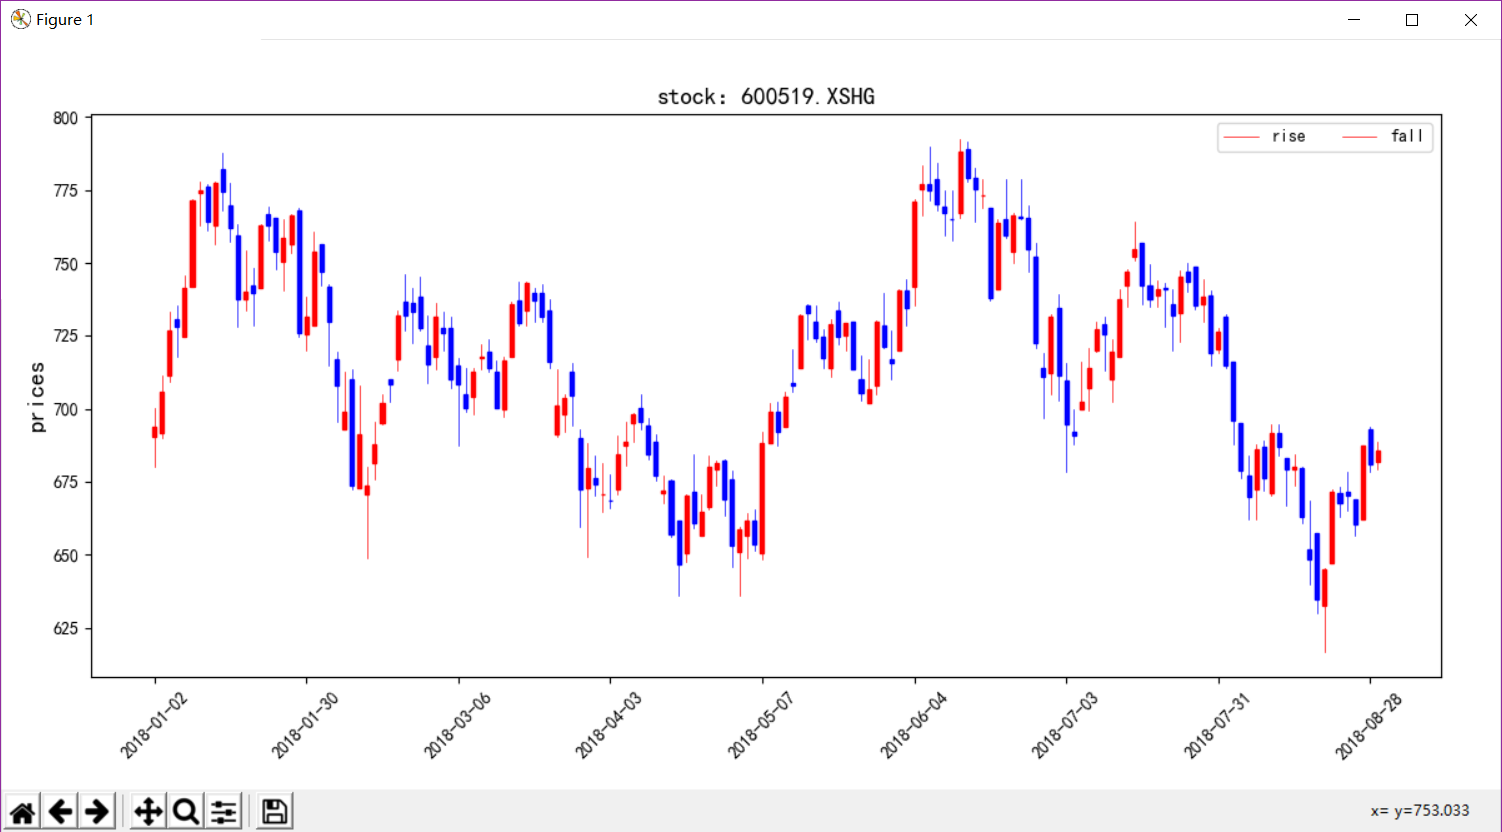
python实现k线图的代码,之前找过matplotlib中文文档但是画k线图的finance方法已经弃用了。所以自己在网上搜寻一下加上改编,很好的实现出k线图,
代码如下:__main__
# conding:utf-8

# 导入聚宽函数库

from jqdatasdk import *

import pandas as pd

import matplotlib.pyplot as plt

from KLineChart.mpl_finance import plt_KLineChart

import os

'''

:param fields 字符串list, 默认是None(表示['open', 'close', 'high', 'low', 'volume', 'money']这几个标准字段),

      支持以下属性 ['open', 'close', 'low', 'high', 'volume', 'money', 'factor', 'high_limit', 'low_limit', 'avg', 'pre_close', 'paused']

:param skip_paused 是否跳过不交易日期

'''

auth('your ID','your password')

fields = ['open', 'close', 'high', 'low', 'volume', 'money']

stock_code = ['600519.XSHG','000001.XSHE','IC9999.CCFX']

data = get_price(stock_code,start_date='2018-1-1',end_date='2018-8-29',frequency='1d',fields=fields,skip_paused=False)

k,m,n = data.shape

# print(k,m,n)

for i in range(n):

    Data = data.iloc[:,:,i]

    plt_KLineChart(Data,stock_code[i],step=20,fontSize=14)

plt.show()

# 数据保存

# os.mkdir('data/中国银行.xlsx')

# data.to_excel(r'./data/中国银行.xlsx')

# sql.to_excel()

# print(data.shape)
这下我们需要导入自定义函数:from mpl_finance import plt_KLineChart
"""
A collection of functions for analyzing and plotting
financial data. User contributions welcome!
"""
from __future__ import (absolute_import, division, print_function,
unicode_literals) import numpy as np
import matplotlib.pyplot as plt
from matplotlib import colors as mcolors
from matplotlib.collections import LineCollection, PolyCollection
from matplotlib.lines import TICKLEFT, TICKRIGHT, Line2D
from matplotlib.patches import Rectangle
from matplotlib.transforms import Affine2D from six.moves import xrange, zip def plot_day_summary_oclh(ax, quotes, ticksize=3,
colorup='k', colordown='r'):
"""Plots day summary
Represent the time, open, close, high, low as a vertical line
ranging from low to high. The left tick is the open and the right
tick is the close.
Parameters
----------
ax : `Axes`
an `Axes` instance to plot to
quotes : sequence of (time, open, close, high, low, ...) sequences
data to plot. time must be in float date format - see date2num
ticksize : int
open/close tick marker in points
colorup : color
the color of the lines where close >= open
colordown : color
the color of the lines where close < open
Returns
-------
lines : list
list of tuples of the lines added (one tuple per quote)
"""
return _plot_day_summary(ax, quotes, ticksize=ticksize,
colorup=colorup, colordown=colordown,
ochl=True) def plot_day_summary_ohlc(ax, quotes, ticksize=3,
colorup='k', colordown='r'):
"""Plots day summary
Represent the time, open, high, low, close as a vertical line
ranging from low to high. The left tick is the open and the right
tick is the close.
Parameters
----------
ax : `Axes`
an `Axes` instance to plot to
quotes : sequence of (time, open, high, low, close, ...) sequences
data to plot. time must be in float date format - see date2num
ticksize : int
open/close tick marker in points
colorup : color
the color of the lines where close >= open
colordown : color
the color of the lines where close < open
Returns
-------
lines : list
list of tuples of the lines added (one tuple per quote)
"""
return _plot_day_summary(ax, quotes, ticksize=ticksize,
colorup=colorup, colordown=colordown,
ochl=False) def _plot_day_summary(ax, quotes, ticksize=3,
colorup='k', colordown='r',
ochl=True):
"""Plots day summary
Represent the time, open, high, low, close as a vertical line
ranging from low to high. The left tick is the open and the right
tick is the close.
Parameters
----------
ax : `Axes`
an `Axes` instance to plot to
quotes : sequence of quote sequences
data to plot. time must be in float date format - see date2num
(time, open, high, low, close, ...) vs
(time, open, close, high, low, ...)
set by `ochl`
ticksize : int
open/close tick marker in points
colorup : color
the color of the lines where close >= open
colordown : color
the color of the lines where close < open
ochl: bool
argument to select between ochl and ohlc ordering of quotes
Returns
-------
lines : list
list of tuples of the lines added (one tuple per quote)
"""
# unfortunately this has a different return type than plot_day_summary2_*
lines = []
for q in quotes:
if ochl:
t, open, close, high, low = q[:5]
else:
t, open, high, low, close = q[:5] if close >= open:
color = colorup
else:
color = colordown vline = Line2D(xdata=(t, t), ydata=(low, high),
color=color,
antialiased=False, # no need to antialias vert lines
) oline = Line2D(xdata=(t, t), ydata=(open, open),
color=color,
antialiased=False,
marker=TICKLEFT,
markersize=ticksize,
) cline = Line2D(xdata=(t, t), ydata=(close, close),
color=color,
antialiased=False,
markersize=ticksize,
marker=TICKRIGHT) lines.extend((vline, oline, cline))
ax.add_line(vline)
ax.add_line(oline)
ax.add_line(cline) ax.autoscale_view() return lines def candlestick_ochl(ax, quotes, width=0.2, colorup='k', colordown='r',
alpha=1.0):
"""
Plot the time, open, close, high, low as a vertical line ranging
from low to high. Use a rectangular bar to represent the
open-close span. If close >= open, use colorup to color the bar,
otherwise use colordown
Parameters
----------
ax : `Axes`
an Axes instance to plot to
quotes : sequence of (time, open, close, high, low, ...) sequences
As long as the first 5 elements are these values,
the record can be as long as you want (e.g., it may store volume).
time must be in float days format - see date2num
width : float
fraction of a day for the rectangle width
colorup : color
the color of the rectangle where close >= open
colordown : color
the color of the rectangle where close < open
alpha : float
the rectangle alpha level
Returns
-------
ret : tuple
returns (lines, patches) where lines is a list of lines
added and patches is a list of the rectangle patches added
"""
return _candlestick(ax, quotes, width=width, colorup=colorup,
colordown=colordown,
alpha=alpha, ochl=True) def plt_KLineChart(data,stockCode,step=20,fontSize=13,figsize=(12,6)): '''
:param data: type for DataFrame
:param stockCode: stock code
:param step: xticks step
:param fontSize: font size
:param figsize: window size
:return:
''' prices = data[['open', 'high', 'low', 'close']] fig = plt.figure(figsize=figsize)
ax = fig.add_axes([0.06, 0.15, 0.9, 0.75]) # margin_left margin_bottom width height
candlestick_ohlc(ax, prices, width=0.5, colorup='r', colordown='b') dataIndex = [str(i).split(' ')[0] for i in data.iloc[::step, :].index]
location = list(range(0,len(data.iloc[:,0]),step))
plt.xticks(location,dataIndex,rotation=45) font_size = {'size': fontSize}
plt.ylabel('prices',font_size)
plt.title('stock:%s'%(stockCode),font_size)
plt.rcParams['font.sans-serif'] = ['SimHei'] # 设置字体为SimHei显示中文
plt.rcParams['axes.unicode_minus'] = False # 设置正常显示符号 def candlestick_ohlc(ax, quotes, width=0.2, colorup='k', colordown='r',
alpha=1.0):
"""
Plot the time, open, high, low, close as a vertical line ranging
from low to high. Use a rectangular bar to represent the
open-close span. If close >= open, use colorup to color the bar,
otherwise use colordown
Parameters
----------
ax : `Axes`
an Axes instance to plot to
quotes : sequence of (time, open, high, low, close, ...) sequences
As long as the first 5 elements are these values,
the record can be as long as you want (e.g., it may store volume).
time must be in float days format - see date2num
width : float
fraction of a day for the rectangle width
colorup : color
the color of the rectangle where close >= open
colordown : color
the color of the rectangle where close < open
alpha : float
the rectangle alpha level
Returns
-------
ret : tuple
returns (lines, patches) where lines is a list of lines
added and patches is a list of the rectangle patches added
"""
return _candlestick(ax, quotes, width=width, colorup=colorup,
colordown=colordown,
alpha=alpha, ochl=False) def _candlestick(ax, quotes, width=0.2, colorup='k', colordown='r',
alpha=1.0, ochl=True):
"""
Plot the time, open, high, low, close as a vertical line ranging
from low to high. Use a rectangular bar to represent the
open-close span. If close >= open, use colorup to color the bar,
otherwise use colordown
Parameters
----------
ax : `Axes`
an Axes instance to plot to
quotes : sequence of quote sequences
data to plot. time must be in float date format - see date2num
(time, open, high, low, close, ...) vs
(time, open, close, high, low, ...)
set by `ochl`
width : float
fraction of a day for the rectangle width
colorup : color
the color of the rectangle where close >= open
colordown : color
the color of the rectangle where close < open
alpha : float
the rectangle alpha level
ochl: bool
argument to select between ochl and ohlc ordering of quotes
Returns
-------
ret : tuple
returns (lines, patches) where lines is a list of lines
added and patches is a list of the rectangle patches added
""" OFFSET = width / 2.0 lines = []
patches = []
quotes = np.column_stack([list(range(len(quotes))), quotes])
for q in quotes:
if ochl:
t, open, close, high, low = q[:5]
else:
t, open, high, low, close = q[:5] if close >= open:
color = colorup
lower = open
height = close - open
else:
color = colordown
lower = close
height = open - close vline = Line2D(
xdata=(t, t), ydata=(low, high),
color=color,
linewidth=0.5,
antialiased=True,
) rect = Rectangle(
xy=(t - OFFSET, lower),
width=width,
height=height,
facecolor=color,
edgecolor=color,
)
rect.set_alpha(alpha) lines.append(vline)
patches.append(rect)
ax.add_line(vline)
ax.add_patch(rect)
ax.autoscale_view() return lines, patches def _check_input(opens, closes, highs, lows, miss=-1):
"""Checks that *opens*, *highs*, *lows* and *closes* have the same length.
NOTE: this code assumes if any value open, high, low, close is
missing (*-1*) they all are missing
Parameters
----------
ax : `Axes`
an Axes instance to plot to
opens : sequence
sequence of opening values
highs : sequence
sequence of high values
lows : sequence
sequence of low values
closes : sequence
sequence of closing values
miss : int
identifier of the missing data
Raises
------
ValueError
if the input sequences don't have the same length
""" def _missing(sequence, miss=-1):
"""Returns the index in *sequence* of the missing data, identified by
*miss*
Parameters
----------
sequence :
sequence to evaluate
miss :
identifier of the missing data
Returns
-------
where_miss: numpy.ndarray
indices of the missing data
"""
return np.where(np.array(sequence) == miss)[0] same_length = len(opens) == len(highs) == len(lows) == len(closes)
_missopens = _missing(opens)
same_missing = ((_missopens == _missing(highs)).all() and
(_missopens == _missing(lows)).all() and
(_missopens == _missing(closes)).all()) if not (same_length and same_missing):
msg = ("*opens*, *highs*, *lows* and *closes* must have the same"
" length. NOTE: this code assumes if any value open, high,"
" low, close is missing (*-1*) they all must be missing.")
raise ValueError(msg) def plot_day_summary2_ochl(ax, opens, closes, highs, lows, ticksize=4,
colorup='k', colordown='r'):
"""Represent the time, open, close, high, low, as a vertical line
ranging from low to high. The left tick is the open and the right
tick is the close.
Parameters
----------
ax : `Axes`
an Axes instance to plot to
opens : sequence
sequence of opening values
closes : sequence
sequence of closing values
highs : sequence
sequence of high values
lows : sequence
sequence of low values
ticksize : int
size of open and close ticks in points
colorup : color
the color of the lines where close >= open
colordown : color
the color of the lines where close < open
Returns
-------
ret : list
a list of lines added to the axes
""" return plot_day_summary2_ohlc(ax, opens, highs, lows, closes, ticksize,
colorup, colordown) def plot_day_summary2_ohlc(ax, opens, highs, lows, closes, ticksize=4,
colorup='k', colordown='r'):
"""Represent the time, open, high, low, close as a vertical line
ranging from low to high. The left tick is the open and the right
tick is the close.
*opens*, *highs*, *lows* and *closes* must have the same length.
NOTE: this code assumes if any value open, high, low, close is
missing (*-1*) they all are missing
Parameters
----------
ax : `Axes`
an Axes instance to plot to
opens : sequence
sequence of opening values
highs : sequence
sequence of high values
lows : sequence
sequence of low values
closes : sequence
sequence of closing values
ticksize : int
size of open and close ticks in points
colorup : color
the color of the lines where close >= open
colordown : color
the color of the lines where close < open
Returns
-------
ret : list
a list of lines added to the axes
""" _check_input(opens, highs, lows, closes) rangeSegments = [((i, low), (i, high)) for i, low, high in
zip(xrange(len(lows)), lows, highs) if low != -1] # the ticks will be from ticksize to 0 in points at the origin and
# we'll translate these to the i, close location
openSegments = [((-ticksize, 0), (0, 0))] # the ticks will be from 0 to ticksize in points at the origin and
# we'll translate these to the i, close location
closeSegments = [((0, 0), (ticksize, 0))] offsetsOpen = [(i, open) for i, open in
zip(xrange(len(opens)), opens) if open != -1] offsetsClose = [(i, close) for i, close in
zip(xrange(len(closes)), closes) if close != -1] scale = ax.figure.dpi * (1.0 / 72.0) tickTransform = Affine2D().scale(scale, 0.0) colorup = mcolors.to_rgba(colorup)
colordown = mcolors.to_rgba(colordown)
colord = {True: colorup, False: colordown}
colors = [colord[open < close] for open, close in
zip(opens, closes) if open != -1 and close != -1] useAA = 0, # use tuple here
lw = 1, # and here
rangeCollection = LineCollection(rangeSegments,
colors=colors,
linewidths=lw,
antialiaseds=useAA,
) openCollection = LineCollection(openSegments,
colors=colors,
antialiaseds=useAA,
linewidths=lw,
offsets=offsetsOpen,
transOffset=ax.transData,
)
openCollection.set_transform(tickTransform) closeCollection = LineCollection(closeSegments,
colors=colors,
antialiaseds=useAA,
linewidths=lw,
offsets=offsetsClose,
transOffset=ax.transData,
)
closeCollection.set_transform(tickTransform) minpy, maxx = (0, len(rangeSegments))
miny = min([low for low in lows if low != -1])
maxy = max([high for high in highs if high != -1])
corners = (minpy, miny), (maxx, maxy)
ax.update_datalim(corners)
ax.autoscale_view() # add these last
ax.add_collection(rangeCollection)
ax.add_collection(openCollection)
ax.add_collection(closeCollection)
return rangeCollection, openCollection, closeCollection def candlestick2_ochl(ax, opens, closes, highs, lows, width=4,
colorup='k', colordown='r',
alpha=0.75):
"""Represent the open, close as a bar line and high low range as a
vertical line.
Preserves the original argument order.
Parameters
----------
ax : `Axes`
an Axes instance to plot to
opens : sequence
sequence of opening values
closes : sequence
sequence of closing values
highs : sequence
sequence of high values
lows : sequence
sequence of low values
width : int
size of open and close ticks in points
colorup : color
the color of the lines where close >= open
colordown : color
the color of the lines where close < open
alpha : float
bar transparency
Returns
-------
ret : tuple
(lineCollection, barCollection)
""" return candlestick2_ohlc(ax, opens, highs, lows, closes, width=width,
colorup=colorup, colordown=colordown,
alpha=alpha) def candlestick2_ohlc(ax, opens, highs, lows, closes, width=4,
colorup='k', colordown='r',
alpha=0.75):
"""Represent the open, close as a bar line and high low range as a
vertical line.
NOTE: this code assumes if any value open, low, high, close is
missing they all are missing
Parameters
----------
ax : `Axes`
an Axes instance to plot to
opens : sequence
sequence of opening values
highs : sequence
sequence of high values
lows : sequence
sequence of low values
closes : sequence
sequence of closing values
width : int
size of open and close ticks in points
colorup : color
the color of the lines where close >= open
colordown : color
the color of the lines where close < open
alpha : float
bar transparency
Returns
-------
ret : tuple
(lineCollection, barCollection)
""" _check_input(opens, highs, lows, closes) delta = width / 2.
barVerts = [((i - delta, open),
(i - delta, close),
(i + delta, close),
(i + delta, open))
for i, open, close in zip(xrange(len(opens)), opens, closes)
if open != -1 and close != -1] rangeSegments = [((i, low), (i, high))
for i, low, high in zip(xrange(len(lows)), lows, highs)
if low != -1] colorup = mcolors.to_rgba(colorup, alpha)
colordown = mcolors.to_rgba(colordown, alpha)
colord = {True: colorup, False: colordown}
colors = [colord[open < close]
for open, close in zip(opens, closes)
if open != -1 and close != -1] useAA = 0, # use tuple here
lw = 0.5, # and here
rangeCollection = LineCollection(rangeSegments,
colors=colors,
linewidths=lw,
antialiaseds=useAA,
) barCollection = PolyCollection(barVerts,
facecolors=colors,
edgecolors=colors,
antialiaseds=useAA,
linewidths=lw,
) minx, maxx = 0, len(rangeSegments)
miny = min([low for low in lows if low != -1])
maxy = max([high for high in highs if high != -1]) corners = (minx, miny), (maxx, maxy)
ax.update_datalim(corners)
ax.autoscale_view() # add these last
ax.add_collection(rangeCollection)
ax.add_collection(barCollection)
return rangeCollection, barCollection def volume_overlay(ax, opens, closes, volumes,
colorup='k', colordown='r',
width=4, alpha=1.0):
"""Add a volume overlay to the current axes. The opens and closes
are used to determine the color of the bar. -1 is missing. If a
value is missing on one it must be missing on all
Parameters
----------
ax : `Axes`
an Axes instance to plot to
opens : sequence
a sequence of opens
closes : sequence
a sequence of closes
volumes : sequence
a sequence of volumes
width : int
the bar width in points
colorup : color
the color of the lines where close >= open
colordown : color
the color of the lines where close < open
alpha : float
bar transparency
Returns
-------
ret : `barCollection`
The `barrCollection` added to the axes
""" colorup = mcolors.to_rgba(colorup, alpha)
colordown = mcolors.to_rgba(colordown, alpha)
colord = {True: colorup, False: colordown}
colors = [colord[open < close]
for open, close in zip(opens, closes)
if open != -1 and close != -1] delta = width / 2.
bars = [((i - delta, 0), (i - delta, v), (i + delta, v), (i + delta, 0))
for i, v in enumerate(volumes)
if v != -1] barCollection = PolyCollection(bars,
facecolors=colors,
edgecolors=((0, 0, 0, 1),),
antialiaseds=(0,),
linewidths=(0.5,),
) ax.add_collection(barCollection)
corners = (0, 0), (len(bars), max(volumes))
ax.update_datalim(corners)
ax.autoscale_view() # add these last
return barCollection def volume_overlay2(ax, closes, volumes,
colorup='k', colordown='r',
width=4, alpha=1.0):
"""
Add a volume overlay to the current axes. The closes are used to
determine the color of the bar. -1 is missing. If a value is
missing on one it must be missing on all
nb: first point is not displayed - it is used only for choosing the
right color
Parameters
----------
ax : `Axes`
an Axes instance to plot to
closes : sequence
a sequence of closes
volumes : sequence
a sequence of volumes
width : int
the bar width in points
colorup : color
the color of the lines where close >= open
colordown : color
the color of the lines where close < open
alpha : float
bar transparency
Returns
-------
ret : `barCollection`
The `barrCollection` added to the axes
""" return volume_overlay(ax, closes[:-1], closes[1:], volumes[1:],
colorup, colordown, width, alpha) def volume_overlay3(ax, quotes,
colorup='k', colordown='r',
width=4, alpha=1.0):
"""Add a volume overlay to the current axes. quotes is a list of (d,
open, high, low, close, volume) and close-open is used to
determine the color of the bar
Parameters
----------
ax : `Axes`
an Axes instance to plot to
quotes : sequence of (time, open, high, low, close, ...) sequences
data to plot. time must be in float date format - see date2num
width : int
the bar width in points
colorup : color
the color of the lines where close1 >= close0
colordown : color
the color of the lines where close1 < close0
alpha : float
bar transparency
Returns
-------
ret : `barCollection`
The `barrCollection` added to the axes
""" colorup = mcolors.to_rgba(colorup, alpha)
colordown = mcolors.to_rgba(colordown, alpha)
colord = {True: colorup, False: colordown} dates, opens, highs, lows, closes, volumes = list(zip(*quotes))
colors = [colord[close1 >= close0]
for close0, close1 in zip(closes[:-1], closes[1:])
if close0 != -1 and close1 != -1]
colors.insert(0, colord[closes[0] >= opens[0]]) right = width / 2.0
left = -width / 2.0 bars = [((left, 0), (left, volume), (right, volume), (right, 0))
for d, open, high, low, close, volume in quotes] sx = ax.figure.dpi * (1.0 / 72.0) # scale for points
sy = ax.bbox.height / ax.viewLim.height barTransform = Affine2D().scale(sx, sy) dates = [d for d, open, high, low, close, volume in quotes]
offsetsBars = [(d, 0) for d in dates] useAA = 0, # use tuple here
lw = 0.5, # and here
barCollection = PolyCollection(bars,
facecolors=colors,
edgecolors=((0, 0, 0, 1),),
antialiaseds=useAA,
linewidths=lw,
offsets=offsetsBars,
transOffset=ax.transData,
)
barCollection.set_transform(barTransform) minpy, maxx = (min(dates), max(dates))
miny = 0
maxy = max([volume for d, open, high, low, close, volume in quotes])
corners = (minpy, miny), (maxx, maxy)
ax.update_datalim(corners)
# print 'datalim', ax.dataLim.bounds
# print 'viewlim', ax.viewLim.bounds ax.add_collection(barCollection)
ax.autoscale_view() return barCollection def index_bar(ax, vals,
facecolor='b', edgecolor='l',
width=4, alpha=1.0, ):
"""Add a bar collection graph with height vals (-1 is missing).
Parameters
----------
ax : `Axes`
an Axes instance to plot to
vals : sequence
a sequence of values
facecolor : color
the color of the bar face
edgecolor : color
the color of the bar edges
width : int
the bar width in points
alpha : float
bar transparency
Returns
-------
ret : `barCollection`
The `barrCollection` added to the axes
""" facecolors = (mcolors.to_rgba(facecolor, alpha),)
edgecolors = (mcolors.to_rgba(edgecolor, alpha),) right = width / 2.0
left = -width / 2.0 bars = [((left, 0), (left, v), (right, v), (right, 0))
for v in vals if v != -1] sx = ax.figure.dpi * (1.0 / 72.0) # scale for points
sy = ax.bbox.height / ax.viewLim.height barTransform = Affine2D().scale(sx, sy) offsetsBars = [(i, 0) for i, v in enumerate(vals) if v != -1] barCollection = PolyCollection(bars,
facecolors=facecolors,
edgecolors=edgecolors,
antialiaseds=(0,),
linewidths=(0.5,),
offsets=offsetsBars,
transOffset=ax.transData,
)
barCollection.set_transform(barTransform) minpy, maxx = (0, len(offsetsBars))
miny = 0
maxy = max([v for v in vals if v != -1])
corners = (minpy, miny), (maxx, maxy)
ax.update_datalim(corners)
ax.autoscale_view() # add these last
ax.add_collection(barCollection)
return barCollection
K线图函数:plt_KLineChart
关于k Line Chart (k线图)的更多相关文章
- Open Flash Chart 之线图
天公司要求开发一个曲线图,简单看了一下之前公司的一个系统,发现一个曲线图效果还不错,查了一下叫OpenFlashChart,还是很不错的,很多人用.研究了一下,发现还不错,特地写了个DEMO测试下. ...
- Open Flash Chart 之线图(二)
上一节在研究Open Flash Chart时,漏掉不少东西,只是简单的熟悉了一下后端的属性设置.今天再来补充一下. 一.显示Open Flash Chart图表 Open Flash Chart 前 ...
- pyhton中matplotlib箱线图的绘制(matplotlib双轴图、箱线图、散点图以及相关系数矩阵图))
//2019.07.23 1.箱形图,又称为盒式图,一般可以很好地反映出数据分布的特征,也可以进行多项数据之间分布特征的比较,它主要包含五个基础数据:中位数,两个上下分位数以及上下边缘线数据 其中的一 ...
- canvas绘图,html5 k线图,股票行情图
canvas绘图,html5 k线图,股票行情图 canvas跟其他标签一样,也可以通过css来定义样式.但这里需要注意的是:canvas的默认宽高为300px * 150px,在css中为canva ...
- Android开源图表图形库K线图
Android开源图表图形库K线图 web端k线图一般使用TradingView,android原生的一般是在MPAndroidChart 基础上做开发的,目前看到一个比较好的K线开源组件是KChar ...
- highstock K线图 深入研究
K线图,相信每个股民都不陌生,如何用SVG画好一个K线图是一个难题. 我选择用highstock做为画图组件,适当的修改了一下源码,参考了数个财经网站的案例,完成了一个不太成熟的K线图,欢迎大家批评指 ...
- WPF中使用amCharts绘制股票K线图
原文:WPF中使用amCharts绘制股票K线图 本想自己用GDI绘图, 通过数据直接绘制一张蜡柱图, 但觉得这样子的功能比较少, 所以到网上搜索一些能画出K线图的控件. 发现DynamicDataD ...
- Wijmo金融图表系列之平均K线图&砖形图
2015年7月16日将会发布有史以来最令人兴奋的控件-Wijmo 金融图表,它的一体化设计为单个自定义集合提供了所有主要的金融图表,这是市场上的其他控件都不具备的独一无二的好处.它像Wijmo其他任意 ...
- Highcharts candlestick(K线图)案例
<!DOCTYPE html> <html lang="en"> <head> <meta charset="UTF-8&quo ...
随机推荐
- springmvc基础篇—拆分配置文件
一般来讲,在企业实际项目中通常会将配置文件设置为两个:spring-mvc.xml.beans.xml,各自管各自的内容,方便管理. 一.在src下增加如下配置文件: <?xml version ...
- MySQL高可用之MHA切换测试(switchover & failover)
Preface I've installed MasterHA yesterday,Now let's test the master-slave switch and failove ...
- Qt Qpushbutton美化问题
昨天在论坛看到一个网友的提问,如下 我想到的第一个就是可能需要重载Pushbutton,不过看到有网友回复可以使用stykesheet解决,今天尝试了一下,还是没有成功, 一下是我使用车重载的Push ...
- 在阿里云上遇见更好的Oracle(四)
2016.5.13,北京,第七届数据库技术大会. 从最初的itpub社区,到后来被it168收购,DBA社区的线下聚会发展成2010年第一届数据库技术大会(DTCC).第一届大会汇聚了社区内活跃的各位 ...
- [ecmagnet][django] 如何使用django的signal
""" 在web开发中, 你可能会遇到下面这种场景: 在用户完成某个操作后, 自动去执行一些后续的操作. 譬如用户完成修改密码后,你要发送一份确认邮件 观察者模式:观察者 ...
- POJ 1144 Network(割点)
Description A Telephone Line Company (TLC) is establishing a new telephone cable network. They are c ...
- vue实战(一):利用vue与ajax实现增删改查
vue实战(一):利用vue与ajax实现增删改查: <%@ page pageEncoding="UTF-8" language="java" %> ...
- lintcode-63-搜索旋转排序数组 II
63-搜索旋转排序数组 II 跟进"搜索旋转排序数组",假如有重复元素又将如何? 是否会影响运行时间复杂度? 如何影响? 为何会影响? 写出一个函数判断给定的目标值是否出现在数组中 ...
- 【SSH】——使用ModelDriven的利与弊
在以往的web开发中,如果要在表单显示什么内容,我们就需要在Action中提前定义好表单显示的所有属性,以及一系列的get和set方法.如果实体类的属性非常多,那么Action中也要定义相同的属性.在 ...
- 一个python游戏源码
#finalPyPong.py import pygame,sys class MyBallClass(pygame.sprite.Sprite): def __init__(self,image_f ...