ELK日志相关
转: Logstash 讲解与实战应用
一、Logstash 介绍
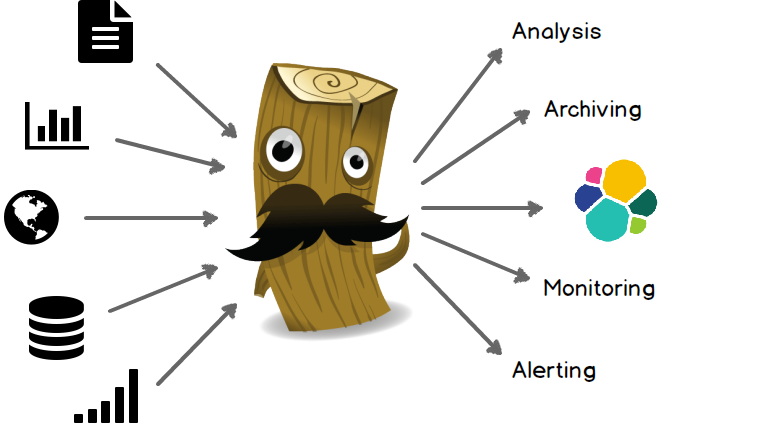
Logstash 是一款强大的数据处理工具,它可以实现数据传输,格式处理,格式化输出,还有强大的插件功能,常用于日志处理。
官网地址:https://www.elastic.co/products/logstash
工作流程
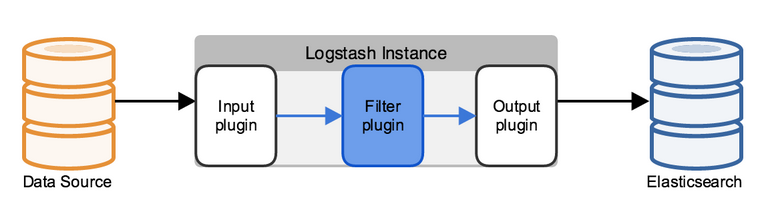
Logstash 工作的三个阶段:
input 数据输入端,可以接收来自任何地方的源数据。
file:从文件中读取
syslog:监听在514端口的系统日志信息,并解析成RFC3164格式。
redis:从redis-server list 中获取
beat:接收来自Filebeat的事件
Filter 数据中转层,主要进行格式处理,数据类型转换、数据过滤、字段添加,修改等,常用的过滤器如下。
grok: 通过正则解析和结构化任何文本。Grok 目前是logstash最好的方式对非结构化日志数据解析成结构化和可查询化。logstash内置了120个匹配模式,满足大部分需求。
mutate: 在事件字段执行一般的转换。可以重命名、删除、替换和修改事件字段。
drop: 完全丢弃事件,如debug事件。
clone: 复制事件,可能添加或者删除字段。
geoip: 添加有关IP地址地理位置信息。
output 是logstash工作的最后一个阶段,负责将数据输出到指定位置,兼容大多数应用,常用的有:
elasticsearch: 发送事件数据到 Elasticsearch,便于查询,分析,绘图。
file: 将事件数据写入到磁盘文件上。
mongodb:将事件数据发送至高性能NoSQL mongodb,便于永久存储,查询,分析,大数据分片。
redis:将数据发送至redis-server,常用于中间层暂时缓存。
graphite: 发送事件数据到graphite。http://graphite.wikidot.com/
statsd: 发送事件数据到 statsd。
二、安装logstash
|
1
2
3
4
5
6
7
8
9
10
11
12
13
14
15
16
17
18
19
20
21
|
# 配置yum源,新建yum文件vim /etc/yum.repos.d/es.repo# 加入以下内容[kibana-4.5]name=Kibana repository for 4.5.x packagesbaseurl=http://packages.elastic.co/kibana/4.5/centosgpgcheck=1gpgkey=http://packages.elastic.co/GPG-KEY-elasticsearchenabled=1[beats]name=Elastic Beats Repositorybaseurl=https://packages.elastic.co/beats/yum/el/$basearchenabled=1gpgkey=https://packages.elastic.co/GPG-KEY-elasticsearchgpgcheck=1# 执行安装指令yum install logstash -y |
三、使用命令行运行一个简单的logstash程序
|
1
2
3
4
5
6
7
8
9
10
|
logstash/bin/logstash -e 'input{stdin{}}output{stdout{codec=>rubydebug}}'# 输入 abc 输出如下{ "message" => "abc", "@version" => "1", "@timestamp" => "2016-08-20T03:33:00.769Z", "host" => "iZ23tzjZ"} |
四、配置语法讲解
logstash使用{ }来定义配置区域,区域内又可以包含其插件的区域配置。
|
1
2
3
4
5
6
7
8
9
10
11
12
13
14
15
16
17
18
19
20
21
22
23
24
25
26
27
28
29
30
31
32
33
34
35
36
37
38
39
40
41
42
43
44
45
46
47
48
49
50
51
52
53
54
55
56
57
58
59
|
# 最基本的配置文件定义,必须包含input 和 output。input{ stdin{ }}output{ stdout{ codec=>rubydebug }}# 如果需要对数据进操作,则需要加上filter段input{ stdin{ }}filter{ # 里面可以包含各种数据处理的插件,如文本格式处理 grok、键值定义 kv、字段添加、 # geoip 获取地理位置信息等等... }output{ stdout{ codec=>rubydebug }}# 可以定义多个输入源与多个输出位置input{ stdin{ } file{ path => ["/var/log/message"] type => "system" start_position => "beginning" }}output{ stdout{ codec=>rubydebug } file { path => "/var/datalog/mysystem.log.gz" gzip => true } } |
启动方式
|
1
2
3
4
5
6
7
8
9
10
11
12
13
14
|
# 通过手动指定配置文件启动/bin/logstash -f /etc/logstash/conf.d/nginx_logstash.conf# 以daemon方式运行,则在指令后面加一个 & 符号/bin/logstash -f /etc/logstash/conf.d/nginx_logstash.conf &# 如果是通过rpm包安装的logstash则可以使用自带的脚本启动/etc/init.d/logstash start # 通过这种方式启动,logstash会自动加载 /etc/logstash/conf.d/ 下的配置文件 |
五、filebeat基本讲解
filebeat是基于原先 logstash-forwarder 的源码开发而来,无需JAVA环境,运行起来更轻便,无疑是业务服务器端的日志收集工具。
配 置
|
1
2
3
4
5
6
7
8
9
10
11
12
13
14
15
16
17
18
19
20
21
22
23
24
25
26
27
28
29
30
31
32
33
34
35
36
37
38
39
40
41
42
43
44
45
46
47
48
49
50
51
52
53
54
55
56
57
58
59
60
61
62
63
64
65
66
67
68
69
70
71
72
73
74
75
76
77
78
79
80
81
82
83
84
85
86
87
88
89
90
91
92
93
94
95
96
97
98
99
100
101
102
103
104
105
106
107
108
109
110
111
112
113
114
115
116
117
118
119
120
121
122
123
124
125
126
127
|
# 配置文件路径 "/etc/filebeat/filebeat.yml"# 一个配置文件可以包含多个prospectors,一个prospectors可以包含多个path。filebeat: # List of prospectors to fetch data. prospectors: # Each - is a prospector. Below are the prospector specific configurations - paths: - /var/log/messages input_type: log document_type: messages - paths: - /alidata/log/nginx/access/access.log.json input_type: log document_type: nginxacclog - paths: - /alidata/www/storage/logs/laravel.log input_type: log document_type: larlog - paths: - /alidata/www/500_error/500_error.log input_type: log document_type: error500 - paths: - /alidata/www/deposit/deposit.log input_type: log document_type: deposit - paths: - /alidata/www/call_error.log input_type: log document_type: call_error - paths: - /alidata/www/weixin_deposit.log input_type: log document_type: weixin_deposit - paths: - /alidata/log/php/php-fpm.log.slow input_type: log document_type: phpslowlog # 多行处理 multiline: pattern: '^[[:space:]]' negate: true match: after # Additional prospectorregistry_file: /var/lib/filebeat/registry############################# Libbeat Config ################################### Base config file used by all other beats for using libbeat features############################# Output ########################################### 输出数据到 redis output: redis: host: "10.122.52.129" port: 6379 password: "123456"# 输出数据到 logstash ,一般两者选用其一 logstash: hosts: ["10.160.8.221:5044"]############################# Shipper #########################################shipper:# 打上服务器tag name: "host_2" ############################# Logging ######################################### logging: files: rotateeverybytes: 10485760 # = 10MB |
filebeat主要配置就是这个配置文件了,设定好之后启动服务就会自动从源拉取数据发送到指定位置,当数据为普通行数据时,filebeat会自动为其添加字段信息,其中一项字段 @timestamp 为filebeat读取到这条数据的时间,默认格式为UTC时间,比中国大陆时间早8小时。
如果数据为json格式,而数据中已包含@timestamp字段,filebeat处理时会把@timestamp字段值替换为filebeat读取到该行数据的当前UTC时间。
六、实战运用
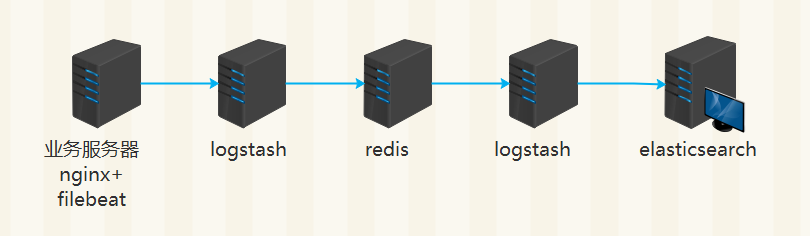
架构一
nginx 日志格式配置
|
1
2
3
4
5
6
7
8
9
10
11
12
13
14
|
log_format json '{"@timestamp":"$time_iso8601",' '"slbip":"$remote_addr",' '"clientip":"$http_x_forwarded_for",' '"serverip":"$server_addr",' '"size":$body_bytes_sent,' '"responsetime":$request_time,' '"domain":"$host",' '"method":"$request_method",' '"requesturi":"$request_uri",' '"url":"$uri",' '"appversion":"$HTTP_APP_VERSION",' '"referer":"$http_referer",' '"agent":"$http_user_agent",' '"status":"$status"}'; |
filebeat 配置
|
1
2
3
4
5
6
7
8
9
10
11
12
13
14
15
16
17
18
19
20
21
22
|
filebeat: # List of prospectors to fetch data. prospectors: # Each - is a prospector. Below are the prospector specific configurations - paths: - /alidata/log/nginx/access/access.log.json input_type: log document_type: nginxacclog ############################# Output ##########################################output: logstash: hosts: ["10.160.8.221:5044"]# 其他部分配置省略。 |
logstash 配置 (此处logstash用于接收filebeat的数据,然后转存redis)
|
1
2
3
4
5
6
7
8
9
10
11
12
13
14
15
16
17
18
19
20
21
22
23
24
25
26
27
28
29
30
31
32
33
34
35
36
37
38
39
40
41
42
43
44
45
46
47
48
49
50
51
52
53
54
55
56
57
|
input { beats { port => 5044 codec => "json"}}filter { if [type] == "nginxacclog" { geoip { source => "clientip" target => "geoip" database => "/u01/elk/logstash/GeoLiteCity.dat" add_field => [ "[geoip][coordinates]","%{[geoip][longitude]}" ] add_field => [ "[geoip][coordinates]","%{[geoip][latitude]}" ]} mutate { convert => [ "[geoip][coordinates]","float" ]}}}output{ if [type] == "nginxacclog" { redis { data_type => "list" key => "nginxacclog" host => "127.0.0.1" port => "26379" password => "123456" db => "0"}} if [type] == "messages" { redis { data_type => "list" key => "messages" host => "127.0.0.1" port => "26379" password => "123456" db => "0"}}} |
logstash 配置 (此处logstash用于读取redis list中的数据,然后转存elasticsearch)
|
1
2
3
4
5
6
7
8
9
10
11
12
13
14
15
16
17
18
19
20
21
22
23
24
25
26
27
28
29
30
31
32
33
34
35
36
37
38
39
40
41
42
43
44
45
46
47
48
49
50
51
52
53
54
55
|
input{ redis { host => "10.10.1.2" port => "26379" db => "0" key => "nginxacclog" threads => 300 password => "123456" data_type => "list" codec => "json"} redis { host => "10.10.1.2" port => "26379" db => "0" key => "messages" password => "123456" threads => 50 data_type => "list" codec => "json"}}output { if [type] == "nginxacclog" { elasticsearch { hosts => ["127.0.0.1:9200"] index => "logstash-nginxacclog-%{+YYYY.MM.dd}" manage_template => true flush_size => 50000 idle_flush_time => 10 workers => 2}} if [type] == "messages" { elasticsearch { hosts => ["127.0.0.1:9200"] index => "logstash-messages-%{+YYYY.MM.dd}" manage_template => true flush_size => 50000 idle_flush_time => 30 workers => 1}}} |
关键指令解释:
threads 开启多少个线程读取redis数据,也就是从redis输入到logstash的速度,线程越多读取速度越快,但是根据接收节点的接收速度来设置,如果输入过快,接收速度不够,则会出现丢数据的情况,设置一个最佳的threads值需要和接收节点做反复测试才能得出。
flush_size 控制logstash向Elasticsearch批量发送数据,上面的配置表示,logstash会努力赞到50000条数据一次发送给Elasticsearch。
idle_flush_time 控制logstash多长时间向Elasticsearch发送一次数据,默认为1秒,根据以上配置,logstash积攒数据未到flush_size 10秒后也会向Elasticsearch发送一次数据。
workers 建议设置为1或2,如果机器性能不错可以设置为2. 不建议设置的更高。
架构二
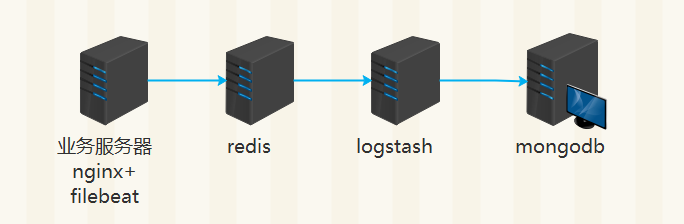
filebeat 配置(从日志文件读取到的数据直接缓存至redis队列)
|
1
2
3
4
5
6
7
8
9
10
11
12
13
14
15
16
17
18
19
20
21
22
23
24
|
filebeat: # List of prospectors to fetch data. prospectors: # Each - is a prospector. Below are the prospector specific configurations - paths: - /alidata/log/nginx/access/access.log.json input_type: log document_type: nginxacclog############################# Output ##########################################output: redis: host: "10.160.8.221" port: 26379 password: "123456" |
document_type 自定义日志类型,在logstash中可通过type判断做不同的处理。
logstash 配置 (此处logstash用于读取redis list中的数据,然后转存mongodb)
|
1
2
3
4
5
6
7
8
9
10
11
12
13
14
15
16
17
18
19
20
21
22
23
24
25
26
27
28
29
30
31
32
33
34
35
36
37
38
39
40
41
42
43
44
45
46
47
|
input { redis { host => "10.160.8.221" port => "26379" key => "filebeat" data_type => "list" password => "123456" threads => 50 } redis { host => "10.160.8.221" port => "26379" key => "mycat" data_type => "list" password => "123456" threads => 50 type => "mycat" } }output {if [type] == "mycat" { mongodb{ collection => "mycat%{+yyyyMMdd}" isodate => true database => "logdb" uri => "mongodb://log_user:123456@10.10.1.102:27017/logdb" }}if [type_xi09wnk] == "nginxacclog" { mongodb{ collection => "nginx_accress%{years_dik3k}%{months_dik3k}%{days_dik3k}" isodate => true database => "logdb" uri => "mongodb://log_user:123456@10.10.1.102:27017/logdb" }}} |
https://blog.csdn.net/qq897958555/article/details/53504221
ELK日志相关的更多相关文章
- 搭建ELK日志分析平台
(上)—— ELK介绍及搭建 Elasticsearch 分布式集群 http://blog.51cto.com/zero01/2079879 (下)—— 搭建kibana和logstash服务器 h ...
- ELK 日志分析体系
ELK 日志分析体系 ELK 是指 Elasticsearch.Logstash.Kibana三个开源软件的组合. logstash 负责日志的收集,处 ...
- ELK日志分析系统的应用
收集和分析日志是应用开发中至关重要的一环,互联网大规模.分布式的特性决定了日志的源头越来越分散, 产生的速度越来越快,传统的手段和工具显得日益力不从心.在规模化场景下,grep.awk 无法快速发挥作 ...
- ELK日志收集平台部署
需求背景 由于公司的后台服务有三台,每当后台服务运行异常,需要看日志排查错误的时候,都必须开启3个ssh窗口进行查看,研发们觉得很不方便,于是便有了统一日志收集与查看的需求. 这里,我用ELK集群,通 ...
- 开源组件ELK日志系统配置与管理
ELK日志系统介绍 开源实时日志分析ELK平台能够完美的解决我们上述的问题,ELK由ElasticSearch.Logstash和Kiabana三个开源工具组成.官方网站:https://www.el ...
- Java中多环境Logback配置与ELK日志发送
Java中多环境Logback配置与ELK日志发送 一.项目基于SpringBoot实现,引入SpringBoot相关库后,本文还要讲上传到ELK的Logstash,所以需要在pom.xml中加入 ...
- CentOs 7.3下ELK日志分析系统搭建
系统环境 为了安装时不出错,建议选择这两者选择一样的版本,本文全部选择5.3版本. System: Centos release 7.3 Java: openjdk version "1.8 ...
- 创业公司做数据分析(四)ELK日志系统 (转)
http://blog.csdn.net/zwgdft/article/details/53842574 作为系列文章的第四篇,本文将重点探讨数据采集层中的ELK日志系统.日志,指的是后台服务中产生的 ...
- 浅谈ELK日志分析平台
作者:珂珂链接:https://zhuanlan.zhihu.com/p/22104361来源:知乎著作权归作者所有.商业转载请联系作者获得授权,非商业转载请注明出处. 小编的话 “技术干货”系列文章 ...
随机推荐
- Android总结之WebView与Javascript交互[转]
Android总结之WebView与Javascript交互 前言: 最近公司的App为了加快开发效率选择了一部分功能采用H5开发,从目前市面的大部分App来讲,大致分成Native App.We ...
- POSTGRESQL 查看用户使用情况以及杀掉相应的进程
一.查看哪些用户在链接数据库 select * from pg_stat_activity ; 这里的pg_stat_activity其实是一个视图,它的定义可以在postgres这个数据库里面的视图 ...
- C++ Standard Library
C++ Standard Library *注:内容主要是对參考1的学习记录.知识点与图片大都来源于该书, 部分知识点与图片来源于參考2. 详细參考信息,见最下方參考. * C++98中新支持的语言特 ...
- Lucene解析 - 基本概念
Elasticsearch 权威指南中文版 https://www.elastic.co/guide/cn/elasticsearch/guide/cn/index.html 对于跳跃表,我们看 ...
- 〖Linux〗在tmux同时使用bash和zsh
个人有两份tmux配置文件: ~/.tmux.conf # 使用zsh,主要是日常使用,zsh太好使用了 ~/.tmux.conf.bash # 使用bash,主要是Android编译使用 按照tmu ...
- RHEL7 添加网卡并设置多个IP地址
首先在虚拟机管理界面中给该虚拟机添加一块虚拟网卡,VirtualBox虚拟机中要shutdown才能添加. [root@rhel7 ~]# nmcli device show | grep -i de ...
- 基于贪心算法求解TSP问题(JAVA)
概述 前段时间在搞贪心算法,为了举例,故拿TSP来开刀,写了段求解算法代码以便有需之人,注意代码考虑可读性从最容易理解角度写,没有优化,有需要可以自行优化! 详细 代码下载:http://www.de ...
- EntityFramework 5.0 CodeFirst 教程02-删除和修改/架构改变异常的处理
-----------------------------------------------------目录--------------------------------------------- ...
- swift3 生成UUID
swift3 生成UUID //获取UUID func getUUID() -> String { let uuidRef = CFUUIDCreate(nil) let uuidStringR ...
- Word2Vec中文语料实战
http://blog.csdn.net/gnehcuoz/article/details/52136371