[elk]elk的诸多beats&&kibana插件
elk的诸多beats
参考: https://www.elastic.co/guide/en/beats/libbeat/current/community-beats.html
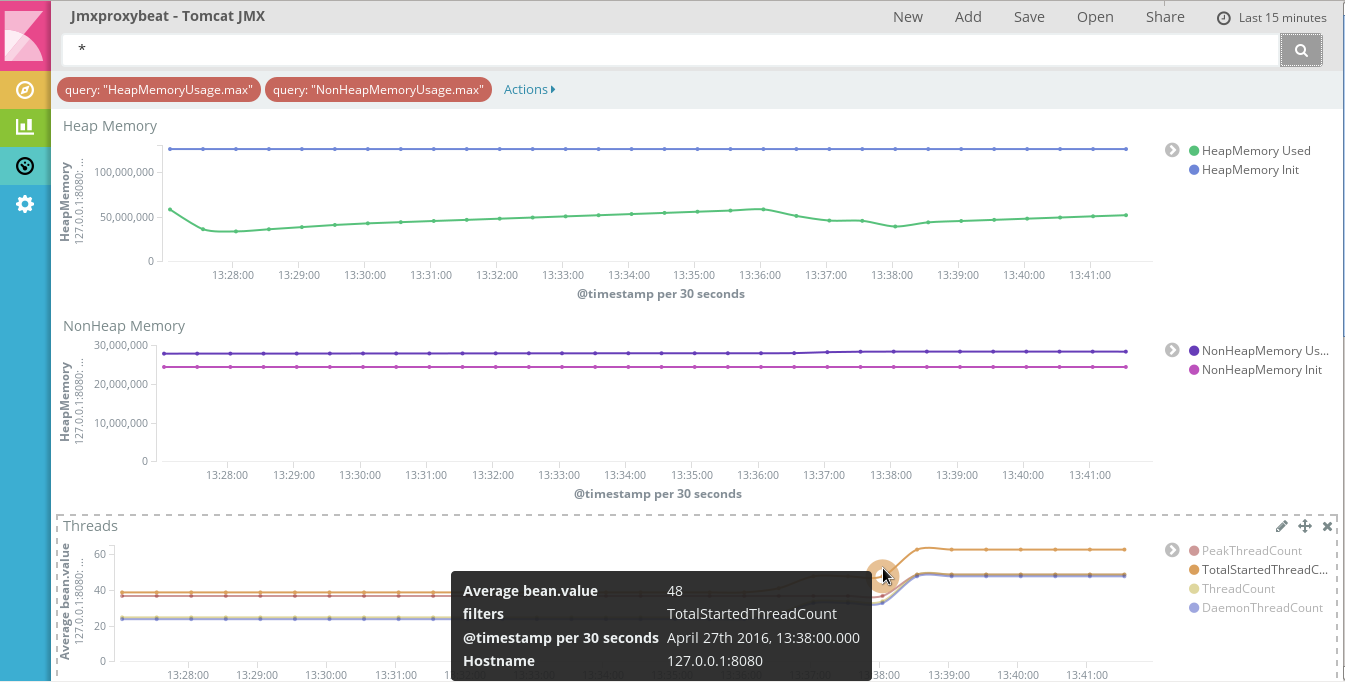
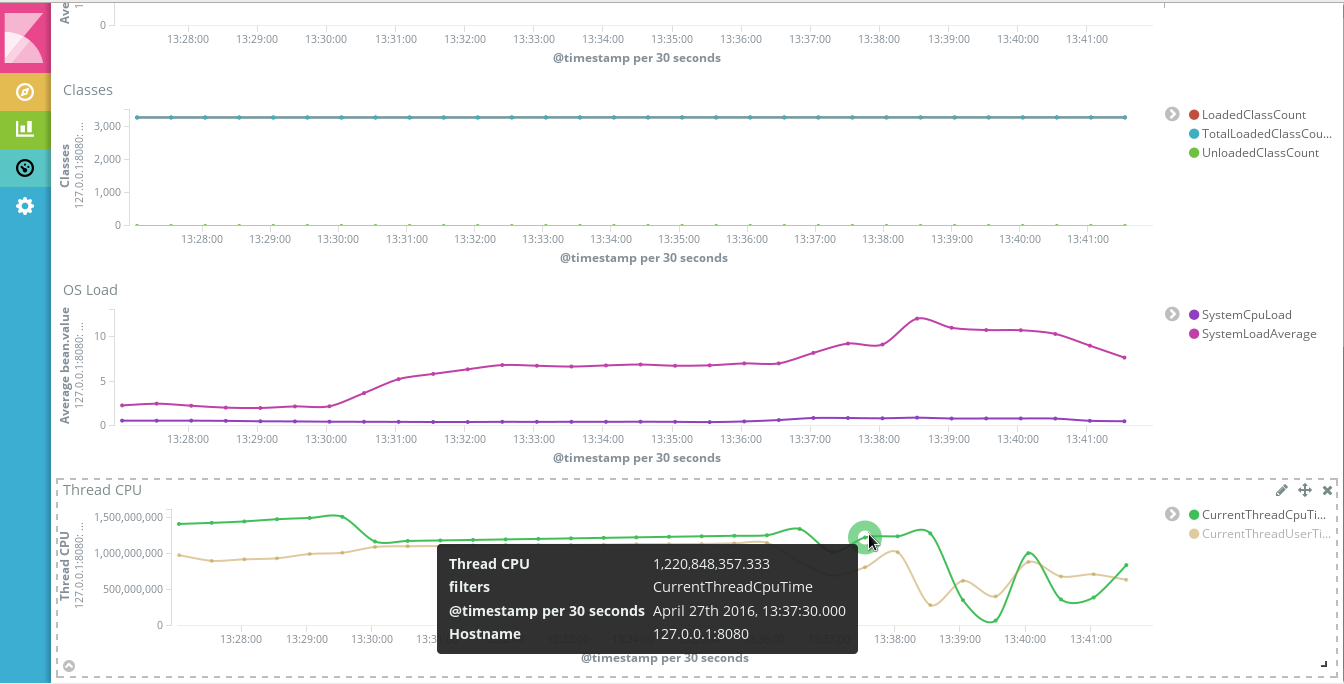
jmxproxybeat
参考: https://github.com/radoondas/jmxproxybeat
Metricbeat
正确姿势启动metricbeat
metricbeat.modules:

- module: system

  metricsets:

    - cpu

    - filesystem

    - memory

    - network

    - process

  enabled: true

  period: 10s

  processes: ['.*']

  cpu_ticks: false

output.elasticsearch:

    hosts: ["http://192.168.x.x:9200"]

setup.template.name: "metricbeat"

setup.template.fields: "fields.yml"

setup.template.overwrite: true

setup.template.settings:

  index.number_of_shards: 1

  index.number_of_replicas: 1

setup.kibana.host: "192.168.x.x:5601"

setup.dashboards.enabled: true
./metricbeat -e -c metricbeat.yml -d "publish"

它有这些指标模块
This section contains detailed information about the metric collecting modules contained in Metricbeat. Each module contains one or multiple metricsets. More details about each module can be found under the links below.

Aerospike

Apache

Ceph

Couchbase

Docker

Dropwizard

Elasticsearch

Golang

HAProxy

HTTP

Jolokia

Kafka

Kibana

Kubernetes

Memcached

MongoDB

MySQL

Nginx

PHP-FPM

PostgreSQL

Prometheus

RabbitMQ

Redis

System

vSphere

Windows

ZooKeeper
amazonbeat

Reads data from a specified Amazon product.

apachebeat

Reads status from Apache HTTPD server-status.

apexbeat

Extracts configurable contextual data and metrics from Java applications via the APEX toolkit.

burrowbeat

Monitors Kafka consumer lag using Burrow.

cassandrabeat

Uses Cassandra’s nodetool cfstats utility to monitor Cassandra database nodes and lag.

cloudflarebeat

Indexes log entries from the Cloudflare Enterprise Log Share API.

cloudfrontbeat

Reads log events from Amazon Web Services CloudFront.

cloudtrailbeat

Reads events from Amazon Web Services' CloudTrail.

cloudwatchmetricbeat

A beat for Amazon Web Services' CloudWatch Metrics.

cloudwatchlogsbeat

Reads log events from Amazon Web Services' CloudWatch Logs.

collectbeat

Adds discovery on top of Filebeat and Metricbeat in environments like Kubernetes.

connbeat

Exposes metadata about TCP connections.

consulbeat

Reads services health checks from consul and pushes them to Elastic.

dockbeat

Reads Docker container statistics and indexes them in Elasticsearch.

elasticbeat

Reads status from an Elasticsearch cluster and indexes them in Elasticsearch.

etcdbeat

Reads stats from the Etcd v2 API and indexes them into Elasticsearch.

execbeat

Periodically executes shell commands and sends the standard output and standard error to Logstash or Elasticsearch.

factbeat

Collects facts from Facter.

flowbeat

Collects, parses, and indexes sflow samples.

gabeat

Collects data from Google Analytics Realtime API.

githubbeat

Easily monitors GitHub repository activity.

gpfsbeat

Collects GPFS metric and quota information.

hsbeat

Reads all performance counters in Java HotSpot VM.

httpbeat

Polls multiple HTTP(S) endpoints and sends the data to Logstash or Elasticsearch. Supports all HTTP methods and proxies.

hwsensorsbeat

Reads sensors information from OpenBSD.

icingabeat

Icingabeat ships events and states from Icinga 2 to Elasticsearch or Logstash.

iobeat

Reads IO stats from /proc/diskstats on Linux.

jmxproxybeat

Reads Tomcat JMX metrics exposed over JMX Proxy Servlet to HTTP.

journalbeat

Used for log shipping from systemd/journald based Linux systems.

kafkabeat

Reads data from Kafka topics.

krakenbeat

Collect information on each transaction on the Kraken crypto platform.

lmsensorsbeat

Collects data from lm-sensors (such as CPU temperatures, fan speeds, and voltages from i2c and smbus).

logstashbeat

Collects data from Logstash monitoring API (v5 onwards) and indexes them in Elasticsearch.

mcqbeat

Reads the status of queues from memcacheq.

mongobeat

Monitors MongoDB instances and can be configured to send multiple document types to Elasticsearch.

mqttbeat

Add messages from mqtt topics to Elasticsearch.

mysqlbeat

Run any query on MySQL and send results to Elasticsearch.

nagioscheckbeat

For Nagios checks and performance data.

nginxbeat

Reads status from Nginx.

nginxupstreambeat

Reads upstream status from nginx upstream module.

nvidiagpubeat

Uses nvidia-smi to grab metrics of NVIDIA GPUs.

openconfigbeat

Streams data from OpenConfig-enabled network devices

packagebeat

Collects information about system packages from package managers.

phpfpmbeat

Reads status from PHP-FPM.

pingbeat

Sends ICMP pings to a list of targets and stores the round trip time (RTT) in Elasticsearch.

prombeat

Indexes Prometheus metrics.

prometheusbeat

Send Prometheus metrics to Elasticsearch via the remote write feature.

protologbeat

Accepts structured and unstructured logs via UDP or TCP. Can also be used to receive syslog messages or GELF formatted messages. (To be used as a successor to udplogbeat)

redditbeat

Collects new Reddit Submissions of one or multiple Subreddits.

redisbeat

Used for Redis monitoring.

retsbeat

Collects counts of RETS resource/class records from Multiple Listing Service (MLS) servers.

rsbeat

Ships redis slow logs to elasticsearch and anlyze by Kibana.

saltbeat

Reads events from salt master event bus.

springbeat

Collects health and metrics data from Spring Boot applications running with the actuator module.

twitterbeat

Reads tweets for specified screen names.

udpbeat

Ships structured logs via UDP.

udplogbeat

Accept events via local UDP socket (in plain-text or JSON with ability to enforce schemas). Can also be used for applications only supporting syslog logging.

unifiedbeat

Reads records from Unified2 binary files generated by network intrusion detection software and indexes the records in Elasticsearch.

uwsgibeat

Reads stats from uWSGI.

varnishlogbeat

Reads log data from a Varnish instance and ships it to Elasticsearch.

varnishstatbeat

Reads stats data from a Varnish instance and ships it to Elasticsearch.

wmibeat

Uses WMI to grab your favorite, configurable Windows metrics.
kibana插件
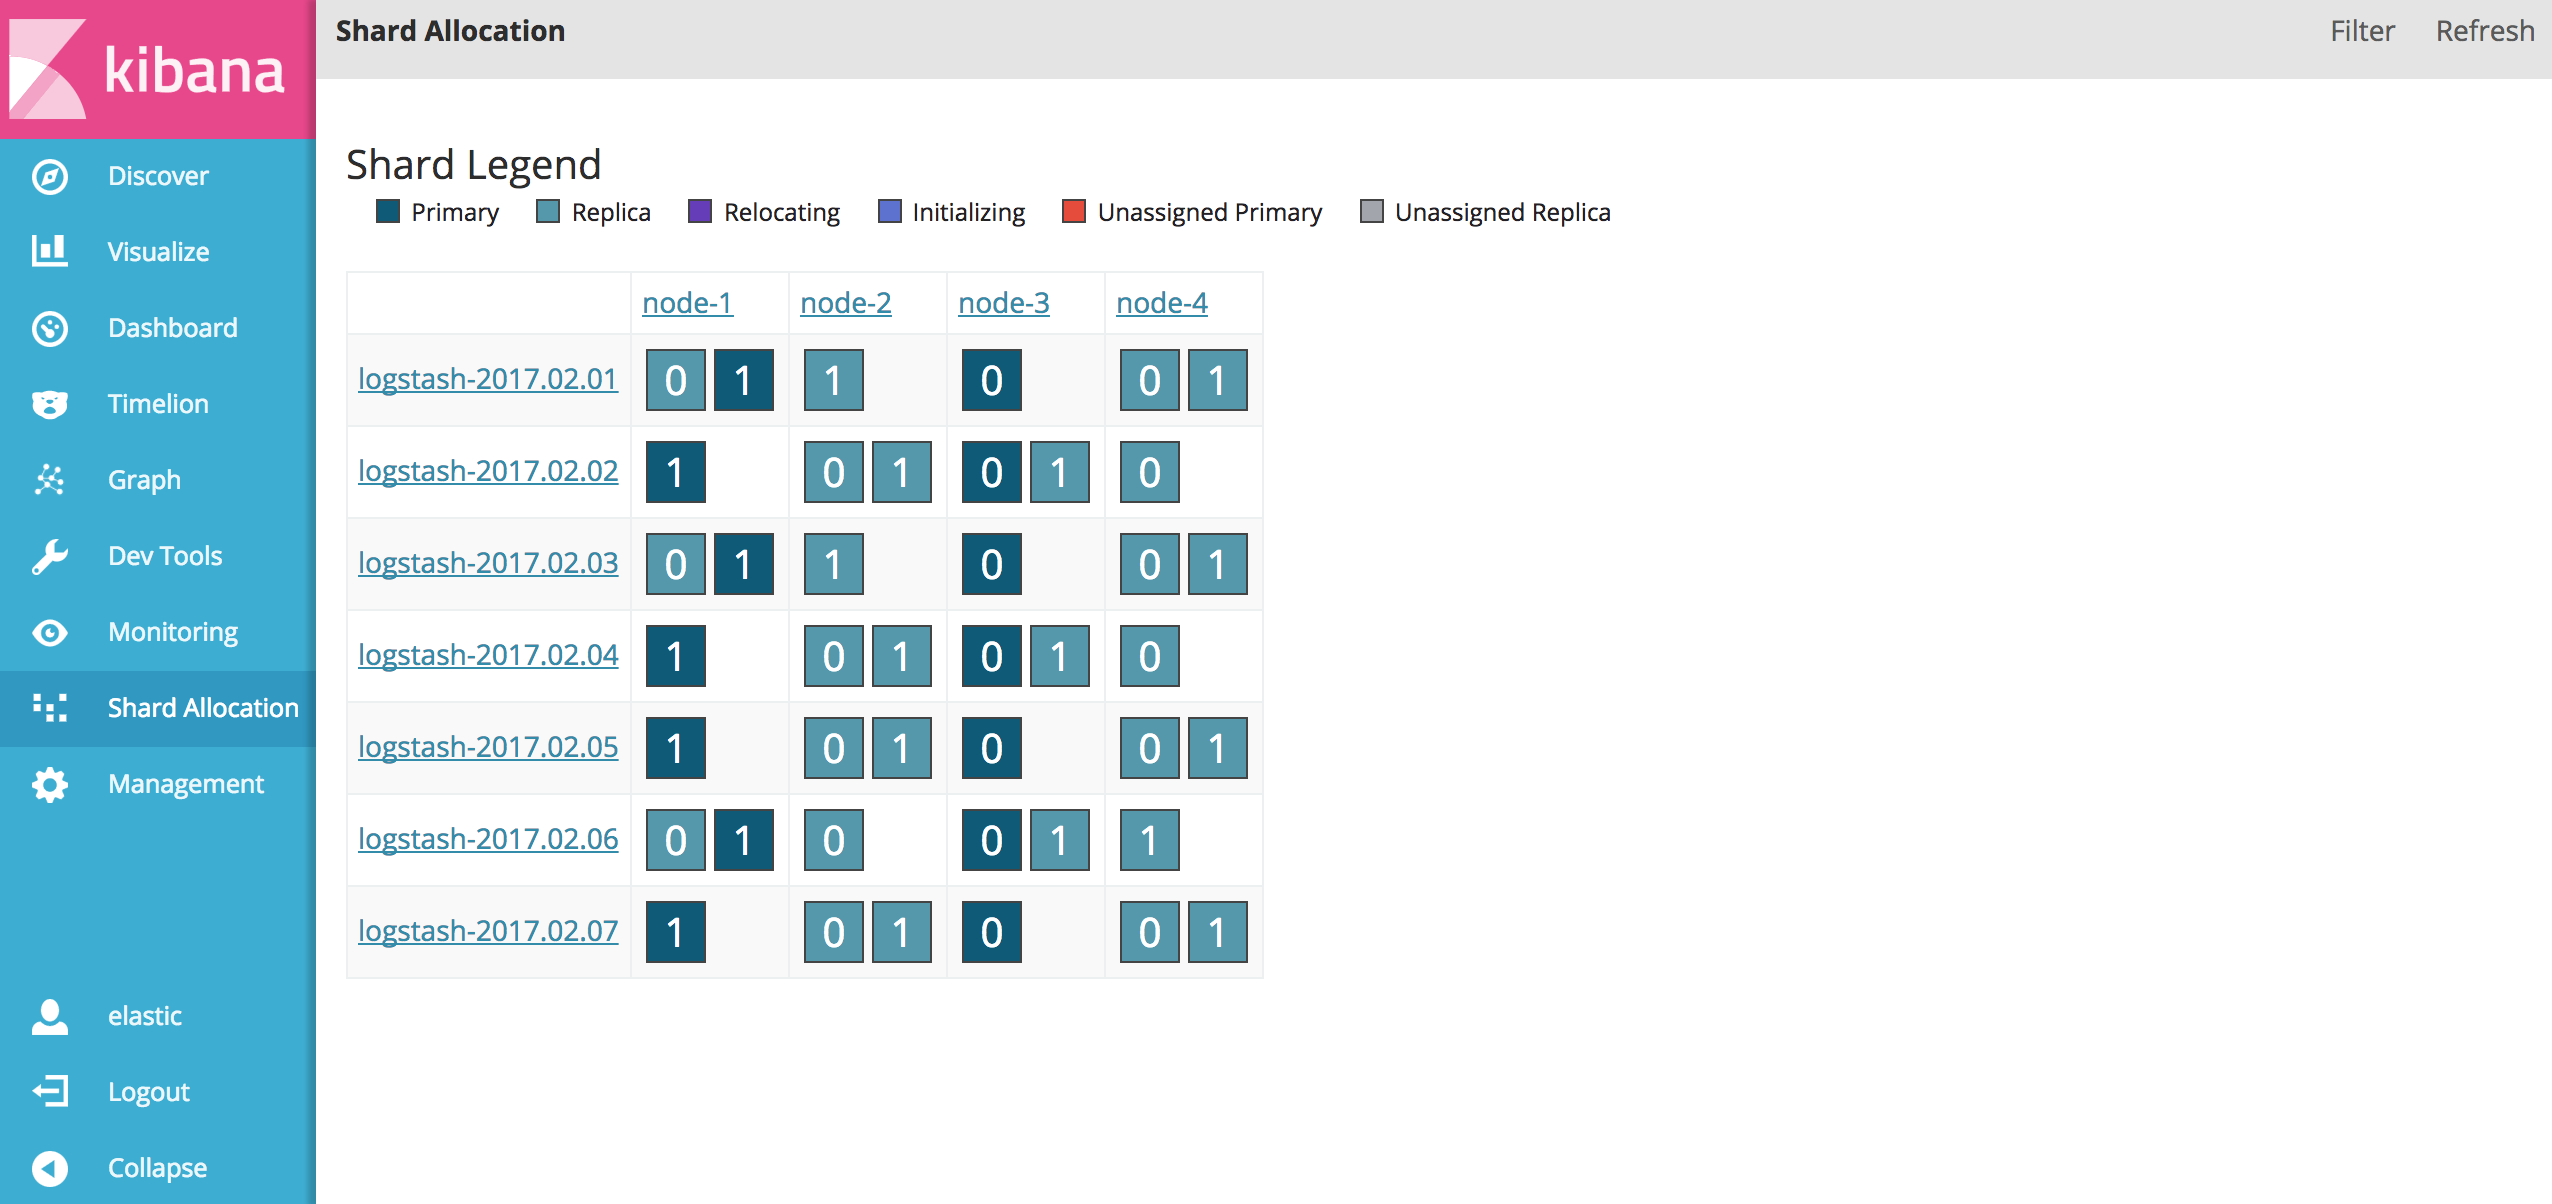
kibana_shard_allocation
参考: https://github.com/asileon/kibana_shard_allocation
mathlion
Mathlion is an advanced math plugin for Kibana's Timelion
参考: https://github.com/fermiumlabs/mathlion
.es(*).math("a=source")  //the variable "a" now contains the elasticsearch query.

.nop().math("a")  //this row now equals the former elasticsearch query

.es(*).math("source") //return the .es(*) query

.es(*).math("source+5") // add 5 to the .es(*) query

.nop().math("a=a+2 ; a=a+3 ")  //adds 5 to a

.nop().math("a=a+2 ; a=a+3 ; a ")  //adds 5 to a and displays a+5

.es(*).math("a=source")  //this query is invisible and does not generate an axis

.es(*).math("a=source; a")  //this query does

.nop.math("sqrt(3^2 + 4^2)") //returns 5

//Calculate power comsumption based on measured current and stimated voltage (in Europe)

.nop().math("electricPower(v,i)=(v*i)")

.es(metric=avg:current).math(machineCurrent=source)

.nop().math("elascPower(230,machineCurrent)")

//plot the horizontal statistical mean and variance

.es(*).math("me=mean(source); va=var(source)")

.value(1).math(me*source)

.value(1).math("(me+sqrt(va))*source")

.value(1).math("(me-sqrt(va))*source")
[elk]elk的诸多beats&&kibana插件的更多相关文章
- 五十七.分布式ELK平台、ES安装 、 扩展插件 、Kibana安装
1. ES集群安装 准备1台虚拟机 部署elasticsearch第一个节点 访问9200端口查看是否安装成功 1ELK是日志分析平台,不是一款软件,而是一整套解决方案,是三个软件产品的首字母缩写 ...
- ELK日志系统:Elasticsearch+Logstash+Kibana+Filebeat搭建教程
ELK日志系统:Elasticsearch + Logstash + Kibana 搭建教程 系统架构 安装配置JDK环境 JDK安装(不能安装JRE) JDK下载地址:http://www.orac ...
- 利用kibana插件对Elasticsearch查询
利用kibana插件对Elasticsearch查询 Elasticsearch是功能非常强大的搜索引擎,使用它的目的就是为了快速的查询到需要的数据. 查询分类: 基本查询:使用Elasticsear ...
- ES 04 - 安装Kibana插件(6.6.0版本)
目录 1 Kibana是什么 2 安装并启动Kibana 2.1 准备安装包 2.2 修改配置文件 2.3 启动Kibana并验证 2.4 关闭Kibana服务 3 Kibana功能测试 3.1 关于 ...
- Kibana插件sentinl实现邮件报警
为什么会突然想用到对日志的异常内容进行邮件报警,是因为在上周公司的线上业务多次出现锁表,开发在优化sql的同时,我也在想是不是可以对日志的异常内容进行检测并实现邮件预警. 在网上查询了一些资料后,决定 ...
- Kibana插件
附加的功能在 Kibana 中是以插件的形式提供的.您可以利用 bin/kibana-plugin 命令来管理这些模块.您也可以手动安装这些插件,只需要将这些插件包放到 plugins 目录并解压到新 ...
- ELK日志系统:Elasticsearch + Logstash + Kibana 搭建教程
环境:OS X 10.10.5 + JDK 1.8 步骤: 一.下载ELK的三大组件 Elasticsearch下载地址: https://www.elastic.co/downloads/elast ...
- ELK日志系统:Elasticsearch + Logstash + Kibana 搭建教程(转)
环境:OS X 10.10.5 + JDK 1.8 步骤: 一.下载ELK的三大组件 Elasticsearch下载地址: https://www.elastic.co/downloads/elast ...
- [Big Data - ELK] ELK(ElasticSearch, Logstash, Kibana)搭建实时日志分析平台
ELK平台介绍 在搜索ELK资料的时候,发现这篇文章比较好,于是摘抄一小段: 以下内容来自: http://baidu.blog.51cto.com/71938/1676798 日志主要包括系统日志. ...
随机推荐
- 3D 坐标变换 公式 推导
[ 更新 ]更好的方法见[用抽象代数讨论仿射变换和仿射空间中的坐标变换] ,以下是之前的内容. 以下的推导 结论是正确的,可是过程有点懵. 以下使用行向量: e1=(1,0,0) e2=(0,1,0) ...
- flume和kafka整合(转)
原文链接:Kafka flume 整合 前提 前提是要先把flume和kafka独立的部分先搭建好. 下载插件包 下载flume-kafka-plus:https://github.com/beyon ...
- HashCode的秘密
看String源码HashCode的计算方式: public int hashCode() {int h = hash;if (h == 0 && value.length > ...
- 第三章 线程安全的DateFormat工具类
1.使用threadLocal包装DateFormat(太复杂,不推荐) 2.使用org.apache.commons.lang3.time.DateFormatUtils下的方法(推荐) DateF ...
- 如何在mysql数据库中保存emoji特殊字符
MySQL在5.5.3版本之后增加了这个utf8mb4的编码,mb4就是most bytes 4的意思,专门用来兼容四字节的unicode.其实,utf8mb4是utf8的超集,理论上原来使用utf8 ...
- 解决.NET 调用JAVA WEBService服务中文乱码问题
主要代码如下: String input ="中文" C#调用代码: String str = System.Text.Encoding.GetEncoding("UT ...
- C++ 相关面试题汇总
多态性与虚函数 (陈维兴教材) (1)所谓多态性就是不同对象在收到相同的消息时,产生不同的动作.直观的说,多态性是指用一个名字定义不同的函数,这些函数执行不同但又类似的操作,从而可以使用相同的方式来调 ...
- libmysqld,嵌入式MySQLserver库
25.1.1. 嵌入式MySQLserver库概述 使用嵌入式MySQLserver库,可以在client应用程序中使用具备所有特性的MySQLserver. 主要长处在于.添加了速度.并使得嵌入式应 ...
- Voice Commands (VCD) Cortana 微软小娜示例
Cortana 样品 您可以创建自定义功能Cortana使用Cortana技能装备或遗留的声音命令(VCD)平台. 在这里,你可以找到相关的样品: Cortana技能装备 目前Cortana技巧是建立 ...
- Linux下双物理网卡设置成虚拟网卡
为了提供网络的高可用我们须要将多块网卡绑定设置成一块虚拟的网卡对外提供服务,这样能够防止一块网卡损坏或者防止网线连接故障造成的连接中断. 以下我们使用eth0与eth1来虚拟成为bond0为例:--- ...