
Windows10+Python3下安装NumPy+SciPy+Matplotlib
Numpy、SciPy、MatplotLib是Python下从事科学计算必不可少的库。我在用其他的方法安装时出现各种问题,发现直接安装.whl包是最快且不报错的方法。
1.下载.whl包
在下面的网站中找需要的.whl文件下载
http://www.lfd.uci.edu/~gohlke/pythonlibs/
要和自己本地安装的版本一致,我选择的whl文件是:
numpy-1.13.0+mkl-cp36-cp36m-win32.whl
scipy-0.19.1-cp36-cp36m-win32.whl
matplotlib-2.0.2-cp36-cp36m-win32.whl
2.开始在命令行安装
>pip3 install c:\(whl文件下载的路径)\numpy-1.13.0+mkl-cp36-cp36m-win32.whl
>pip3 install c:\(whl文件下载的路径)\scipy-0.19.1-cp36-cp36m-win32.whl
>pip3 install c:\(whl文件下载的路径)\matplotlib-2.0.2-cp36-cp36m-win32.whl
如果不出意外,这就都安装好了。
3.开始测试
测试代码来自:http://www.cnblogs.com/jasonfreak/p/5441512.html 感谢作者
 from numpy import array

 from numpy.random import normal

 from matplotlib import pyplot

 def genData():

     heights = []

     weights = []

     grades = []

     N = 10000

     for i in range(N):

         while True:

             # 身高服从均值172,标准差为6的正态分布

             height = normal(172, 6)

             if 0 < height: break

         while True:

             # 体重由身高作为自变量的线性回归模型产生,误差服从标准正态分布

             weight = (height - 80) * 0.7 + normal(0, 1)

             if 0 < weight: break

         while True:

             # 分数服从均值为70,标准差为15的正态分布

             score = normal(70, 15)

             if 0 <= score and score <= 100:

                 grade = 'E' if score < 60 else (

                 'D' if score < 70 else ('C' if score < 80 else ('B' if score < 90 else 'A')))

                 break

         heights.append(height)

         weights.append(weight)

         grades.append(grade)

     return array(heights), array(weights), array(grades)

 # 绘制柱状图

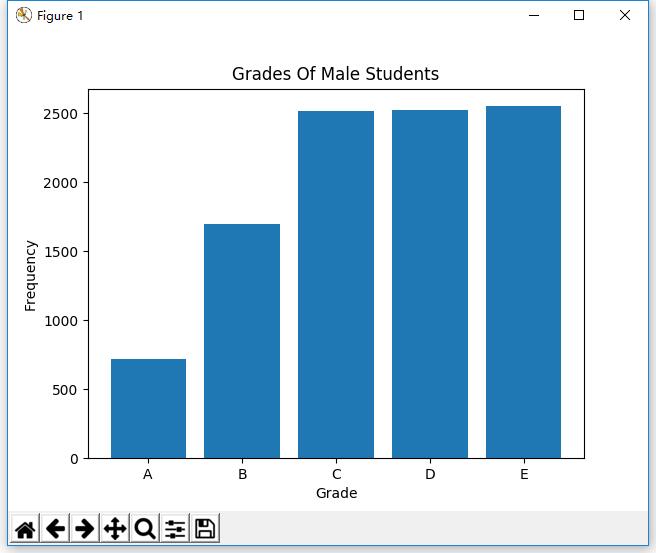
 def drawBar(grades):

     xticks = ['A', 'B', 'C', 'D', 'E']

     gradeGroup = {}

     # 对每一类成绩进行频数统计

     for grade in grades:

         gradeGroup[grade] = gradeGroup.get(grade, 0) + 1

     # 创建柱状图

     # 第一个参数为柱的横坐标

     # 第二个参数为柱的高度

     # 参数align为柱的对齐方式,以第一个参数为参考标准

     pyplot.bar(range(5), [gradeGroup.get(xtick, 0) for xtick in xticks], align='center')

     # 设置柱的文字说明

     # 第一个参数为文字说明的横坐标

     # 第二个参数为文字说明的内容

     pyplot.xticks(range(5), xticks)

     # 设置横坐标的文字说明

     pyplot.xlabel('Grade')

     # 设置纵坐标的文字说明

     pyplot.ylabel('Frequency')

     # 设置标题

     pyplot.title('Grades Of Male Students')

     # 绘图

     pyplot.show()

 #绘制饼形图

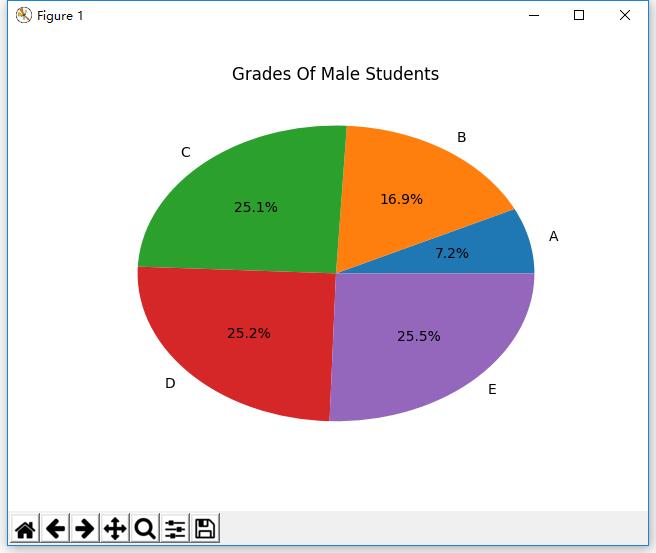
 def drawPie(grades):

     labels = ['A', 'B', 'C', 'D', 'E']

     gradeGroup = {}

     for grade in grades:

         gradeGroup[grade] = gradeGroup.get(grade, 0) + 1

     #创建饼形图

     #第一个参数为扇形的面积

     #labels参数为扇形的说明文字

     #autopct参数为扇形占比的显示格式

     pyplot.pie([gradeGroup.get(label, 0) for label in labels], labels=labels, autopct='%1.1f%%')

     pyplot.title('Grades Of Male Students')

     pyplot.show()

 #绘制直方图

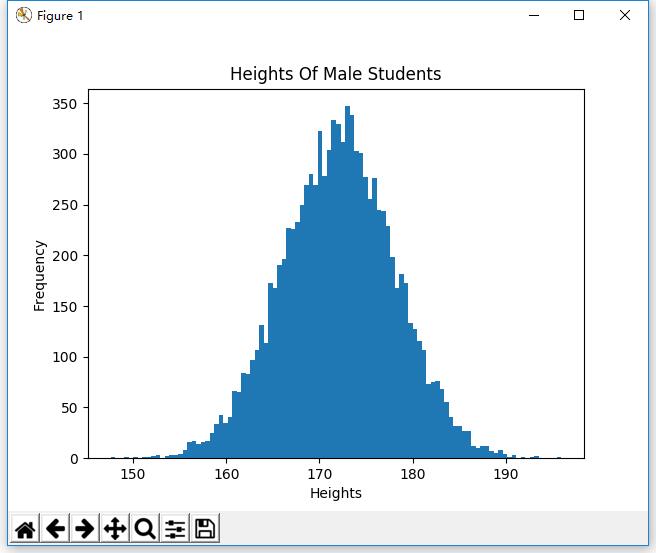
 def drawHist(heights):

     #创建直方图

     #第一个参数为待绘制的定量数据,不同于定性数据,这里并没有事先进行频数统计

     #第二个参数为划分的区间个数

     pyplot.hist(heights, 100)

     pyplot.xlabel('Heights')

     pyplot.ylabel('Frequency')

     pyplot.title('Heights Of Male Students')

     pyplot.show()

 #绘制累积曲线

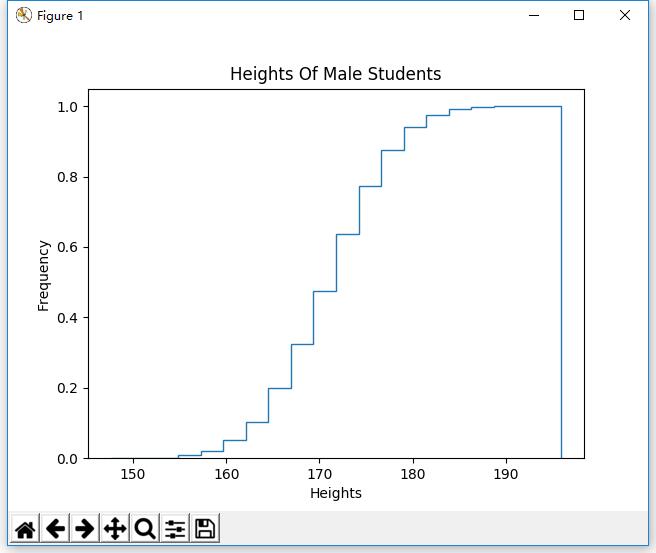
 def drawCumulativeHist(heights):

     #创建累积曲线

     #第一个参数为待绘制的定量数据

     #第二个参数为划分的区间个数

     #normed参数为是否无量纲化

     #histtype参数为'step',绘制阶梯状的曲线

     #cumulative参数为是否累积

     pyplot.hist(heights, 20, normed=True, histtype='step', cumulative=True)

     pyplot.xlabel('Heights')

     pyplot.ylabel('Frequency')

     pyplot.title('Heights Of Male Students')

     pyplot.show()

 #绘制散点图

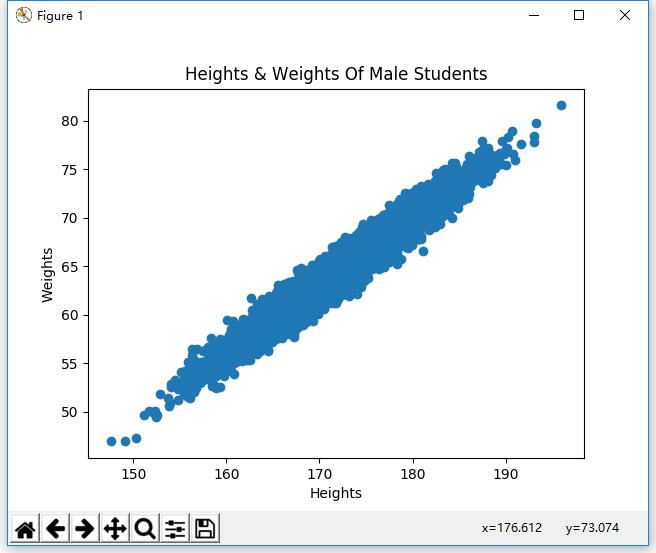
 def drawScatter(heights, weights):

     #创建散点图

     #第一个参数为点的横坐标

     #第二个参数为点的纵坐标

     pyplot.scatter(heights, weights)

     pyplot.xlabel('Heights')

     pyplot.ylabel('Weights')

     pyplot.title('Heights & Weights Of Male Students')

     pyplot.show()

 #绘制箱形图

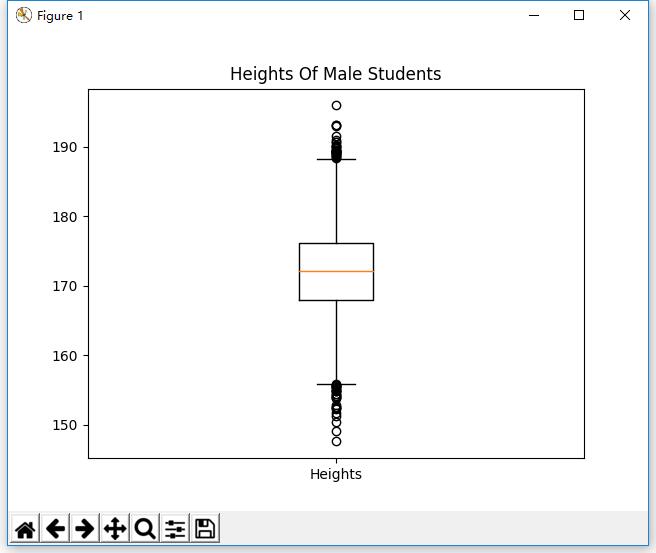
 def drawBox(heights):

     #创建箱形图

     #第一个参数为待绘制的定量数据

     #第二个参数为数据的文字说明

     pyplot.boxplot([heights], labels=['Heights'])

     pyplot.title('Heights Of Male Students')

     pyplot.show()

 data = genData()

 print(data)

 heights = data[0]

 weights = data[1]

 grades = data[2]

 drawBar(grades)

 drawPie(grades)

 drawHist(heights)

 drawCumulativeHist(heights)

 drawScatter(heights, weights)

 drawBox(heights)
运行结果:
drawBar(grades)
drawPie(grades)
drawHist(heights)
drawCumulativeHist(heights)
drawScatter(heights, weights)
drawBox(heights)
成功!
Windows10+Python3下安装NumPy+SciPy+Matplotlib的更多相关文章
- Ubuntu下安装Numpy, SciPy and Matplotlib
Python开发环境包含科学计算,需要安装NumPy, SciPy, Matplotlib.其中Matplotlib依赖于Python和NumPy.我们先安装NumPY和SciPy. Matplot ...
- Linux入门(10)——Ubuntu16.04使用pip3和pip安装numpy,scipy,matplotlib等第三方库
安装Python3第三方库numpy,scipy,matplotlib: sudo apt install python3-pip pip3 install numpy pip3 install sc ...
- win7 64+python2.7.12安装numpy+scipy+matplotlib+scikit-learn
python包下载网址 http://www.lfd.uci.edu/~gohlke/pythonlibs/ 1.已经安装python2.7.12,查看scripts里是否有pip.2.7.9版本以上 ...
- mac安装numpy,scipy,matplotlib
SaintKings-Mac-mini:~ saintking$ python Python ( , ::) [GCC Compatible Apple LLVM (clang-)] on dar ...
- ubuntu下安装numpy和matplotlib
安装NumPy函数库--sudo apt-get install python-numpy 以及 sudo apt-get install python-scipy NumPy函数库的函数查看:Nu ...
- Python中安装numpy,scipy,matplotlib安装方法
这个吧,说简单也简单,说难吧我捣鼓了两天才弄出来,真是头发都急白了.其实只要一个网址就搞定了,嘿嘿 http://www.lfd.uci.edu 这里面有你需要的任何东西,当你运行python imp ...
- Python: Ubuntu 安装numpy,scipy,matplotlib
安装python-dev 安装这个包,以后安装各种python扩展包,可以省很多事情. sudo apt-get install python-dev 使用apt-get 安装 只需要下面的几个命令即 ...
- windows 安装 numpy scipy matplotlib scikit-learn
直接使用 pip install 包名 的方法安装不成功 下载第三方安装包 下载地址:https://www.lfd.uci.edu/~gohlke/pythonlibs/#numpy 根据系统 ...
- win7系统下python安装numpy,matplotlib,scipy和scikit-learn
1.安装numpy,matplotlib,scipy和scikit-learn win7系统下直接采用pip或者下载源文件进行安装numpy,matplotlib,scipy时会遇到各种问题,这是因为 ...
随机推荐
- locate包的安装
linux中locate命令可以快速定位我们需要查找的文件,但是在yum中,locate的安装包名为 mlocate(yum list | grep locate可以查看),安装方法: yum -y ...
- 如何将Wav文件做到EXE文件里
1)编写.RC文件 ..RC文件是资源的源文件,编译器也就编译这个文件,生成.RES的资源文件 首先在我们的项目子目录中建立一个纯文本文件,起名叫Sound.rc,文件中 有一行,内容为: SOUND ...
- 静态网页开发技术-HTML
今天我重新复习了一下静态网页开发技术,概括如下. 一 .HTML文档结构与基本语法 :放置了标签的文本文档,可供浏览器解释执行的网页文件 1.注释标记 2.标记 3.属性 二.基本标记与使用 1.网页 ...
- ArcGIS案例学习笔记3_2
ArcGIS案例学习笔记3_2 联系方式:谢老师,135-4855-4328, xiexiaokui#qq.com 时间:第3天下午 内容:CAD数据导入,建库和管理 目的:生成地块多边形,连接属性, ...
- t检验,T Test (Student’s T-Test)
1.什么是T test? t-test:比较数据的均值,告诉你这两者之间是否相同,并给出这种不同的显著性(即是否是因为偶然导致的不同) The t test (also called Student’ ...
- MD5摘要算法实现
网上找到的实现md5函数代码,包括一个头文件md5.h和一个源文件md5.c,用下面的测试代码test.c测试通过,各文件依次如下: 头文件md5.h: #ifndef MD5_H #define M ...
- Pocket Cube
Pocket Cube http://acm.hdu.edu.cn/showproblem.php?pid=5983 Time Limit: 2000/1000 MS (Java/Others) ...
- Python并发讨论
手段有多线程,多进程,协程. 对于多线程: 由于GIL(全局解释器锁)的存在,多线程实际是单线程的,不能发挥多核的作用: 但对于IO密集型程序,多线程对于效率是有提高的,由于阻塞时,可能会切换到别的线 ...
- ios 工具大全,最全框架
https://www.jianshu.com/p/e280f3348156 [链接]文件分享 - 网盘分享https://share.weiyun.com/5A1aura
- Broadcast总结 service
有时候离开应用就会接收不到系统的广播是因为系统默认发送的广播都会有一个参数 ntent startIntent = new Intent();startIntent.putExtra("pk ...