Debugging a SQL Server query with WinDbg
Debugging a SQL Server query with WinDbg
In my last blog posting I gave you a general introduction to WinDbg, and told you how you can attach the debugger to SQL Server. In today’s blog posting, we will go into a little more detail, and I will show you the steps you need to live debug a SQL Server query with WinDbg. Sound interesting to you? Let’s start!
Imagine you have a simple SQL query in front of you, and you want to debug that specific query within WinDbg. Sounds like a trivial task, but as soon as you start thinking about it, various questions arise:
- How can I identify the correct worker thread within WinDbg, on which my specific query is executed?
- Where within sqlservr.exe should I set a breakpoint?
Let’s concentrate on both questions in a little bit more detail.
Identifying the correct worker thread
When you execute a query within SQL Server, you have by default no idea which thread that query runs on. Fortunately SQL Server provides us with column os_thread_id in the DMVsys.dm_os_threads. That’s the ID of the OS thread that executes a specific query. Unfortunately you need to join between multiple tables to get from sys.dm_exec_requestsdown to sys.dm_os_threads. Let’s have a look at the following query.
|
1
2
3
4
5
6
7
|
SELECT R.Session_Id, Th.os_thread_id FROM sys.dm_exec_requests R
JOIN sys.dm_exec_sessions S ON R.session_id = S.session_id
JOIN sys.dm_os_tasks T ON R.task_address = T.task_address
JOIN sys.dm_os_workers W ON T.worker_address = W.worker_address
JOIN sys.dm_os_threads Th ON W.thread_address = Th.thread_address
WHERE S.is_user_process = 1
GO
|
sqlservr.exe with WinDbg (CTRL + BREAK). To switch to a specific thread based on the OS thread ID thatsys.dm_os_threads reports, you can use the following WinDbg command:
~~[tid]s
The place holder value tid is the actual OS thread ID – as a hex value. Therefore you have to convert the value of the column os_thread_id from sys.dm_os_threads to a hex value, and use it with the above mentioned command. When your OS thread ID is 4910, you would use the following WinDbg command to switch to the correct thread:
~~[132E]s
sys.dm_os_threads only shows you the OS thread ID for your query, when your query is running. Therefore the next question arises: how can I get the *current* OS thread ID for an executing query? I’m using here a simple trick here: in the first step I’m running a simple WAITFOR DELAYcommand (e.g. 1 minute), and afterwards I’m running the actual query. If you use this approach, you have to make sure to submit both T-SQL queries to SQL Server within 1 batch. Otherwise the SQL OS scheduler may put the WAITFORstatement and your actual query on 2 different threads! Let’s have a look at the actual code:
|
1
2
3
4
5
6
7
8
9
10
|
WAITFOR DELAY '00:01:00'
SELECT
soh.*,
d.*
FROM Sales.SalesOrderHeader soh
INNER JOIN Sales.SalesOrderDetail d ON soh.SalesOrderID = d.SalesOrderID
WHERE soh.SalesOrderID = 71832
AND d.SalesOrderDetailID = 111793
GO
|
During the wait interval you have to perform the following actions:
- Retrieve in a different session the OS thread ID for your (waiting) query from sys.dm_os_threads
- Convert the OS thread ID to a hex value
- Break sqlservr.exe with CTRL + BREAK
- Switch to the correct OS thread with the command ~~[tid]s
- Set a breakpoint on the specific thread
- Continue the execution of sqlservr.exe
- Wait until the breakpoint is reached
You have to perform all these actions within the delay that you are causing with the WAITFOR DELAY statement. If you take longer, that approach will not work reliably. Therefore I sugest that you wait a little bit longer in the beginning with the WAITFOR DELAY statement, until you have some experience with that approach.
Setting a “good” breakpoint within sqlservr.exe
You have now retrieved the OS thread ID fromsys.dm_os_threads, and you have suspended the execution ofsqlservr.exe with WinDbg. In the next step you have to set a breakpoint within sqlservr.exe, so that you can debug and single-step through your query. But what is a good break point? It depends ;-). Every operator in an execution plan is implemented as a separate C++ class, which contains different functions. One well-known function is GetRow, which returns one row to the upstream iterator in the execution. My approach is the following one: trying to set a breakpoint in one of the left-most iterators in the execution plan. As far as I have seen from my experiments, every SELECT query starts with a function call tosqlmin!CQueryScan::GetRow.
Setting a breakpoint on that specific class and function should work very well for the beginning. Of course it will take you a very long time (when single-stepping through the code) until you hit interesting parts of the SQL Server Engine, like the B-Tree Manager, or the Latching/Spinlocking implementation. But for the first few experiments you should be fine with a breakpoint on that specific function. You have to make sure to set the breakpoint on the correct thread because you just want to debug your specific query, and nothing else! Setting a breakpoint on a specific thread and symbol name is done with the bm command:
~tid bm sqlmin!CQueryScan::GetRow
But you have to be aware here that you don’t have to supply the OS thread ID. The bm command expects the thread number, which is just a zero-based number. When you switch on the correct OS thread with ~~[132E]s, you will see the thread number in the left bottom part of WinDbg.

When WinDbg reports a thread number like 47, you can set a breakpoint with the following command at the functionsqlmin!CQueryScan::GetRow on the correct thread:
~47 bm sqlmin!CQueryScan::GetRow
After setting the breakpoint, you can continue the execution of sqlservr.exe by using the F5 key. And after a few seconds (depending on the specified delay at the WAITFOR statement) WinDbg should break the execution at the specific breakpoint:
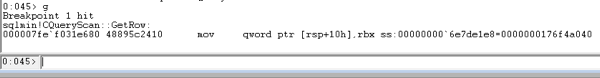
And now the real fun begins: you can explore the current call-stack with the k command, you can single-step through the assembly code, seeing how other functions are called. Your choices are endless, and only limited by your imagination.
Summary
I hope that with today’s blog posting I haven given you a more detailed look into how you can successfully set your first break point within sqlservr.exe to debug a specific query. Over the next weeks and months I’m trying to blog more details on how you can troubleshoot SQL Server with WinDbg. Stay tuned for more fun with WinDbg!
Thanks for reading
-Klaus
Debugging a SQL Server query with WinDbg的更多相关文章
- sql server query to get the list of column name in a table
--SQL Server 2005, 2008 or 2012: SELECT * FROM information_schema.tables --SQL Server 2000: SELECT * ...
- Microsoft SQL Server Query Processor Internals and Architecture
https://msdn.microsoft.com/en-us/library/aa226174(v=sql.70).aspx
- SQL Server Debugging with WinDbg – an Introduction
Klaus Aschenbrenner Klaus Aschenbrenner provides independent SQL Server Consulting Services across E ...
- Server-side Query interception with MS SQL Server
up vote15down votefavorite 5 I'm researching into intercepting queries that arrive at the SQL Serv ...
- SQL Server 2016新特性:Query Store
使用Query Store监控性能 SQL Server Query Store特性可以让你看到查询计划选择和性能.简化了性能调优,可以快速的发现因为查询计划的选择导致的性能的差别.Query Sto ...
- 非常全面的SQL Server巡检脚本来自sqlskills团队的Glenn Berry 大牛
非常全面的SQL Server巡检脚本来自sqlskills团队的Glenn Berry 大牛 Glenn Berry 大牛会对这个脚本持续更新 -- SQL Server 2012 Diagnost ...
- SQL Server 连接问题圣经-命名管道
SQL Server 连接问题圣经-命名管道 (1) APGC DSD Team 12 Jan 2011 1:24 AM 3 一.前言 在使用SQL Server 的过程中,用户遇到的最多的莫过于连接 ...
- SQL Server 优化器+SQL 基础
http://www.cnblogs.com/shanksgao/tag/%E4%BC%98%E5%8C%96%E5%99%A8/ http://www.cnblogs.com/double-K/ca ...
- SQL Server 连接问题-TCP/IP
原文:SQL Server 连接问题-TCP/IP 出自:http://blogs.msdn.com/b/apgcdsd/archive/2012/02/24/ms-sql-server-tcp-ip ...
随机推荐
- hadoop ha集群搭建
集群配置: jdk1.8.0_161 hadoop-2.6.1 zookeeper-3.4.8 linux系统环境:Centos6.5 3台主机:master.slave01.slave02 Hado ...
- python上数据存储 .h5格式或者h5py
最近在做城市计算的项目,数据文件是以.h5的格式存储的,总结下其用法和特点 来自百度百科的简介: HDF(Hierarchical Data Format),可以存储不同类型的图像和数码数据的文件格式 ...
- vue --子父组件传值
1.父组件可以使用 props 把数据传给子组件. 2.子组件可以使用 $emit 触发父组件的自定义事件. vm.$emit( event, arg ) //触发当前实例上的事件 vm.$on( e ...
- 11、JQuery知识点总结
1.JQuery简介 JQuery 是一套跨浏览器的JavaScript库,简化HTML与JavaScript之间的操作 jQuery有下列特色: 跨浏览器的DOM元素选择 DOM巡访与更改:支持CS ...
- STL学习笔记8 -- 函数对象
重载函数调用操作符的类,其对象常称为函数对象(function object),即它们是行为类似函数的对象.一个类对象,表现出一个函数的特征,就是通过“对象名+(参数列表)”的方式使用一个类对象,如果 ...
- PostgreSQL 行排序详解
在查询生成输出表之后,也就是在处理完选择列表之后,你还可以对输出表进行排序. 如果没有排序,那么行将以不可预测的顺序返回(实际顺序将取决于扫描和连接规划类型和在磁盘上的顺序, 但是肯定不能依赖这些东西 ...
- Codeforces Round #418 (Div. 2) A+B+C!
终判才知道自己失了智.本场据说是chinese专场,可是请允许我吐槽一下题意! A. An abandoned sentiment from past shabi贪心手残for循环边界写错了竟然还过了 ...
- java中json依赖包
Exception in thread "main" java.lang.NoClassDefFoundError: org/jaxen/JaxenException 上面的是do ...
- LINUX SHELL脚本攻略笔记[速查]
Linux Shell脚本攻略笔记[速查] 资源 shell script run shell script echo printf 环境变量和变量 pgrep shell数学运算 命令状态 文件描述 ...
- 省选算法学习-插头dp
插头dp?你说的是这个吗? 好吧显然不是...... 所谓插头dp,实际上是“基于连通性的状态压缩dp”的简称,最先出现在cdq的论文里面 本篇博客致力于通过几道小小的例题(大部分都比较浅显)来介绍一 ...