
监控框架 - prometheus
1.关于Prometheus
Prometheus是一个根据应用的metrics来进行监控的开源工具。相信很多工程都在使用它来进行监控,有关详细介绍可以查看官网:https://prometheus.io/docs/introduction/overview/。
容器镜像: prom/prometheus
2.有关Grafana
Grafana是一个开源监控利器,如图所示。
从图中就可以看出来,使用Grafana监控很高大上,提供了很多可视化的图标。
官网地址:https://grafana.com/
3.SpringBoot使用Prometheus
3.1 依赖内容
在SpringBoot中使用Prometheus其实很简单,不需要配置太多的东西,在pom文件中加入依赖,完整内容如下所示。
<?xml version="1.0" encoding="UTF-8"?>

<project xmlns="http://maven.apache.org/POM/4.0.0" xmlns:xsi="http://www.w3.org/2001/XMLSchema-instance"

    xsi:schemaLocation="http://maven.apache.org/POM/4.0.0 http://maven.apache.org/xsd/maven-4.0.0.xsd">

    <modelVersion>4.0.0</modelVersion>

    <parent>

        <groupId>org.springframework.boot</groupId>

        <artifactId>spring-boot-starter-parent</artifactId>

        <version>2.1.3.RELEASE</version>

        <relativePath/> <!-- lookup parent from repository -->

    </parent>

    <groupId>com.dalaoyang</groupId>

    <artifactId>springboot2_prometheus</artifactId>

    <version>0.0.1-SNAPSHOT</version>

    <name>springboot2_prometheus</name>

    <description>springboot2_prometheus</description>

    <properties>

        <java.version>1.8</java.version>

    </properties>

    <dependencies>

        <dependency>

            <groupId>org.springframework.boot</groupId>

            <artifactId>spring-boot-starter-actuator</artifactId>

        </dependency>

        <dependency>

            <groupId>org.springframework.boot</groupId>

            <artifactId>spring-boot-starter-web</artifactId>

        </dependency>

        <dependency>

            <groupId>org.springframework.boot</groupId>

            <artifactId>spring-boot-starter-test</artifactId>

            <scope>test</scope>

        </dependency>

        <dependency>

            <groupId>io.micrometer</groupId>

            <artifactId>micrometer-registry-prometheus</artifactId>

            <version>1.1.3</version>

        </dependency>

    </dependencies>

    <build>

        <plugins>

            <plugin>

                <groupId>org.springframework.boot</groupId>

                <artifactId>spring-boot-maven-plugin</artifactId>

            </plugin>

        </plugins>

    </build>

</project>
3.2 配置文件
配置文件中加入配置,这里就只进行一些简单配置,management.metrics.tags.application属性是本文配合Grafana的Dashboard设置的,如下所示:
spring.application.name=springboot_prometheus

management.endpoints.web.exposure.include=*

management.metrics.tags.application=${spring.application.name}
3.3 设置application
修改启动类,如下所示.
@SpringBootApplication

public class Springboot2PrometheusApplication {

    public static void main(String[] args) {

        SpringApplication.run(Springboot2PrometheusApplication.class, args);

    }

    @Bean

    MeterRegistryCustomizer<MeterRegistry> configurer(

            @Value("${spring.application.name}") String applicationName) {

        return (registry) -> registry.config().commonTags("application", applicationName);

    }

}SpringBoot项目到这里就配置完成了,启动项目,访问http://localhost:8080/actuator/prometheus,如图所示,可以看到一些度量指标。
4.Prometheus配置
4.1 配置应用
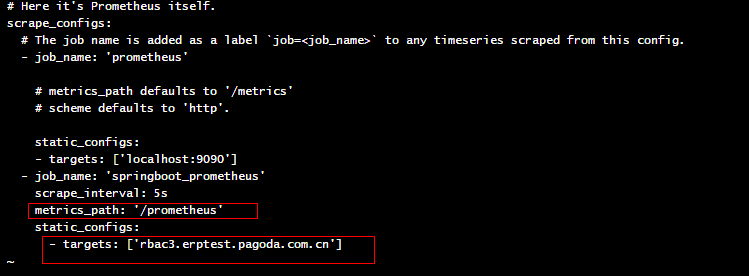
在prometheus配置监控我们的SpringBoot应用,完整配置如下所示。/etc/prometheus/prometheus.yml
# my global config

global:

  scrape_interval:     15s # Set the scrape interval to every 15 seconds. Default is every 1 minute.

  evaluation_interval: 15s # Evaluate rules every 15 seconds. The default is every 1 minute.

  # scrape_timeout is set to the global default (10s).

# Alertmanager configuration

alerting:

  alertmanagers:

  - static_configs:

    - targets:

      # - alertmanager:9093

# Load rules once and periodically evaluate them according to the global 'evaluation_interval'.

rule_files:

  # - "first_rules.yml"

  # - "second_rules.yml"

# A scrape configuration containing exactly one endpoint to scrape:

# Here it's Prometheus itself.

scrape_configs:

  - job_name: 'prometheus'

    static_configs:

    - targets: ['127.0.0.1:9090']

###以下内容为SpringBoot应用配置

  - job_name: 'springboot_prometheus'

    scrape_interval: 5s

    metrics_path: '/actuator/prometheus'

    static_configs:

      - targets: ['127.0.0.1:8080']

注意: targets不能带http:// , metric_path为api的后缀
4.2 启动Prometheus
启动Prometheus,浏览器访问,查看Prometheus页面,如图所示。
点击如图所示位置,可以查看Prometheus监控的应用。
列表中UP的页面为存活的实例,如图所示。
也可以查看很多指数,如下所示。
5.Grafana配置
启动Grafana,配置Prometheus数据源,这里以ID是4701的Doshboard为例(地址:https://grafana.com/dashboards/4701)如图。
在Grafana内点击如图所示import按钮
在如图所示位置填写4701,然后点击load。
接下来导入Doshboard。
导入后就可以看到我们的SpringBoot项目对应的指标图表了,如图。
6.源码
源码地址:https://gitee.com/dalaoyang/springboot_learn/tree/master/springboot2_prometheus

监控框架 - prometheus的更多相关文章
- 监控框架 - prometheus - 参数指标
基于SpringBoot2.0+ Actuator metrics的监控(基于Oracle JDK9,G1) 引言 SpringBoot2在spring-boot-actuator中引入了microm ...
- Inotify: 高效、实时的Linux文件系统事件监控框架
Inotify: 高效.实时的Linux文件系统事件监控框架 概要 - 为什么需要监控文件系统? 在日常工作中,人们往往需要知道在某些文件(夹)上都有那些变化,比如: 通知配置文件的改变 ...
- Kafka监控框架介绍
前段时间在想Kafka怎么监控.怎么知道生产的消息或消费的消费是否有丢失,目前有几个开源的Kafka监控框架这里整理了下,不过这几个框架都有各自的问题侧重点不一样: 1.Kafka Monitor 2 ...
- akka监控框架设计
本博客介绍一种AOP.无侵入的akka监控方案,方便大家在生产使用akka的过程中对akka进行监控. 对于自身javaer来说,AOP三个字母基本就解释清楚了akka监控框架的原理.哈哈哈,不过我这 ...
- 你必须知道的容器监控 (3) Prometheus
本篇已加入<.NET Core on K8S学习实践系列文章索引>,可以点击查看更多容器化技术相关系列文章.上一篇介绍了Google开发的容器监控工具cAdvisor,但是其提供的操作界面 ...
- Spring Boot Metrics监控之Prometheus&Grafana(转)
欢迎来到Spring Boot Actuator教程系列的第二部分.在第一部分中,你学习到了spring-boot-actuator模块做了什么,如何配置spring boot应用以及如何与各样的ac ...
- 性能测试之服务器监控和Prometheus推荐
服务器的监控,也是采用Prometheus和Grafana.可以监控服务器系统负载.CPU使用率.网络流量.磁盘使用率.磁盘读写速度.IO耗时.网络信息. 效果图 安装使用 安装启动node_expo ...
- 第七模块 :微服务监控告警Prometheus架构和实践
119.监控模式分类~1.mp4 logging:日志监控,Logging 的特点是,它描述一些离散的(不连续的)事件. 例如:应用通过一个滚动的文件输出 Debug 或 Error 信息,并通过日志 ...
- Docker监控平台prometheus和grafana,监控redis,mysql,docker,服务器信息
Docker监控平台prometheus和grafana,监控redis,mysql,docker,服务器信息 一.通过redis_exporter监控redis 1.1 下载镜像 1.2 运行服务 ...
随机推荐
- Winform配置文件读写操作
前言 在项目当中为了增加软件的灵活性及可配置性,配置文件在程序当中起着不可替代的作用.下面介绍一下最近用的比较多的方式. config文件的操作 数据库连接字符串 1.获取连接字符串 public s ...
- FastAPI(56)- 使用 Websocket 打造一个迷你聊天室
背景 在实际项目中,可能会通过前端框架使用 WebSocket 和后端进行通信 这里就来详细讲解下 FastAPI 是如何操作 WebSocket 的 模拟 WebSocket 客户端 #!usr/b ...
- spring 创建Bean最全实现方法
创建bean方式,spring创建bean的方式包含:自动注入方式和人工注入方式.分别为:1)xml 配置化方式 2)@bean注解注入方式3)@Component方式 4)接口注入方式 5)imp ...
- HTTP基础系列之:一文搞懂URL
一般我们日常在上网的时候,会在浏览器的地址栏里输入一个网站的 "网址",点击下回车,就会跳到你想去的网站,就类似这样 但其实,叫做 "网址" 并不是特别的准确, ...
- Spatial Analyst 工具-数学分析
数学分析 # Process: Abs arcpy.gp.Abs_sa("", 输出栅格) # Process: Exp arcpy.gp.Exp_sa("", ...
- 初学python-day6 for循环和流程控制(已更新循环做三角形图形!!)
for循环 1.格式 for 变量 in 集合: 循环体 2.概述 当程序执行for循环,按顺序从集合中获取元素变量保存当前循环得到的值,再去执行循环体.当集合中数据都被取完,则此刻跳 ...
- 跟着老猫一起来学GO,环境搭建
老猫的GO学习系列博客已经正式发车了,相信大家以前学习一门编程语言的时候也有经验,咱们一般都是从环境开始,在此呢,大家也跟着老猫从最开始的搭建环境开始. GO语言的安装 首先呢,我们开始需要下载GO语 ...
- 改善深层神经网络-week3编程题(Tensorflow 实现手势识别 )
TensorFlow Tutorial Initialize variables Start your own session Train algorithms Implement a Neural ...
- kivy Label触发事件
kivy label也可以触发事件,为什么只有我这么无聊学垃圾kivy """ 在通过ref标记一段文本后点击这段文本就可以触发'on_ref_press'事件,在该事 ...
- [no_code][Alpha]发布声明报告
项目 内容 2020春季计算机学院软件工程(罗杰 任健) 2020春季计算机学院软件工程(罗杰 任健) 作业要求 发布声明 我们在这个课程的目标是 设计出一个OCR表单处理软件 这个作业在哪个具体方面 ...