prometheus 标签使用
标签的配置使用
考虑到要明智地使用标签,我们需要给事物重新命名。在一个集中的、复杂的监视环境中,我们有时无法控制正在监视的所有资源以及它们公开的监视数据。重新标记允许在自己的环境中控制、管理和潜在地标准化度量。
常见的用例是 :
- 删除不必要的指标。
- 从指标中删除敏感或不需要的签。
- 添加、编辑或修改指标的签值格式。
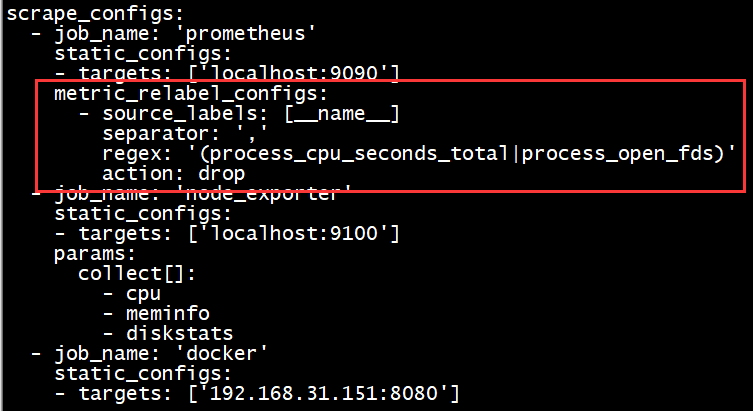
删除metrics
scrape_configs:

  - job_name: 'prometheus'

    static_configs:

    - targets: ['localhost:9090']

    metric_relabel_configs:

      - source_labels: [__name__]

        separator: ','

        regex: '(process_cpu_seconds_total|process_open_fds)'

        action: drop

  - job_name: 'node_exporter'

    static_configs:

    - targets: ['localhost:9100']

    params:

      collect[]:

        - cpu

        - meminfo

        - diskstats

  - job_name: 'docker'

    static_configs:

    - targets: ['192.168.31.151:8080']
备注:如果我们指定了多个源标签,需要用 ; 分开:
regex1;regex2;regex3
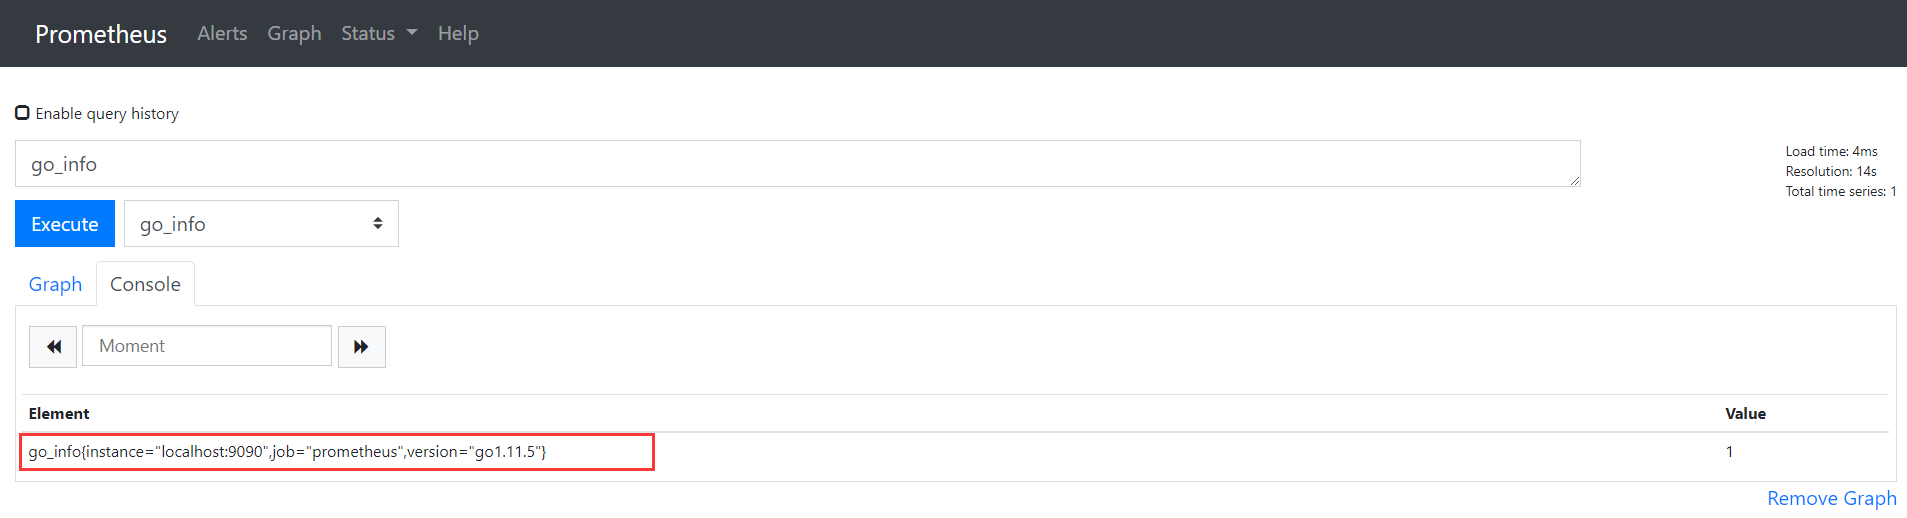
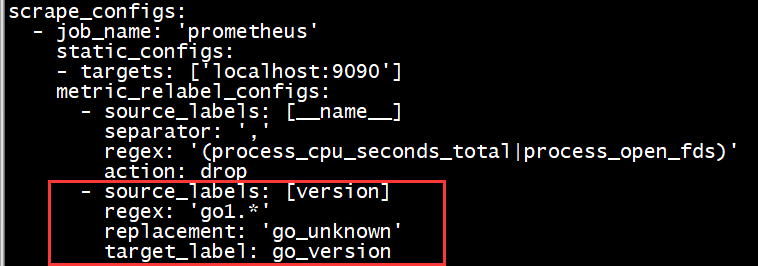
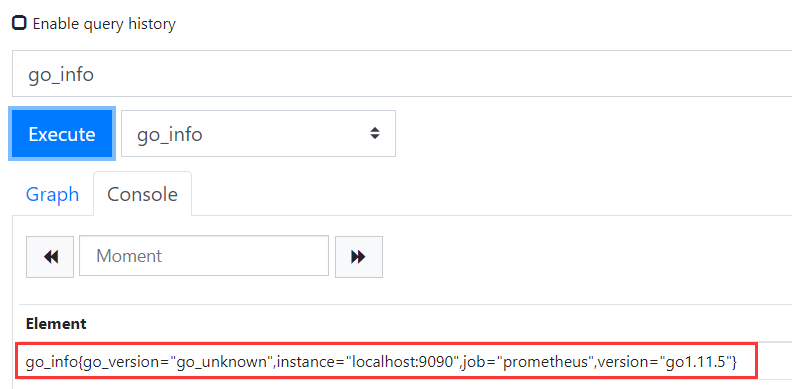
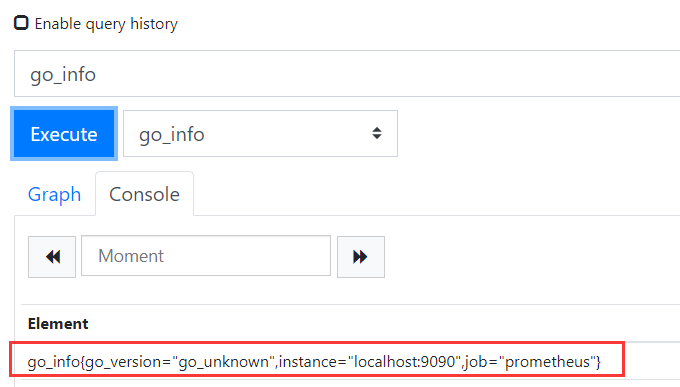
替换标签
实际上是根据已有的标签,生成一个新标签
scrape_configs:

  - job_name: 'prometheus'

    static_configs:

    - targets: ['localhost:9090']

    metric_relabel_configs:

      - source_labels: [__name__]

        separator: ','

        regex: '(process_cpu_seconds_total|process_open_fds)'

        action: drop

      - source_labels: [version]

        regex: 'go1.*'

        replacement: 'go_unknown'

        target_label: go_version

  - job_name: 'node_exporter'

    static_configs:

    - targets: ['localhost:9100']

    params:

      collect[]:

        - cpu

        - meminfo

        - diskstats

  - job_name: 'docker'

    static_configs:

    - targets: ['192.168.31.151:8080']
删除标签
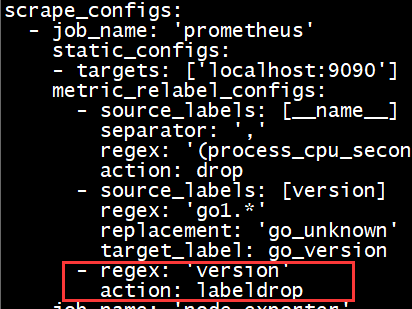
scrape_configs:

  - job_name: 'prometheus'

    static_configs:

    - targets: ['localhost:9090']

    metric_relabel_configs:

      - source_labels: [__name__]

        separator: ','

        regex: '(process_cpu_seconds_total|process_open_fds)'

        action: drop

      - source_labels: [version]

        regex: 'go1.*'

        replacement: 'go_unknown'

        target_label: go_version

      - regex: 'version'

        action: labeldrop

  - job_name: 'node_exporter'

    static_configs:

    - targets: ['localhost:9100']

    params:

      collect[]:

        - cpu

        - meminfo

        - diskstats

  - job_name: 'docker'

    static_configs:

    - targets: ['192.168.31.151:8080']
prometheus 标签使用的更多相关文章
- Prometheus 标签使用示例整合
Prometheus 监控实例 一.Prometheus 根据标签聚合总CPU使用率 1.主机添加标签(可在多个主机内添加相同标签实现聚合):vim prometheus.conf static_co ...
- prometheus 标签修改promSQL
relabel_configs 根据prometheus 监控k8s配置文件中学习 未修改前默认配置文件: 网页显示: 修改配置文件后: 网页显示: 服务发现网页: 总结: 在数据采集之前对任何目标的 ...
- Prometheus 运维监控
Prometheus 运维监控 1.Prometheus 介绍详解 2.Prometheus 安装部署 3.Prometheus 配置文件详解 4.Prometheus PromSQL 常用资源 5. ...
- Prometheus联邦
联邦使得一个 Prometheus 服务器可以从另一个 Prometheus 服务器提取选定的时序. 1. 使用场景 Prometheus 联邦有不同的使用场景.通常,联邦被用来实现可扩展的 Prom ...
- 了解Prometheus
了解Prometheus 标签(空格分隔): 监控 介绍 Prometheus是用来收集和存储服务器的实时数据(比如:CPU.硬盘.服务响应.日志等),通过其丰富的运算函数,可以计算得到很多的服务性能 ...
- Kubernetes 监控--Prometheus
在早期的版本中 Kubernetes 提供了 heapster.influxDB.grafana 的组合来监控系统,在现在的版本中已经移除掉了 heapster,现在更加流行的监控工具是 Promet ...
- Kubernetes日志系统新贵Loki-Stack
Loki简介 Grafana Loki是可以组成功能齐全的日志记录堆栈的一组组件. 与其他日志记录系统不同,Loki是基于仅索引有关日志的元数据的想法而构建的:标签(就像Prometheus标签一样) ...
- Loki日志系统
一.概述 背景 Loki的第一个稳定版本于2019年11月19日发布,是 Grafana Labs 团队最新的开源项目,是一个水平可扩展,高可用性,多租户的日志聚合系统. Grafana 对 Loki ...
- Grafana Loki 架构
转载自:https://mp.weixin.qq.com/s?__biz=MzU4MjQ0MTU4Ng==&mid=2247492186&idx=2&sn=a06954384a ...
随机推荐
- 搭建一个dubbo+zookeeper平台
本篇主要是来分享从头开始搭建一个dubbo+zookeeper平台的过程,其中会简要介绍下dubbo服务的作用. 首先,看下一般网站架构随着业务的发展,逻辑越来越复杂,数据量越来越大,交互越来越多之后 ...
- 【重新发布,代码开源】FPGA设计千兆以太网MAC(1)——通过MDIO接口配置与检测PHY芯片
原创博客,转载请注明出处:[重新发布,代码开源]FPGA设计千兆以太网MAC(1)——通过MDIO接口配置与检测PHY芯片 - 没落骑士 - 博客园 https://www.cnblogs.com/m ...
- IOS开发protocol使用
1.什么是protocol? protocol(协议)是用来定义对象的属性和行为,用于回调. 2.protocol分类? 协议中有三个修饰关键字@required和@optional和@propert ...
- ansible学习基础知识和模块(一)
基础知识补充: 常用自动化运维工具 Ansible:使用python来开发的,无需设置Agentless(代理),一般管理几百台.与ssh的方式也不一样,ssh是基于c/s模式(客户端+服务器)来使用 ...
- eclipse search java 可以搜到 source.jar里的
eclipse search java 可以搜到 source.jar里的
- 替换空格[by Python]
题目: 请实现一个函数,将一个字符串中的空格替换成“%20”.例如,当字符串为We Are Happy.则经过替换之后的字符串为We%20Are%20Happy. 1.使用python自带的repla ...
- python3 time模块
import time '''查看系统时间拿到的是一个数字(时间戳)从1970-01-01 00:00:00开始计算,以秒为单位'''print(time.time()) 执行结果:155650817 ...
- codeforces#439 D. Devu and his Brother (二分)
题意:给出a数组和b数组,他们的长度最大1e5,元素范围是1到1e9,问你让a数组最小的数比b数组最大的数要大需要的最少改变次数是多少.每次改变可以让一个数加一或减一 分析:枚举a数组和b数组的所有的 ...
- Flask中使用数据库连接池 DBUtils ——(4)
DBUtils是Python的一个用于实现数据库连接池的模块. 此连接池有两种连接模式: 模式一:为每个线程创建一个连接,线程即使调用了close方法,也不会关闭,只是把连接重新放到连接池,供自己线程 ...
- 接口请求,上传byte数组byte[]数据异常,负数变正数/负数变63
一.背景 最近项目中有个需求,就是需要把一个byte[]数组上传到服务端.但是我发现发送的byte数组和服务端接收的数组不一样,所有的正数在传递时正确,数组长度也没变化,但是负数变成了63或者负数全部 ...