Springboot 2.0.x 引入链路跟踪Sleuth及Zipkin
Zipkin是一种分布式跟踪系统,它有助于收集解决微服务架构中得延迟问题所需的时序数据,它管理这些数据的收集和查找。
1. 架构概述
跟踪器存在于您的应用程序中,并记录有关发生的操作的时间和元数据。他们经常使用库,因此它们的使用对用户是透明的。例如,已检测的Web服务器会在收到请求时以及何时发送响应时进行记录。收集的跟踪数据称为Span。
编写仪器是为了安全生产并且开销很小。出于这个原因,它们只在带内传播ID,以告诉接收器正在进行跟踪。Zipkin带外报告已完成的跨度,类似于应用程序异步报告度量标准的方式。
例如,在跟踪操作并且需要发出传出的http请求时,会添加一些标头来传播ID。标头不用于发送操作名称等详细信息。
将数据发送到Zipkin的检测应用程序中的组件称为Reporter。记者通过几种传输之一将跟踪数据发送到Zipkin收集器,这些收集器将跟踪数据保存到存储中。稍后,API会查询存储以向UI提供数据。
描述此流程,如下图表:
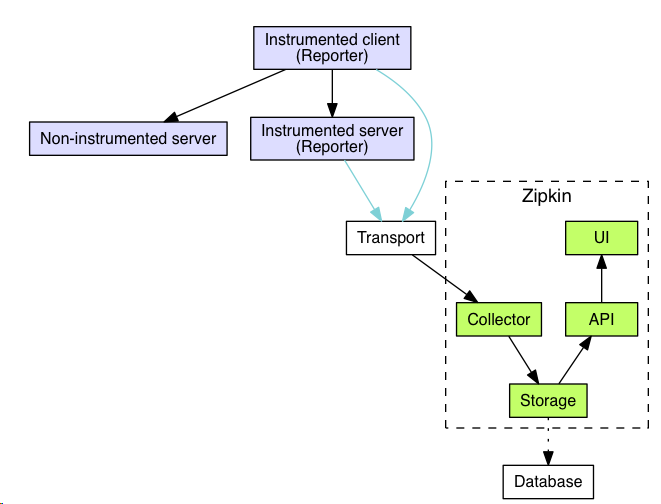
Zipkin作为一个收藏家,一旦跟踪数据到达Zipkin收集器守护程序,它就会被Zipkin收集器验证,存储和索引查找。
Zipkin查询服务,一旦数据被存储和索引,我们需要一种方法来提取它。查询守护程序提供了一个简单的JSON API,用户查找和检索跟踪。
参考官网:https://zipkin.io/
2. 快速开始
本文,我们将介绍构建和启动Zipkin实例,以便在本地检查Zipkin。根据官网显示,有三种选择:使用Java、Docker或从源代码运行。
如果您熟悉Docker,这是首选的方法。如果您不熟悉Docker,请尝试通过Java或源代码运行。
Zipkin分为两端,一个是Zipkin服务端,一个是Zipkin客户端(微服务应用)。客户端会配置服务端的URL地址,一旦服务间调用的时候,会被配置在微服务里面的Sleuth的监听器监听,并生成相应的Trace和Span信息发送给服务端。
发送的方式主要有两种,一种是Http报文的方式,还有一种是消息总线的方式如:RabbitMQ
我们这边采用的是Http报文的方式。
Zipkin服务端构建
1. 引入依赖
解析:主要引入两个Jar:zipkin-server、zipkin-autoconfigure-ui,其中对应的版本为:2.12.2。
zipkin-server 本身包含了 log4j,如果系统已经引入log4j包,为了避免冲突,需要在此处将本jar包去除。
<dependencies>

        <!-- zipkin server -->

        <dependency>

            <groupId>io.zipkin.java</groupId>

            <artifactId>zipkin-server</artifactId>

            <exclusions>

                <exclusion>

                    <groupId>org.springframework.boot</groupId>

                    <artifactId>spring-boot-starter-log4j2</artifactId>

                </exclusion>

            </exclusions>

            <version>${zipkin}</version>

        </dependency>

        <!-- zipkin ui -->

        <dependency>

            <groupId>io.zipkin.java</groupId>

            <artifactId>zipkin-autoconfigure-ui</artifactId>

            <version>${zipkin}</version>

        </dependency>

    </dependencies>
2. 配置文件
spring:

  application:

    name: zipkin-server

  security:

    user:

      name: zhangsan

      password: 111111

---

# 服务端口

server:

  port: 9411

---

eureka:

  instance:

    # 解决健康节点权限问题 将用户名及密码放入eureka的元数据中

    metadata-map:

      user.name: ${spring.security.user.name}

      user.password: ${spring.security.user.password}

  client:

    service-url:

      defaultZone: http://${spring.security.user.name}:${spring.security.user.password}@peer1:8761/eureka/,http://${spring.security.user.name}:${spring.security.user.password}@peer2:8762/eureka/

---

# 客户端负载均衡器

ribbon:

  ConnectTimeout: 3000 # 客户端连接超时

  ReadTimeout: 60000 # 客户端读取超时

  MaxAutoRetries: 1 # 当前环境最大重试次数

  MaxAutoRetriesNextServer: 2 # 其他环境最大重试次数

  eureka:

      enabled: true

---

hystrix:

  command:

    default:

      execution:

        timeout:

          enabled: false

---

# 关闭自动配置启用所有请求得检测

management:

  metrics:

    web:

      server:

        auto-time-requests: true
注:如果配置文件中没有添加“management.metrics.web.server.auto-time-requests=false”,默认为 开启自动检测请求
在启动zipkin-server过程中,会报以下问题:
java.lang.IllegalArgumentException: Prometheus requires that all meters with the same name have the same set of tag keys. There is already an existing meter containing tag keys [method, status, uri]. The meter you are attempting to register has keys [exception, method, status, uri].
解决方案:
a、配置文件中增加:management.metrics.web.server.auto-time-requests=false设置为false,默认为true
b、重写WebMvcTagsProvider,目的是去掉 WebMvcTags.exception(exception)
package com.sinosoft.config;

import io.micrometer.core.instrument.Tag;

import io.micrometer.core.instrument.Tags;

import org.springframework.boot.actuate.metrics.web.servlet.WebMvcTags;

import org.springframework.boot.actuate.metrics.web.servlet.WebMvcTagsProvider;

import javax.servlet.http.HttpServletRequest;

import javax.servlet.http.HttpServletResponse;

/**

 * @ClassName: MyTagsProvider

 * @Description: TODO

 * @author: Created by xxx <a href="xxx@163.com">Contact author</a>

 * @date: 2019/2/27 13:49

 * @Version: V1.0

 */

public class MyTagsProvider implements WebMvcTagsProvider {

    /**

     * 去掉WebMvcTags.exception(exception)

     *

     * @param request   请求

     * @param response  响应

     * @param handler   处理

     * @param exception 异常

     * @return

     */

    @Override

    public Iterable<Tag> getTags(HttpServletRequest request, HttpServletResponse response, Object handler, Throwable exception) {

        return Tags.of(WebMvcTags.method(request), WebMvcTags.uri(request, response), WebMvcTags.status(response));

    }

    @Override

    public Iterable<Tag> getLongRequestTags(HttpServletRequest request, Object handler) {

        return Tags.of(WebMvcTags.method(request), WebMvcTags.uri(request, null));

    }

}
然后将重写后的MyTagsProvider进行Bean注入
package com.sinosoft.config;

import org.springframework.context.annotation.Bean;

import org.springframework.context.annotation.Configuration;

/**

 * @ClassName: TagsProvideBean

 * @Description: TODO

 * @author: Created by xxx <a href="xxx@163.com">Contact author</a>

 * @date: 2019/2/27 13:54

 * @Version: V1.0

 */

@Configuration

public class TagsProvideBean {

    /**

     * 将MyTagsProvider注入

     *

     * @return

     */

    @Bean

    public MyTagsProvider myTagsProvider() {

        return new MyTagsProvider();

    }

}
4. 启动zipkin-server服务
package com.sinosoft;

import org.springframework.boot.SpringApplication;

import org.springframework.boot.autoconfigure.SpringBootApplication;

import org.springframework.cloud.client.discovery.EnableDiscoveryClient;

import zipkin2.server.internal.EnableZipkinServer;

/**

 * @ClassName: ZipkinApplication

 * @Description: 调用链服务启动入口

 * @author: Created by xxx <a href="xxx@163.com">Contact author</a>

 * @date: 2019/2/27 11:43

 * @Version: V1.0

 */

@SpringBootApplication

@EnableDiscoveryClient

@EnableZipkinServer

public class ZipkinApplication {

    public static void main(String[] args) {

        SpringApplication.run(ZipkinApplication.class, args);

    }

}
Zipkin客户端构建
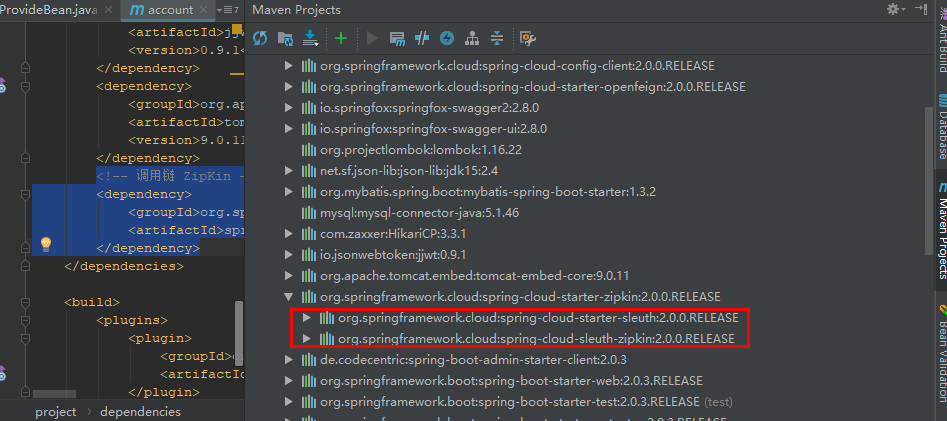
1. 引入依赖
<!-- 调用链 ZipKin -->

<dependency>

    <groupId>org.springframework.cloud</groupId>

    <artifactId>spring-cloud-starter-zipkin</artifactId>

</dependency>
注:spring-cloud-starter-zipkin 已经包含了 spring-cloud-starter-sleuth
2. 配置文件
---

# 调用链 Sleuth + ZipKin

spring:

  sleuth:

    web:

      client:

        enabled: true

    sampler:

      probability: 1.0 # 采用比例,默认 0.1 全部采样 1.0

  zipkin:

    base-url: http://localhost:9411/ # 指定了Zipkin服务器的地址
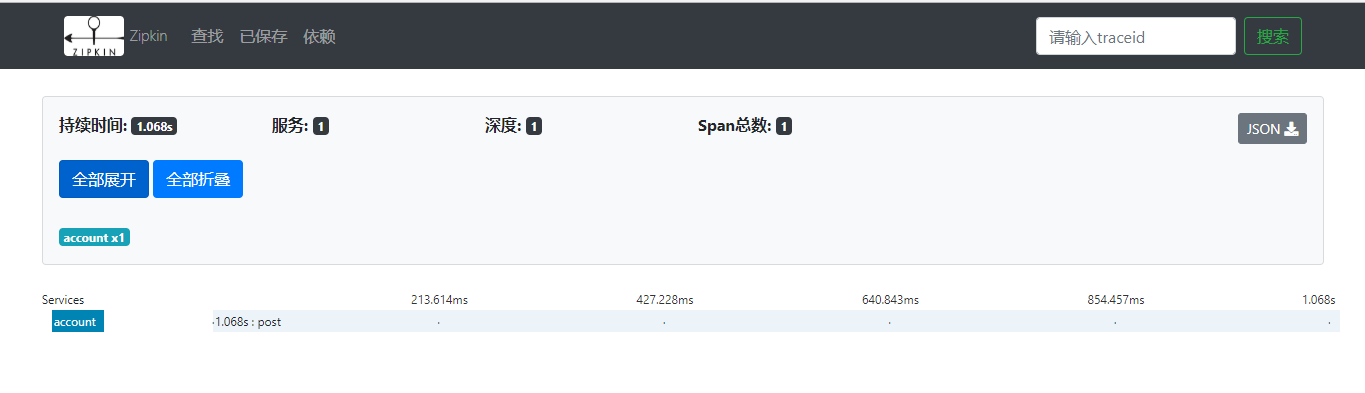
Zipkin效果展示
zipkin服务端及客户端启动之后,访问:http://localhost:9411/zipkin/

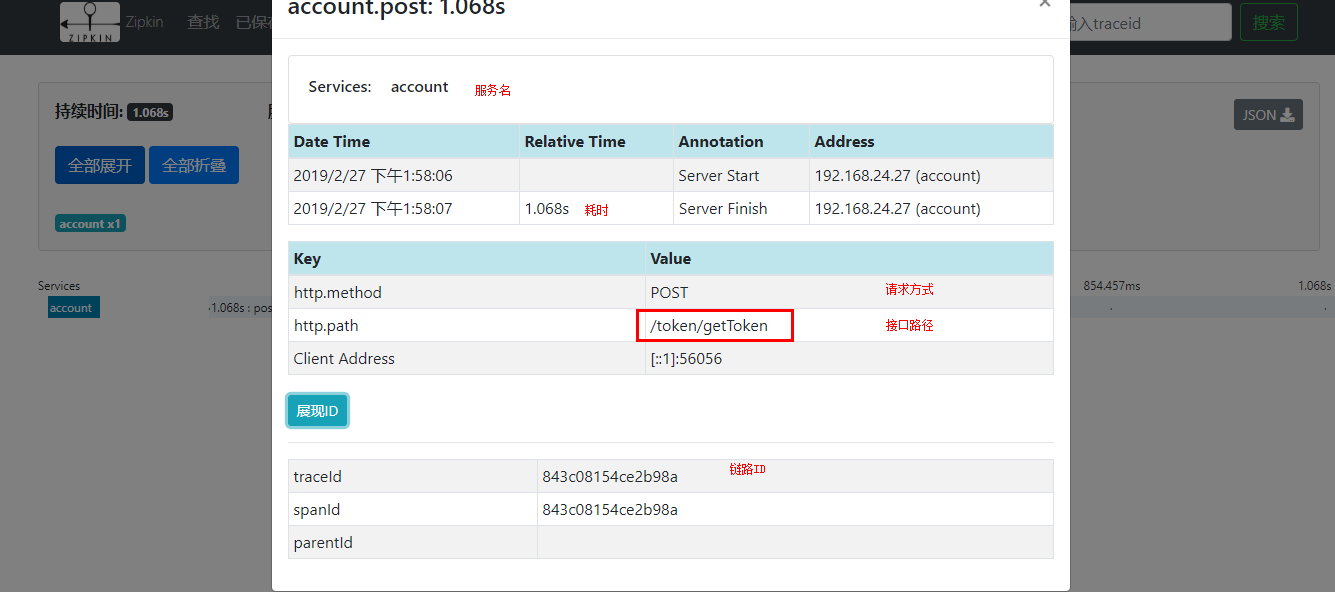
默认是查找所有的服务对应的链路,如果需要查询指定服务的链路跟踪情况,可以选择对应的服务名、Span名称等其他条件,点击查询即可显示本服务下的链路跟踪结果。
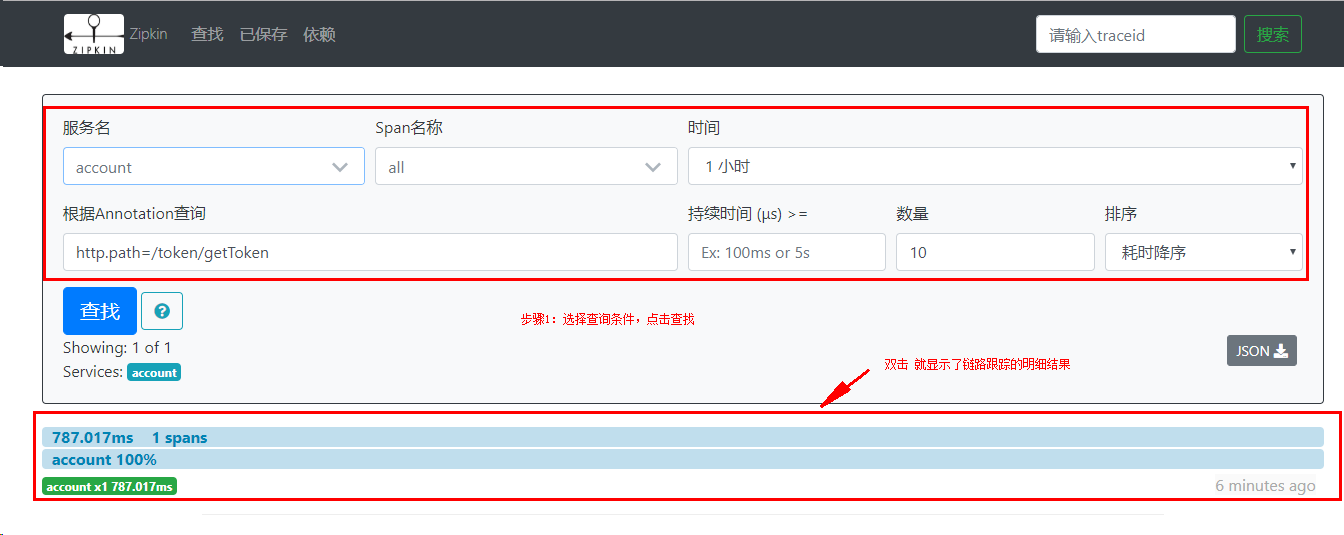
链路跟踪明细:

Springboot 2.0.x 引入链路跟踪Sleuth及Zipkin的更多相关文章
- Spring Cloud(十二):分布式链路跟踪 Sleuth 与 Zipkin【Finchley 版】
Spring Cloud(十二):分布式链路跟踪 Sleuth 与 Zipkin[Finchley 版] 发表于 2018-04-24 | 随着业务发展,系统拆分导致系统调用链路愈发复杂一个前端请 ...
- 分布式链路跟踪 Sleuth 与 Zipkin【Finchley 版】
原创: dqqzj SpringForAll社区 今天 Spring Cloud Sleuth Span是基本的工作单位. 例如,发送 RPC是一个新的跨度,就像向RPC发送响应一样. 跨度由跨度唯一 ...
- Spring Cloud 微服务分布式链路跟踪 Sleuth 与 Zipkin
Zipkin 是一个开放源代码分布式的跟踪系统,由 Twitter 公司开源,它致力于收集服务的定时数据,以解决微服务架构中的延迟问题,包括数据的收集.存储.查找和展现.它的理论模型来自于Google ...
- springcloud 分布式服务跟踪sleuth+zipkin
原文:https://www.jianshu.com/p/6ef0b76b9c26 分布式服务跟踪需求 随着分布式服务越来越多,调用关系越来越复杂,组合接口越来越多,要进行分布式服务跟踪监控的需求也越 ...
- 图灵学院-微服务11-分布式链路跟踪Sleuth详解
当客户端访问到第一个service 1的时候,会生成当前链路追踪的一个全局的trance ID,在一次调用过Service1--Service2--Service3--Service4时,整个服务访问 ...
- 【Dalston】【第七章】分布式链路跟踪(Sleuth)
当我们进行微服务架构开发时,通常会根据业务来划分微服务,各业务之间通过REST进行调用.一个用户操作,可能需要很多微服务的协同才能完成,如果在业务调用链路上任何一个微服务出现问题或者网络超时,都会导致 ...
- Spring Cloud 分布式链路跟踪 Sleuth + Zipkin + Elasticsearch【Finchley 版】
随着业务越来越复杂,系统也随之进行各种拆分,特别是随着微服务架构的兴起,看似一个简单的应用,后台可能很多服务在支撑:一个请求可能需要多个服务的调用:当请求迟缓或不可用时,无法得知是哪个微服务引起的,这 ...
- spring-cloud-sleuth 和 分布式链路跟踪系统
==================spring-cloud-sleuth==================spring-cloud-sleuth 可以用来增强 log 的跟踪识别能力, 经常在微服 ...
- SpringBoot 2.0.3 源码解析
前言 用SpringBoot也有很长一段时间了,一直是底层使用者,没有研究过其到底是怎么运行的,借此机会今天试着将源码读一下,在此记录...我这里使用的SpringBoot 版本是 2.0.3.RE ...
随机推荐
- 2、SpringBoot接口Http协议开发实战8节课(1-6)
1.SpringBoot2.xHTTP请求配置讲解 简介:SpringBoot2.xHTTP请求注解讲解和简化注解配置技巧 1.@RestController and @RequestMapping是 ...
- iptables学习笔记_____摘自朱双印个人日志 ____http://www.zsythink.net/
iptables为我们预先定义了四张表 raw.mangle.nat.filter filter表负责过滤:允许那些ip访问.拒绝那些ip访问.允许那些端口...是最常用的表 #查看表里面所有的规则i ...
- Oracle实体化视图
1.减轻网络负担:通过MV将数据从一个数据库分发到多个不同的数据库上,通过对多个数据库访问来减轻对单个数据库的网络负担. 2.搭建分发环境:通过从一个中央数据库将数据分发到多个节点数据库,达到分发数 ...
- hostapd 和 wap_supplicant
hostapd : user space daemon for access points, including, e.g., IEEE 802.1X/WPA/EAP Authenticator fo ...
- 利用mycat实现基于mysql5.5主从复制的读写分离
整体步骤: 1.准备好两台服务器,一台作为主数据库服务器,一台作为从服务器,并安装好mysql数据库,此处略 2.配置好主从同步 3.下载JDK配置mycat依赖的JAVA环境,mycat采用java ...
- Centos6安装FreeSWITCH 1.5时./configure问题解决记录
系统:Centos 6.4 64位: FreeSWITCH版本:1.5 具体的安装过程参考FreeSWITCH 官网wiki (也可以参考我的博客<Centos6安装FreeSWITCH> ...
- GBDT、XGBOOST、LightGBM调参数
总的认识: LightGBM > XGBOOST > GBDT 都是调参数比较麻烦. GBDT分类的最佳调参数的讲解: Gradient Boosting Machine(GBM)调参 ...
- css之margin
参考地址:http://www.imooc.com/learn/680 标准盒模型 元素尺寸 可视尺寸-clientWidth(标准)——就是上图中的border box包含的尺寸. 占据尺寸-out ...
- 错误/异常:java.io.FileNotFoundException: .\src\db.properties (系统找不到指定的路径。);的解决方法
1.异常视图 2.解决方法 与之相关的部分代码: static{ try { //读取db.properties Properties props = new Properties(); FileIn ...
- process.cwd()与__dirname的区别
process.cwd() 是当前执行node命令时候的文件夹地址 ——工作目录,保证了文件在不同的目录下执行时,路径始终不变__dirname 是被执行的js 文件的地址 ——文件所在目录 Node ...