Prometheus Operator 对接 Thanos
文章转载自:https://jishuin.proginn.com/p/763bfbd56ae4
使用 Prometheus Operator 来进行监控,在 Prometheus 高可用的章节中也手动部署了 Thanos,Prometheus Operator 中提供了 ThanosRuler 这样的 CRD 组件,但是如果使用 Prometheus Operator 部署整个监控服务的话,其他 Thanos 组件(比如 Querier、Store 等)需要单独配置,Thanos 和 Prometheus 进行对接是通过 Sidecar 组件完成的,而在 Prometheus 的 CRD 中就提供了对 Sidecar 组件的配置属性,该 Sidecar 可以连接到 Thanos Querier,还可以选择备份对象存储中的数据。
Thanos 的整个架构图如下所示:

Thanos Sidecar
要使用 Prometheus Operator 来对接 Thanos,可以直接查看 Prometheus 这个 CRD 的相关属性:
$ kubectl explain prometheus.spec.thanos

......
现阶段 Prometheus CRD 里面对接 Thanos 的方式是一个实验特性,所以如果你是在生产环境要使用的话需要注意,可能后续版本就变动了,这里我们可以直接通过 thanos 属性来指定使用的镜像版本,以及对应的对象存储配置,这里我们仍然使用 minio 来做对象存储(部署参考前面章节),首先登录 MinIO 创建一个 thanos 的 bucket。然后创建一个对象存储配置文件:
# thanos-storage-minio.yaml

type: s3

config:

  bucket: thanos # bucket 名称

  endpoint: minio.default.svc.cluster.local:9000 # minio 访问地址

  access_key: minio

  secret_key: minio123

  insecure: true

  signature_version2: false
使用上面的配置文件来创建一个 Secret 对象:
$ kubectl create secret generic thanos-objectstorage --from-file=thanos.yaml=thanos-storage-minio.yaml -n monitoring

secret/thanos-objectstorage created
对象存储的配置准备好过后,接下来我们就可以在 Prometheus CRD 中添加对应的 Thanos 配置了,完整的资源对象如下所示:
apiVersion: monitoring.coreos.com/v1

kind: Prometheus # crd 类型,表示资源对象,类似于Pod、Deployment,就是用来管理部署Prometheus应用的

metadata:

  labels:

    prometheus: k8s

  name: k8s

  namespace: monitoring

spec:

  alerting:

    alertmanagers:

      - name: alertmanager-main

        namespace: monitoring

        port: web

  image: prom/prometheus:v2.26.0

  nodeSelector:

    kubernetes.io/os: linux

  podMonitorNamespaceSelector: {}

  podMonitorSelector: {}

  probeNamespaceSelector: {}

  probeSelector: {}

  replicas: 2

  resources:

    requests:

      memory: 400Mi

  ruleSelector: # 用来匹配rule规则的selector

    matchLabels: # 匹配的是具有下面两个标签的PrometheusRule这个资源对象

      prometheus: k8s

      role: alert-rules

  securityContext:

    fsGroup: 2000

    runAsNonRoot: true

    runAsUser: 1000

  serviceAccountName: prometheus-k8s

  serviceMonitorNamespaceSelector: {}

  serviceMonitorSelector: {}

  version: v2.26.0

  additionalScrapeConfigs:

    key: prometheus-additional.yaml

    name: additional-configs

  thanos: # 添加 thanos 配置

    image: thanosio/thanos:v0.18.0

    resources:

      limits:

        cpu: 500m

        memory: 500Mi

      requests:

        cpu: 100m

        memory: 500Mi

    objectStorageConfig:

      key: thanos.yaml

      name: thanos-objectstorage

  # storage:

  #   volumeClaimTemplate:

  #     spec:

  #       storageClassName: rook-ceph-block  # 指定storageclass(别用nfs做存储)

  #       resources:

  #         requests:

  #           storage: 20Gi
然后直接更新即可:
$ kubectl apply -f prometheus-prometheus.yaml

prometheus.monitoring.coreos.com/k8s configured
更新完成后我们再次查看更新后的 Prometheus Pod,可以发现已经变成了 3 个容器了:
$ kubectl get pods -n monitoring -l app=prometheus

NAME               READY   STATUS    RESTARTS   AGE

prometheus-k8s-0   3/3     Running   1          117s

prometheus-k8s-1   3/3     Running   1          2m41s
把生成的资源对象导出来查看验证下:
$ kubectl get sts -n monitoring prometheus-k8s -o yaml

- args:  # sidecar 容器

  - sidecar

  - --prometheus.url=http://localhost:9090/

  - --grpc-address=[$(POD_IP)]:10901

  - --http-address=[$(POD_IP)]:10902

  - --objstore.config=$(OBJSTORE_CONFIG)

  - --tsdb.path=/prometheus

  env:

  - name: POD_IP

    valueFrom:

      fieldRef:

        apiVersion: v1

        fieldPath: status.podIP

  - name: OBJSTORE_CONFIG

    valueFrom:

      secretKeyRef:

        key: thanos.yaml

        name: thanos-objectstorage

  image: thanosio/thanos:v0.18.0

  imagePullPolicy: IfNotPresent

  name: thanos-sidecar

  ports:

  - containerPort: 10902

    name: http

    protocol: TCP

  - containerPort: 10901

    name: grpc

    protocol: TCP

......
可以看到在原来的基础上新增了一个 sidecar 容器,正常每 2 个小时会上传一次数据,查看 sidecar 可以查看到相关日志:
$ kubectl logs -f prometheus-k8s-0 -c thanos-sidecar -n monitoring

......

level=info ts=2021-04-14T01:48:22.292651206Z caller=sidecar.go:155 msg="successfully loaded prometheus external labels" external_labels="{prometheus=\"monitoring/k8s\", prometheus_replica=\"prometheus-k8s-0\"}"

level=info ts=2021-04-14T01:48:22.292687688Z caller=intrumentation.go:48 msg="changing probe status" status=ready

level=info ts=2021-04-14T04:48:54.276596974Z caller=shipper.go:334 msg="upload new block" id=01F37BB4A8EWDBN1AS25Z8MG5J

level=info ts=2021-04-14T05:00:24.275616176Z caller=shipper.go:334 msg="upload new block" id=01F37C07T9BS3744WKS8KEDZCS
Thanos Querier
Thanos Querier 组件提供了从所有 prometheus 实例中一次性检索指标的能力。它与原 prometheus 的 PromQL 和 HTTP API 是完全兼容的,所以同样可以和 Grafana 一起使用。
因为 Querier 组件是要和 Sidecar 以及 Store 组件进行对接的,所以在 Querier 组件的方向参数中需要配置上上面我们启动的 Thanos Sidecar,同样我们可以通过对应的 Headless Service 来进行发现,自动创建的 Service 名为 prometheus-operated(可以通过 Statefulset 查看):
$ kubectl describe svc -n monitoring prometheus-operated

Name:              prometheus-operated

Namespace:         monitoring

Labels:            operated-prometheus=true

Annotations:       <none>

Selector:          app=prometheus

Type:              ClusterIP

IP:                None

Port:              web  9090/TCP

TargetPort:        web/TCP

Endpoints:         10.244.1.92:9090,10.244.2.89:9090

Port:              grpc  10901/TCP

TargetPort:        grpc/TCP

Endpoints:         10.244.1.92:10901,10.244.2.89:10901

Session Affinity:  None

Events:            <none>
Thanos Querier 组件完整的资源清单如下所示,需要注意的是 Prometheus Operator 部署的 prometheus 实例多副本的 external_labels 标签为 prometheus_replica:
# thanos-querier.yaml

apiVersion: apps/v1

kind: Deployment

metadata:

  name: thanos-querier

  namespace: monitoring

  labels:

    app: thanos-querier

spec:

  selector:

    matchLabels:

      app: thanos-querier

  template:

    metadata:

      labels:

        app: thanos-querier

    spec:

      containers:

        - name: thanos

          image: thanosio/thanos:v0.18.0

          args:

            - query

            - --log.level=debug

            - --query.replica-label=prometheus_replica # prometheus-operator 里面配置的副本标签为 prometheus_replica

            # Discover local store APIs using DNS SRV.

            - --store=dnssrv+prometheus-operated:10901

          ports:

            - name: http

              containerPort: 10902

            - name: grpc

              containerPort: 10901

          resources:

            requests:

              memory: "2Gi"

              cpu: "1"

            limits:

              memory: "2Gi"

              cpu: "1"

          livenessProbe:

            httpGet:

              path: /-/healthy

              port: http

            initialDelaySeconds: 10

          readinessProbe:

            httpGet:

              path: /-/healthy

              port: http

            initialDelaySeconds: 15

---

apiVersion: v1

kind: Service

metadata:

  name: thanos-querier

  namespace: monitoring

  labels:

    app: thanos-querier

spec:

  ports:

    - port: 9090

      targetPort: http

      name: http

  selector:

    app: thanos-querier

---

apiVersion: traefik.containo.us/v1alpha1

kind: IngressRoute

metadata:

  name: thanos-querier

  namespace: monitoring

  labels:

    app: thanos-querier

spec:

  entryPoints:

    - web

  routes:

    - kind: Rule

      match: Host(`thanos.k8s.local`)

      services:

        - kind: Service

          name: thanos-querier

          port: 9090
直接创建上面的资源对象即可:
$ kubectl apply -f thanos-querier.yaml

$ kubectl get pods -n monitoring -l app=thanos-querier

NAME                              READY   STATUS    RESTARTS   AGE

thanos-querier-69bb75c8cc-5g6t6   1/1     Running   0          105s
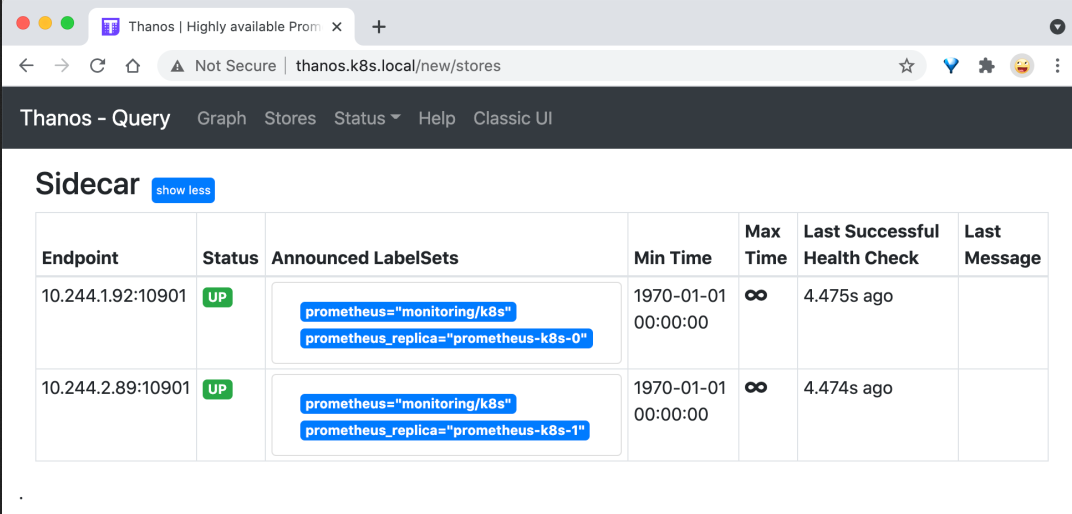
部署完成后我们可以在浏览器中打开 Querier 的页面,查看已经关联上的 Stores:
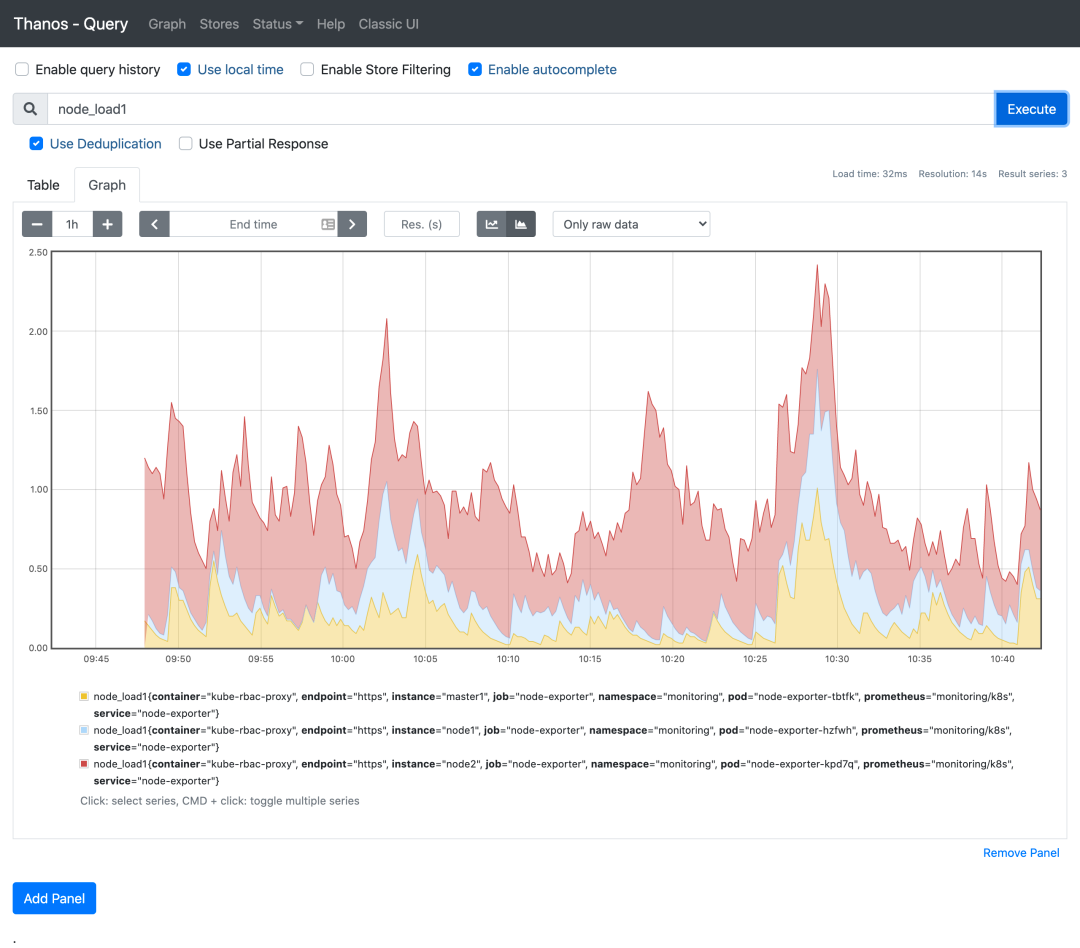
比如在 Graph 页面查询 node_load1 指标,记住勾选上 Use Deduplication 用于去重查询:
Thanos Store
接着需要部署 Thanos Store 组件,该组件和可以 Querier 组件一起协作从指定对象存储的 bucket 中检索历史指标数据,所以自然在部署的时候我们需要指定对象存储的配置,Store 组件配置完成后还需要加入到 Querier 组件里面去:
# thanos-store.yaml

apiVersion: apps/v1

kind: StatefulSet

metadata:

  name: thanos-store

  namespace: monitoring

  labels:

    app: thanos-store

spec:

  selector:

    matchLabels:

      app: thanos-store

  serviceName: thanos-store

  template:

    metadata:

      labels:

        app: thanos-store

    spec:

      containers:

        - name: thanos

          image: thanosio/thanos:v0.18.0

          args:

            - "store"

            - "--log.level=debug"

            - "--data-dir=/data"

            - "--objstore.config-file=/etc/secret/thanos.yaml"

            - "--index-cache-size=500MB"

            - "--chunk-pool-size=500MB"

          ports:

            - name: http

              containerPort: 10902

            - name: grpc

              containerPort: 10901

          livenessProbe:

            httpGet:

              port: 10902

              path: /-/healthy

            initialDelaySeconds: 10

          readinessProbe:

            httpGet:

              port: 10902

              path: /-/ready

            initialDelaySeconds: 15

          volumeMounts:

            - name: object-storage-config

              mountPath: /etc/secret

              readOnly: false

      volumes:

        - name: object-storage-config

          secret:

            secretName: thanos-objectstorage

---

apiVersion: v1

kind: Service

metadata:

  name: thanos-store

  namespace: monitoring

spec:

  type: ClusterIP

  clusterIP: None

  ports:

    - name: grpc

      port: 10901

      targetPort: grpc

  selector:

    app: thanos-store
直接部署上面的资源对象即可:
$ kubectl apply -f thanos-store.yaml

statefulset.apps/thanos-store created

service/thanos-store created

$ kubectl get pods -n monitoring -l app=thanos-store

NAME             READY   STATUS    RESTARTS   AGE

thanos-store-0   1/1     Running   0          106s
部署完成后为了让 Querier 组件能够发现 Store 组件,我们还需要在 Querier 组件中增加 Store 组件的发现:
containers:

  - name: thanos

    image: thanosio/thanos:v0.18.0

    args:

      - query

      - --log.level=debug

      - --query.replica-label=prometheus_replica

      # Discover local store APIs using DNS SRV.

      - --store=dnssrv+prometheus-operated:10901

      - --store=dnssrv+thanos-store:10901
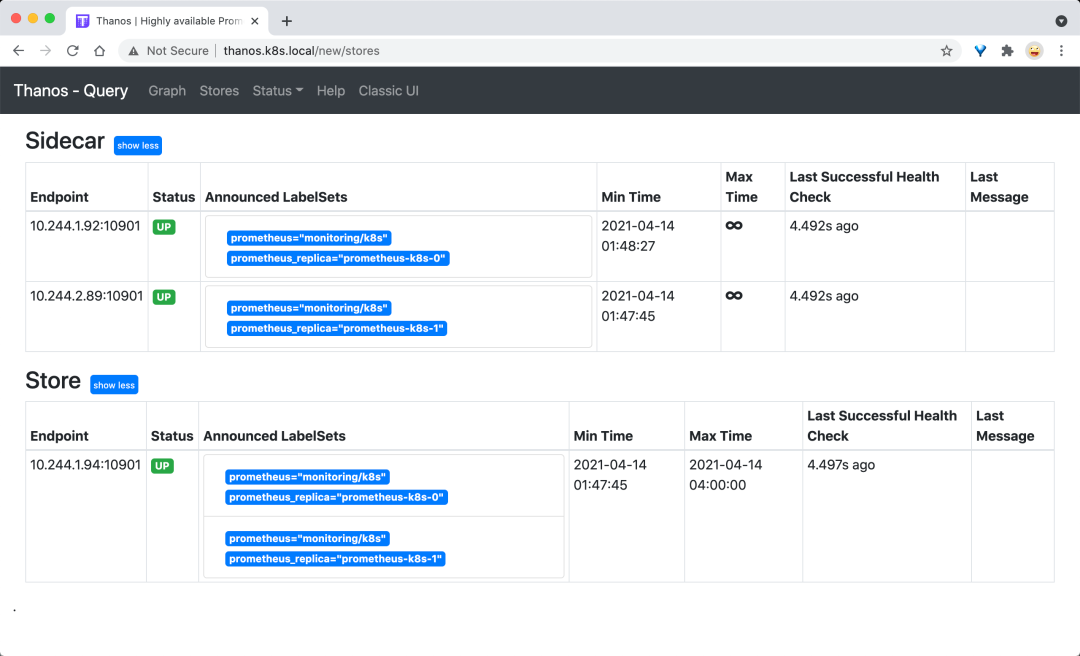
更新后再次前往 Querier 组件的页面查看发现的 Store 组件正常会多一个 Thanos Store 的组件。
Thanos Compactor
Thanos Compactor 组件可以对我们收集的历史数据进行下采样,可以减少文件的大小。部署方式和之前没什么太大的区别,主要也就是对接对象存储。
# thanos-compactor

apiVersion: apps/v1

kind: StatefulSet

metadata:

  name: thanos-compactor

  namespace: monitoring

  labels:

    app: thanos-compactor

spec:

  selector:

    matchLabels:

      app: thanos-compactor

  serviceName: thanos-compactor

  template:

    metadata:

      labels:

        app: thanos-compactor

    spec:

      containers:

        - name: thanos

          image: thanosio/thanos:v0.18.0

          args:

            - "compact"

            - "--log.level=debug"

            - "--data-dir=/data"

            - "--objstore.config-file=/etc/secret/thanos.yaml"

            - "--wait"

          ports:

            - name: http

              containerPort: 10902

          livenessProbe:

            httpGet:

              port: 10902

              path: /-/healthy

            initialDelaySeconds: 10

          readinessProbe:

            httpGet:

              port: 10902

              path: /-/ready

            initialDelaySeconds: 15

          volumeMounts:

            - name: object-storage-config

              mountPath: /etc/secret

              readOnly: false

      volumes:

        - name: object-storage-config

          secret:

            secretName: thanos-objectstorage
同样直接创建上面的资源对象即可:
kubectl apply -f thanos-compactor.yaml
最后如果想通过 Thanos 的 Ruler 组件来配置报警规则,可以直接使用 Prometheus Operator 提供的 ThanosRuler 这个 CRD 对象,不过还是推荐直接和单独的 prometheus 实例配置报警规则,这样调用链路更短,出现问题的时候排查也更方便。Thanos Ruler 组件允许配置记录和告警规则,跨越多个 prometheus 实例进行处理,一个 ThanosRuler 实例至少需要一个 queryEndpoint 指向 Thanos Queriers 或 prometheus 实例的位置,如下所示:
# ThanosRuler Demo

apiVersion: monitoring.coreos.com/v1

kind: ThanosRuler

metadata:

  name: thanos-ruler-demo

  labels:

    example: thanos-ruler

  namespace: monitoring

spec:

  image: thanosio/thanos

  ruleSelector:

    matchLabels: # 匹配 Rule 规则

      role: my-thanos-rules

  queryEndpoints: # querier 地址

    - dnssrv+_http._tcp.my-thanos-querier.monitoring.svc.cluster.local
ThanosRuler 组件使用的记录和警报规则与 Prometheus 里面配置的 PrometheusRule 对象,比如上面的示例中,表示包含 role=my-thanos-rules 标签的 PrometheusRule 对象规则会被添加到 Thanos Ruler Pod 中去。
最后通过 Prometheus Operator 对接上 Thanos 过后的所有资源对象如下所示:
$ kubectl get pods -n monitoring

NAME                                   READY   STATUS    RESTARTS   AGE

alertmanager-main-0                    2/2     Running   0          5h14m

alertmanager-main-1                    2/2     Running   0          5h14m

alertmanager-main-2                    2/2     Running   0          5h13m

dingtalk-hook-7c7c5559fd-kwfqk         1/1     Running   0          5h14m

grafana-f8cd57fcf-2q5h6                1/1     Running   0          5h14m

kube-state-metrics-587bfd4f97-pks8n    3/3     Running   0          5h14m

node-exporter-hzfwh                    2/2     Running   18         11d

node-exporter-kpd7q                    2/2     Running   12         5d22h

node-exporter-tbtfk                    2/2     Running   36         11d

prometheus-adapter-69b8496df6-cnhzn    1/1     Running   0          5h14m

prometheus-k8s-0                       3/3     Running   1          3h59m

prometheus-k8s-1                       3/3     Running   1          4h

prometheus-operator-7649c7454f-ls8wc   2/2     Running   0          5h14m

thanos-compactor-0                     1/1     Running   0          113m

thanos-querier-799845897-x4ljh         1/1     Running   0          128m

thanos-store-0                         1/1     Running   0          130m
正常 minio 对象存储上面也会有上传的历史数据了:

Prometheus Operator 对接 Thanos的更多相关文章
- Kubernetes 监控:Prometheus Operator + Thanos ---实践篇
具体参考网址:https://www.cnblogs.com/sanduzxcvbnm/p/16291296.html 本章用到的yaml文件地址:https://files.cnblogs.com/ ...
- Kubernetes 监控:Prometheus Operator
安装 前面的章节中我们学习了用自定义的方式来对 Kubernetes 集群进行监控,基本上也能够完成监控报警的需求了.但实际上对上 Kubernetes 来说,还有更简单方式来监控报警,那就是 Pro ...
- 部署 Prometheus Operator - 每天5分钟玩转 Docker 容器技术(179)
本节在实践时使用的是 Prometheus Operator 版本 v0.14.0.由于项目开发迭代速度很快,部署方法可能会更新,必要时请参考官方文档. 下载最新源码 git clone https: ...
- Prometheus Operator 架构 - 每天5分钟玩转 Docker 容器技术(178)
本节讨论 Prometheus Operator 的架构.因为 Prometheus Operator 是基于 Prometheus 的,我们需要先了解一下 Prometheus. Prometheu ...
- Prometheus Operator - 每天5分钟玩转 Docker 容器技术(177)
前面我们介绍了 Kubernetes 的两种监控方案 Weave Scope 和 Heapster,它们主要的监控对象是 Node 和 Pod.这些数据对 Kubernetes 运维人员是必须的,但还 ...
- helm 安装prometheus operator 并监控ingress
1.helm安装 curl https://raw.githubusercontent.com/helm/helm/master/scripts/get > get_helm.shchmod 7 ...
- Prometheus Operator 监控Kubernetes
Prometheus Operator 监控Kubernetes 1. Prometheus的基本架构 Prometheus是一个开源的完整监控解决方案,涵盖数据采集.查询.告警.展示整个监控流程 ...
- k8s Helm安装Prometheus Operator
Ubuntu 18 Kubernetes集群的安装和部署 以及Helm的安装完成了k8s的集群和helm的安装,今天我们来看看Prometheus的监控怎么搞.Prometheus Operator ...
- Kubernetes 监控方案之 Prometheus Operator(十九)
目录 一.Prometheus 介绍 1.1.Prometheus 架构 1.2.Prometheus Operator 架构 二.Helm 安装部署 2.1.Helm 客户端安装 2.2.Tille ...
随机推荐
- buu第二页
33.被劫持的神秘礼物 打开后直接搜索HTTP,发现了以POST方式提交的数据,追踪HTTP流,根据题目提示,把name和word拼在一起 再根据题目提示,用MD5解密 这样就得到了flag 34.刷 ...
- 2022-7-13 java_1 第七组 刘昀航
@ 目录 前言 一.一些基本的指令 二.java 1.java的三个版本 2.java特点 3.运行一个java程序 三.java的数据类型 1.java基本数据类型 2.强制转换的原理 3.八种基本 ...
- ELK 日志分析系统的部署
一.ELK简介 ElasticSearch介绍Elasticsearch是一个基于Lucene的搜索服务器. 它提供了一个分布式多用户能力的全文搜索引擎,基于RESTful web接口. Elasti ...
- 思维导图学《On Java》基础卷
说明 原来读过 <Java 编程思想(第 4 版)>,但是这个版本还是基于 Java 5 讲解.由于 Java 8 做出了非常大的改进(是 Java 变化最大的版本),且截止到 2022- ...
- C#程序设计的6大原则
设计模式:面向对象语言开发过程中,遇到各种场景和问题,解决方案和思路沉淀下来,就是设计模式.俗称,套路 设计模式的六大原则:理解为面向对象语言开发过程中推荐的一些指导性的原则,通俗的说是套路的 套路 ...
- WPF 截图控件之绘制方框与椭圆(四) 「仿微信」
前言 接着上周写的截图控件继续更新 绘制方框与椭圆. 1.WPF实现截屏「仿微信」 2.WPF 实现截屏控件之移动(二)「仿微信」 3.WPF 截图控件之伸缩(三) 「仿微信」 正文 有开发者在B站反 ...
- ASP.NET Core 6框架揭秘实例演示[31]:路由“高阶”用法
ASP.NET的路由是通过EndpointRoutingMiddleware和EndpointMiddleware这两个中间件协作完成的,它们在ASP.NET平台上具有举足轻重的地位,MVC和gRPC ...
- 【AGC】增长服务1-远程配置示例
[AGC]增长服务1-远程配置示例 前言:上一次笔者给大家带来了AGC领域的性能管理服务的学习.这次我们再继续深化学习AGC的相关知识.在文章开始之前,再给读者简单介绍一下AGC,以免第一次来的读 ...
- 二位数组——扩展:冒泡排序、Arrays类
1.冒泡排序 速记口诀(升序) n个数字来排队:两两相比小靠前:外层循环n-1:内层循环n-i-1. 示例:定义一个数组,用冒泡排序将数组进行升序排序 关键代码: 输出结果: 2.Arrays 类 ...
- 封装Fraction-分数类(C++)
Fraction 分数类 默认假分数,可自行修改 由于concept的原因 template <typename T> concept is_float_v = std::is_float ...