【ECharts】01 快速上手
简单介绍:
ECharts 是一个使用 JavaScript 实现的开源可视化库,涵盖各行业图表,满足各种需求。
ECharts 遵循 Apache-2.0 开源协议,免费商用。
ECharts 兼容当前绝大部分浏览器(IE8/9/10/11,Chrome,Firefox,Safari等)及兼容多种设备,可随时随地任性展示。
快速入门:
<!DOCTYPE html>
<html lang="en">
<head>
<meta charset="UTF-8">
<title>First ECharts Instance</title>
</head>
<body> <!-- ECharts CDN 资源 -->
<script src="https://cdn.staticfile.org/echarts/4.3.0/echarts.min.js"></script>
<!-- 为ECharts准备一个具备大小(宽高)的Dom -->
<div id="main" style="width: 600px;height:400px;"></div>
<script type="text/javascript">
// 基于准备好的dom,初始化echarts实例
let eCharts = echarts.init(document.getElementById('main')); // 指定图表的配置项和数据
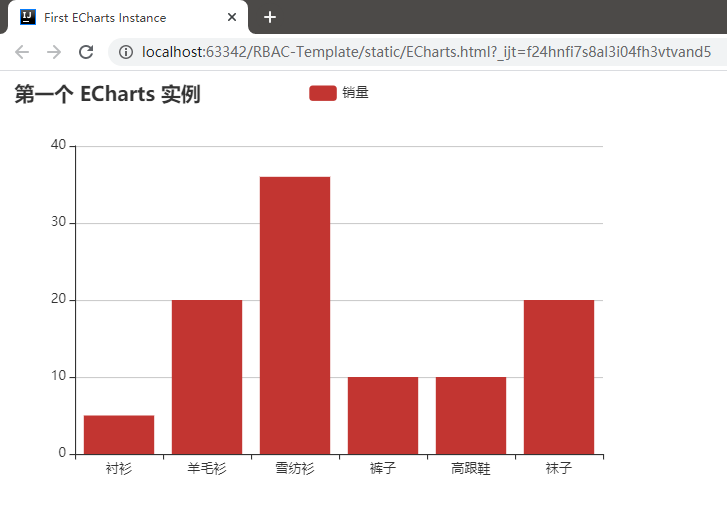
let option = {
title: {
text: '第一个 ECharts 实例'
},
tooltip: {},
legend: {
data:['销量']
},
xAxis: {
data: ["衬衫","羊毛衫","雪纺衫","裤子","高跟鞋","袜子"]
},
yAxis: {},
series: [{
name: '销量',
type: 'bar',
data: [5, 20, 36, 10, 10, 20]
}]
}; // 使用刚指定的配置项和数据显示图表。
eCharts.setOption(option);
</script>
</body>
</html>
渲染效果:
简单分析:
ECharts的渲染需要一个容器标签,一般DIV来作为容器标签进行渲染,
同时容器需要具备宽高属性
<div id="main" style="width: 600px;height:400px;"></div>
在JS初始化的过程中,需要该元素
let eCharts = echarts.init(document.getElementById('main'));
设置图标的标题:
title: {

    text: '第一个 ECharts 实例'

}
提示信息:
tooltip: {},
图例组件展现了不同系列的标记(symbol),颜色和名字。
可以通过点击图例控制哪些系列不显示。演示只有data一项属性:
legend: {

  data:['销量']

},
其他演示:
legend: {

    data: [{

        name: '系列1',

        // 强制设置图形为圆。

        icon: 'circle',

        // 设置文本为红色

        textStyle: {

            color: 'red'

        }

    }]

}
分为X&Y轴装填数据信息:
        xAxis: {

            data: ["衬衫","羊毛衫","雪纺衫","裤子","高跟鞋","袜子"]

        },

        yAxis: {},
具体数值在一个数组的对象中:
因为这里没有对总阀值的设置,可以猜测到柱状图的高度数值是自动调整的,随着最高值来决定
每个系列通过 type 决定自己的图表类型:
series: [{

    name: '销量',  // 系列名称

    type: 'bar',  // 系列图表类型

    data: [5, 20, 36, 10, 10, 20]  // 系列中的数据内容

}]
图标类型种类:
type: 'bar':柱状/条形图

type: 'line':折线/面积图

type: 'pie':饼图

type: 'scatter':散点(气泡)图

type: 'effectScatter':带有涟漪特效动画的散点(气泡)

type: 'radar':雷达图

type: 'tree':树型图

type: 'treemap':树型图

type: 'sunburst':旭日图

type: 'boxplot':箱形图

type: 'candlestick':K线图

type: 'heatmap':热力图

type: 'map':地图

type: 'parallel':平行坐标系的系列

type: 'lines':线图

type: 'graph':关系图

type: 'sankey':桑基图

type: 'funnel':漏斗图

type: 'gauge':仪表盘

type: 'pictorialBar':象形柱图

type: 'themeRiver':主题河流

type: 'custom':自定义系列
这些设置好的信息封装成对象,给EChart对象的方法调用,开始渲染
 // 使用刚指定的配置项和数据显示图表。

    eCharts.setOption(option);
下载 & 安装:
CDN资源:
Staticfile CDN(国内) :

https://cdn.staticfile.org/echarts/4.3.0/echarts.min.js

百度:

https://echarts.baidu.com/dist/echarts.min.js, 保持了最新版本。

cdnjs :

https://cdnjs.cloudflare.com/ajax/libs/echarts/4.3.0/echarts.min.js
独立文件:
把内容复制到空的js文件即可
https://cdn.staticfile.org/echarts/4.7.0/echarts.js

https://cdn.staticfile.org/echarts/4.7.0/echarts.min.js
NPM:
cnpm install echarts --save-dev
配置详细:
theme = {
// 全图默认背景
// backgroundColor: 'rgba(0,0,0,0)',
// 默认色板
color: ['#ff7f50','#87cefa','#da70d6','#32cd32','#6495ed',
'#ff69b4','#ba55d3','#cd5c5c','#ffa500','#40e0d0',
'#1e90ff','#ff6347','#7b68ee','#00fa9a','#ffd700',
'#6699FF','#ff6666','#3cb371','#b8860b','#30e0e0'],
// 图表标题
title: {
x: 'left', // 水平安放位置,默认为左对齐,可选为:
// 'center' ¦ 'left' ¦ 'right'
// ¦ {number}(x坐标,单位px)
y: 'top', // 垂直安放位置,默认为全图顶端,可选为:
// 'top' ¦ 'bottom' ¦ 'center'
// ¦ {number}(y坐标,单位px)
//textAlign: null // 水平对齐方式,默认根据x设置自动调整
backgroundColor: 'rgba(0,0,0,0)',
borderColor: '#ccc', // 标题边框颜色
borderWidth: 0, // 标题边框线宽,单位px,默认为0(无边框)
padding: 5, // 标题内边距,单位px,默认各方向内边距为5,
// 接受数组分别设定上右下左边距,同css
itemGap: 10, // 主副标题纵向间隔,单位px,默认为10,
textStyle: {
fontSize: 18,
fontWeight: 'bolder',
color: '#333' // 主标题文字颜色
},
subtextStyle: {
color: '#aaa' // 副标题文字颜色
}
},
// 图例
legend: {
orient: 'horizontal', // 布局方式,默认为水平布局,可选为:
// 'horizontal' ¦ 'vertical'
x: 'center', // 水平安放位置,默认为全图居中,可选为:
// 'center' ¦ 'left' ¦ 'right'
// ¦ {number}(x坐标,单位px)
y: 'top', // 垂直安放位置,默认为全图顶端,可选为:
// 'top' ¦ 'bottom' ¦ 'center'
// ¦ {number}(y坐标,单位px)
backgroundColor: 'rgba(0,0,0,0)',
borderColor: '#ccc', // 图例边框颜色
borderWidth: 0, // 图例边框线宽,单位px,默认为0(无边框)
padding: 5, // 图例内边距,单位px,默认各方向内边距为5,
// 接受数组分别设定上右下左边距,同css
itemGap: 10, // 各个item之间的间隔,单位px,默认为10,
// 横向布局时为水平间隔,纵向布局时为纵向间隔
itemWidth: 20, // 图例图形宽度
itemHeight: 14, // 图例图形高度
textStyle: {
color: '#333' // 图例文字颜色
}
},
// 值域
dataRange: {
orient: 'vertical', // 布局方式,默认为垂直布局,可选为:
// 'horizontal' ¦ 'vertical'
x: 'left', // 水平安放位置,默认为全图左对齐,可选为:
// 'center' ¦ 'left' ¦ 'right'
// ¦ {number}(x坐标,单位px)
y: 'bottom', // 垂直安放位置,默认为全图底部,可选为:
// 'top' ¦ 'bottom' ¦ 'center'
// ¦ {number}(y坐标,单位px)
backgroundColor: 'rgba(0,0,0,0)',
borderColor: '#ccc', // 值域边框颜色
borderWidth: 0, // 值域边框线宽,单位px,默认为0(无边框)
padding: 5, // 值域内边距,单位px,默认各方向内边距为5,
// 接受数组分别设定上右下左边距,同css
itemGap: 10, // 各个item之间的间隔,单位px,默认为10,
// 横向布局时为水平间隔,纵向布局时为纵向间隔
itemWidth: 20, // 值域图形宽度,线性渐变水平布局宽度为该值 * 10
itemHeight: 14, // 值域图形高度,线性渐变垂直布局高度为该值 * 10
splitNumber: 5, // 分割段数,默认为5,为0时为线性渐变
color:['#1e90ff','#f0ffff'],//颜色
//text:['高','低'], // 文本,默认为数值文本
textStyle: {
color: '#333' // 值域文字颜色
}
},
toolbox: {
orient: 'horizontal', // 布局方式,默认为水平布局,可选为:
// 'horizontal' ¦ 'vertical'
x: 'right', // 水平安放位置,默认为全图右对齐,可选为:
// 'center' ¦ 'left' ¦ 'right'
// ¦ {number}(x坐标,单位px)
y: 'top', // 垂直安放位置,默认为全图顶端,可选为:
// 'top' ¦ 'bottom' ¦ 'center'
// ¦ {number}(y坐标,单位px)
color : ['#1e90ff','#22bb22','#4b0082','#d2691e'],
backgroundColor: 'rgba(0,0,0,0)', // 工具箱背景颜色
borderColor: '#ccc', // 工具箱边框颜色
borderWidth: 0, // 工具箱边框线宽,单位px,默认为0(无边框)
padding: 5, // 工具箱内边距,单位px,默认各方向内边距为5,
// 接受数组分别设定上右下左边距,同css
itemGap: 10, // 各个item之间的间隔,单位px,默认为10,
// 横向布局时为水平间隔,纵向布局时为纵向间隔
itemSize: 16, // 工具箱图形宽度
featureImageIcon : {}, // 自定义图片icon
featureTitle : {
mark : '辅助线开关',
markUndo : '删除辅助线',
markClear : '清空辅助线',
dataZoom : '区域缩放',
dataZoomReset : '区域缩放后退',
dataView : '数据视图',
lineChart : '折线图切换',
barChart : '柱形图切换',
restore : '还原',
saveAsImage : '保存为图片'
}
},
// 提示框
tooltip: {
trigger: 'item', // 触发类型,默认数据触发,见下图,可选为:'item' ¦ 'axis'
showDelay: 20, // 显示延迟,添加显示延迟可以避免频繁切换,单位ms
hideDelay: 100, // 隐藏延迟,单位ms
transitionDuration : 0.4, // 动画变换时间,单位s
backgroundColor: 'rgba(0,0,0,0.7)', // 提示背景颜色,默认为透明度为0.7的黑色
borderColor: '#333', // 提示边框颜色
borderRadius: 4, // 提示边框圆角,单位px,默认为4
borderWidth: 0, // 提示边框线宽,单位px,默认为0(无边框)
padding: 5, // 提示内边距,单位px,默认各方向内边距为5,
// 接受数组分别设定上右下左边距,同css
axisPointer : { // 坐标轴指示器,坐标轴触发有效
type : 'line', // 默认为直线,可选为:'line' | 'shadow'
lineStyle : { // 直线指示器样式设置
color: '#48b',
width: 2,
type: 'solid'
},
shadowStyle : { // 阴影指示器样式设置
width: 'auto', // 阴影大小
color: 'rgba(150,150,150,0.3)' // 阴影颜色
}
},
textStyle: {
color: '#fff'
}
},
// 区域缩放控制器
dataZoom: {
orient: 'horizontal', // 布局方式,默认为水平布局,可选为:
// 'horizontal' ¦ 'vertical'
// x: {number}, // 水平安放位置,默认为根据grid参数适配,可选为:
// {number}(x坐标,单位px)
// y: {number}, // 垂直安放位置,默认为根据grid参数适配,可选为:
// {number}(y坐标,单位px)
// width: {number}, // 指定宽度,横向布局时默认为根据grid参数适配
// height: {number}, // 指定高度,纵向布局时默认为根据grid参数适配
backgroundColor: 'rgba(0,0,0,0)', // 背景颜色
dataBackgroundColor: '#eee', // 数据背景颜色
fillerColor: 'rgba(144,197,237,0.2)', // 填充颜色
handleColor: 'rgba(70,130,180,0.8)' // 手柄颜色
},
// 网格
grid: {
x: 80,
y: 60,
x2: 80,
y2: 60,
// width: {totalWidth} - x - x2,
// height: {totalHeight} - y - y2,
backgroundColor: 'rgba(0,0,0,0)',
borderWidth: 1,
borderColor: '#ccc'
},
// 类目轴
categoryAxis: {
position: 'bottom', // 位置
nameLocation: 'end', // 坐标轴名字位置,支持'start' | 'end'
boundaryGap: true, // 类目起始和结束两端空白策略
axisLine: { // 坐标轴线
show: true, // 默认显示,属性show控制显示与否
lineStyle: { // 属性lineStyle控制线条样式
color: '#48b',
width: 2,
type: 'solid'
}
},
axisTick: { // 坐标轴小标记
show: true, // 属性show控制显示与否,默认不显示
interval: 'auto',
// onGap: null,
inside : false, // 控制小标记是否在grid里
length :5, // 属性length控制线长
lineStyle: { // 属性lineStyle控制线条样式
color: '#333',
width: 1
}
},
axisLabel: { // 坐标轴文本标签,详见axis.axisLabel
show: true,
interval: 'auto',
rotate: 0,
margin: 8,
// formatter: null,
textStyle: { // 其余属性默认使用全局文本样式,详见TEXTSTYLE
color: '#333'
}
},
splitLine: { // 分隔线
show: true, // 默认显示,属性show控制显示与否
// onGap: null,
lineStyle: { // 属性lineStyle(详见lineStyle)控制线条样式
color: ['#ccc'],
width: 1,
type: 'solid'
}
},
splitArea: { // 分隔区域
show: false, // 默认不显示,属性show控制显示与否
// onGap: null,
areaStyle: { // 属性areaStyle(详见areaStyle)控制区域样式
color: ['rgba(250,250,250,0.3)','rgba(200,200,200,0.3)']
}
}
},
// 数值型坐标轴默认参数
valueAxis: {
position: 'left', // 位置
nameLocation: 'end', // 坐标轴名字位置,支持'start' | 'end'
nameTextStyle: {}, // 坐标轴文字样式,默认取全局样式
boundaryGap: [0, 0], // 数值起始和结束两端空白策略
splitNumber: 5, // 分割段数,默认为5
axisLine: { // 坐标轴线
show: true, // 默认显示,属性show控制显示与否
lineStyle: { // 属性lineStyle控制线条样式
color: '#48b',
width: 2,
type: 'solid'
}
},
axisTick: { // 坐标轴小标记
show: false, // 属性show控制显示与否,默认不显示
inside : false, // 控制小标记是否在grid里
length :5, // 属性length控制线长
lineStyle: { // 属性lineStyle控制线条样式
color: '#333',
width: 1
}
},
axisLabel: { // 坐标轴文本标签,详见axis.axisLabel
show: true,
rotate: 0,
margin: 8,
// formatter: null,
textStyle: { // 其余属性默认使用全局文本样式,详见TEXTSTYLE
color: '#333'
}
},
splitLine: { // 分隔线
show: true, // 默认显示,属性show控制显示与否
lineStyle: { // 属性lineStyle(详见lineStyle)控制线条样式
color: ['#ccc'],
width: 1,
type: 'solid'
}
},
splitArea: { // 分隔区域
show: false, // 默认不显示,属性show控制显示与否
areaStyle: { // 属性areaStyle(详见areaStyle)控制区域样式
color: ['rgba(250,250,250,0.3)','rgba(200,200,200,0.3)']
}
}
},
polar : {
center : ['50%', '50%'], // 默认全局居中
radius : '75%',
startAngle : 90,
splitNumber : 5,
name : {
show: true,
textStyle: { // 其余属性默认使用全局文本样式,详见TEXTSTYLE
color: '#333'
}
},
axisLine: { // 坐标轴线
show: true, // 默认显示,属性show控制显示与否
lineStyle: { // 属性lineStyle控制线条样式
color: '#ccc',
width: 1,
type: 'solid'
}
},
axisLabel: { // 坐标轴文本标签,详见axis.axisLabel
show: false,
textStyle: { // 其余属性默认使用全局文本样式,详见TEXTSTYLE
color: '#333'
}
},
splitArea : {
show : true,
areaStyle : {
color: ['rgba(250,250,250,0.3)','rgba(200,200,200,0.3)']
}
},
splitLine : {
show : true,
lineStyle : {
width : 1,
color : '#ccc'
}
}
},
// 柱形图默认参数
bar: {
barMinHeight: 0, // 最小高度改为0
// barWidth: null, // 默认自适应
barGap: '30%', // 柱间距离,默认为柱形宽度的30%,可设固定值
barCategoryGap : '20%', // 类目间柱形距离,默认为类目间距的20%,可设固定值
itemStyle: {
normal: {
// color: '各异',
barBorderColor: '#fff', // 柱条边线
barBorderRadius: 0, // 柱条边线圆角,单位px,默认为0
barBorderWidth: 1, // 柱条边线线宽,单位px,默认为1
label: {
show: false
// position: 默认自适应,水平布局为'top',垂直布局为'right',可选为
// 'inside'|'left'|'right'|'top'|'bottom'
// textStyle: null // 默认使用全局文本样式,详见TEXTSTYLE
}
},
emphasis: {
// color: '各异',
barBorderColor: 'rgba(0,0,0,0)', // 柱条边线
barBorderRadius: 0, // 柱条边线圆角,单位px,默认为0
barBorderWidth: 1, // 柱条边线线宽,单位px,默认为1
label: {
show: false
// position: 默认自适应,水平布局为'top',垂直布局为'right',可选为
// 'inside'|'left'|'right'|'top'|'bottom'
// textStyle: null // 默认使用全局文本样式,详见TEXTSTYLE
}
}
}
},
// 折线图默认参数
line: {
itemStyle: {
normal: {
// color: 各异,
label: {
show: false
// position: 默认自适应,水平布局为'top',垂直布局为'right',可选为
// 'inside'|'left'|'right'|'top'|'bottom'
// textStyle: null // 默认使用全局文本样式,详见TEXTSTYLE
},
lineStyle: {
width: 2,
type: 'solid',
shadowColor : 'rgba(0,0,0,0)', //默认透明
shadowBlur: 5,
shadowOffsetX: 3,
shadowOffsetY: 3
}
},
emphasis: {
// color: 各异,
label: {
show: false
// position: 默认自适应,水平布局为'top',垂直布局为'right',可选为
// 'inside'|'left'|'right'|'top'|'bottom'
// textStyle: null // 默认使用全局文本样式,详见TEXTSTYLE
}
}
},
//smooth : false,
//symbol: null, // 拐点图形类型
symbolSize: 2, // 拐点图形大小
//symbolRotate : null, // 拐点图形旋转控制
showAllSymbol: false // 标志图形默认只有主轴显示(随主轴标签间隔隐藏策略)
},
// K线图默认参数
k: {
// barWidth : null // 默认自适应
// barMaxWidth : null // 默认自适应
itemStyle: {
normal: {
color: '#fff', // 阳线填充颜色
color0: '#00aa11', // 阴线填充颜色
lineStyle: {
width: 1,
color: '#ff3200', // 阳线边框颜色
color0: '#00aa11' // 阴线边框颜色
}
},
emphasis: {
// color: 各异,
// color0: 各异
}
}
},
// 散点图默认参数
scatter: {
//symbol: null, // 图形类型
symbolSize: 4, // 图形大小,半宽(半径)参数,当图形为方向或菱形则总宽度为symbolSize * 2
//symbolRotate : null, // 图形旋转控制
large: false, // 大规模散点图
largeThreshold: 2000,// 大规模阀值,large为true且数据量>largeThreshold才启用大规模模式
itemStyle: {
normal: {
// color: 各异,
label: {
show: false
// position: 默认自适应,水平布局为'top',垂直布局为'right',可选为
// 'inside'|'left'|'right'|'top'|'bottom'
// textStyle: null // 默认使用全局文本样式,详见TEXTSTYLE
}
},
emphasis: {
// color: '各异'
label: {
show: false
// position: 默认自适应,水平布局为'top',垂直布局为'right',可选为
// 'inside'|'left'|'right'|'top'|'bottom'
// textStyle: null // 默认使用全局文本样式,详见TEXTSTYLE
}
}
}
},
// 雷达图默认参数
radar : {
itemStyle: {
normal: {
// color: 各异,
label: {
show: false
},
lineStyle: {
width: 2,
type: 'solid'
}
},
emphasis: {
// color: 各异,
label: {
show: false
}
}
},
//symbol: null, // 拐点图形类型
symbolSize: 2 // 可计算特性参数,空数据拖拽提示图形大小
//symbolRotate : null, // 图形旋转控制
},
// 饼图默认参数
pie: {
center : ['50%', '50%'], // 默认全局居中
radius : [0, '75%'],
clockWise : false, // 默认逆时针
startAngle: 90,
minAngle: 0, // 最小角度改为0
selectedOffset: 10, // 选中是扇区偏移量
itemStyle: {
normal: {
// color: 各异,
borderColor: '#fff',
borderWidth: 1,
label: {
show: true,
position: 'outer'
// textStyle: null // 默认使用全局文本样式,详见TEXTSTYLE
},
labelLine: {
show: true,
length: 20,
lineStyle: {
// color: 各异,
width: 1,
type: 'solid'
}
}
},
emphasis: {
// color: 各异,
borderColor: 'rgba(0,0,0,0)',
borderWidth: 1,
label: {
show: false
// position: 'outer'
// textStyle: null // 默认使用全局文本样式,详见TEXTSTYLE
},
labelLine: {
show: false,
length: 20,
lineStyle: {
// color: 各异,
width: 1,
type: 'solid'
}
}
}
}
},
map: {
mapType: 'china', // 各省的mapType暂时都用中文
mapLocation: {
x : 'center',
y : 'center'
// width // 自适应
// height // 自适应
},
showLegendSymbol : true, // 显示图例颜色标识(系列标识的小圆点),存在legend时生效
itemStyle: {
normal: {
// color: 各异,
borderColor: '#fff',
borderWidth: 1,
areaStyle: {
color: '#ccc'//rgba(135,206,250,0.8)
},
label: {
show: false,
textStyle: {
color: 'rgba(139,69,19,1)'
}
}
},
emphasis: { // 也是选中样式
// color: 各异,
borderColor: 'rgba(0,0,0,0)',
borderWidth: 1,
areaStyle: {
color: 'rgba(255,215,0,0.8)'
},
label: {
show: false,
textStyle: {
color: 'rgba(139,69,19,1)'
}
}
}
}
},
force : {
// 数据map到圆的半径的最小值和最大值
minRadius : 10,
maxRadius : 20,
density : 1.0,
attractiveness : 1.0,
// 初始化的随机大小位置
initSize : 300,
// 向心力因子,越大向心力越大
centripetal : 1,
// 冷却因子
coolDown : 0.99,
// 分类里如果有样式会覆盖节点默认样式
itemStyle: {
normal: {
// color: 各异,
label: {
show: false
// textStyle: null // 默认使用全局文本样式,详见TEXTSTYLE
},
nodeStyle : {
brushType : 'both',
color : '#f08c2e',
strokeColor : '#5182ab'
},
linkStyle : {
strokeColor : '#5182ab'
}
},
emphasis: {
// color: 各异,
label: {
show: false
// textStyle: null // 默认使用全局文本样式,详见TEXTSTYLE
},
nodeStyle : {},
linkStyle : {}
}
}
},
chord : {
radius : ['65%', '75%'],
center : ['50%', '50%'],
padding : 2,
sort : 'none', // can be 'none', 'ascending', 'descending'
sortSub : 'none', // can be 'none', 'ascending', 'descending'
startAngle : 90,
clockWise : false,
showScale : false,
showScaleText : false,
itemStyle : {
normal : {
label : {
show : true
// textStyle: null // 默认使用全局文本样式,详见TEXTSTYLE
},
lineStyle : {
width : 0,
color : '#000'
},
chordStyle : {
lineStyle : {
width : 1,
color : '#666'
}
}
},
emphasis : {
lineStyle : {
width : 0,
color : '#000'
},
chordStyle : {
lineStyle : {
width : 2,
color : '#333'
}
}
}
}
},
island: {
r: 15,
calculateStep: 0.1 // 滚轮可计算步长 0.1 = 10%
},
markPoint : {
symbol: 'pin', // 标注类型
symbolSize: 10, // 标注大小,半宽(半径)参数,当图形为方向或菱形则总宽度为symbolSize * 2
//symbolRotate : null, // 标注旋转控制
itemStyle: {
normal: {
// color: 各异,
// borderColor: 各异, // 标注边线颜色,优先于color
borderWidth: 2, // 标注边线线宽,单位px,默认为1
label: {
show: true,
position: 'inside' // 可选为'left'|'right'|'top'|'bottom'
// textStyle: null // 默认使用全局文本样式,详见TEXTSTYLE
}
},
emphasis: {
// color: 各异
label: {
show: true
// position: 'inside' // 'left'|'right'|'top'|'bottom'
// textStyle: null // 默认使用全局文本样式,详见TEXTSTYLE
}
}
}
},
markLine : {
// 标线起始和结束的symbol介绍类型,如果都一样,可以直接传string
symbol: ['circle', 'arrow'],
// 标线起始和结束的symbol大小,半宽(半径)参数,当图形为方向或菱形则总宽度为symbolSize * 2
symbolSize: [2, 4],
// 标线起始和结束的symbol旋转控制
//symbolRotate : null,
itemStyle: {
normal: {
// color: 各异, // 标线主色,线色,symbol主色
// borderColor: 随color, // 标线symbol边框颜色,优先于color
borderWidth: 2, // 标线symbol边框线宽,单位px,默认为2
label: {
show: false,
// 可选为 'start'|'end'|'left'|'right'|'top'|'bottom'
position: 'inside',
textStyle: { // 默认使用全局文本样式,详见TEXTSTYLE
color: '#333'
}
},
lineStyle: {
// color: 随borderColor, // 主色,线色,优先级高于borderColor和color
// width: 随borderWidth, // 优先于borderWidth
type: 'solid',
shadowColor : 'rgba(0,0,0,0)', //默认透明
shadowBlur: 5,
shadowOffsetX: 3,
shadowOffsetY: 3
}
},
emphasis: {
// color: 各异
label: {
show: false
// position: 'inside' // 'left'|'right'|'top'|'bottom'
// textStyle: null // 默认使用全局文本样式,详见TEXTSTYLE
},
lineStyle : {}
}
}
},
textStyle: {
decoration: 'none',
fontFamily: 'Arial, Verdana, sans-serif',
fontFamily2: '微软雅黑', // IE8- 字体模糊并且不支持不同字体混排,额外指定一份
fontSize: 12,
fontStyle: 'normal',
fontWeight: 'normal'
},
// 默认标志图形类型列表
symbolList : [
'circle', 'rectangle', 'triangle', 'diamond',
'emptyCircle', 'emptyRectangle', 'emptyTriangle', 'emptyDiamond'
],
loadingText : 'Loading...',
// 可计算特性配置,孤岛,提示颜色
calculable: false, // 默认关闭可计算特性
calculableColor: 'rgba(255,165,0,0.6)', // 拖拽提示边框颜色
calculableHolderColor: '#ccc', // 可计算占位提示颜色
nameConnector: ' & ',
valueConnector: ' : ',
animation: true,
animationThreshold: 2500, // 动画元素阀值,产生的图形原素超过2500不出动画
addDataAnimation: true, // 动态数据接口是否开启动画效果
animationDuration: 2000,
animationEasing: 'ExponentialOut' //BounceOut
}
【ECharts】01 快速上手的更多相关文章
- echarts柱状图快速上手笔记地址
https://blog.csdn.net/qq_40323256/article/details/114890628 借鉴借鉴
- 快速上手 Echarts
最近使用到了 百度的 Echarts 数据可视化工具,这里简单介绍如何快速上手. 一.下载 这里选择目前最新版本,4.2.1 地址:https://github.com/apache/incubato ...
- ESFramework 4.0 快速上手(01) -- Rapid引擎
(在阅读该文之前,请先阅读 ESFramework 4.0 概述 ,会对本文的理解更有帮助.) ESFramework/ESPlatform 4.0 的终极目标是为百万级的用户同时在线提供支持,因为强 ...
- ESFramework 4.0 快速上手(06) -- Rapid引擎(续)
<ESFramework 4.0 快速上手>系列介绍的都是如何使用Rapid引擎(快速引擎) -- RapidServerEngine 和 RapidPassiveEngine.其实,大家 ...
- Requests快速上手
发送请求 使用 Requests 发送网络请求非常简单. 一开始要导入 Requests 模块: >>> import requests 然后,尝试获取某个网页.本例子中,我们来获取 ...
- [Full-stack] 快速上手开发 - React
故事背景 [1] 博客笔记结合<React快速上手开发>再次系统地.全面地走一遍. [2] React JS Tutorials:包含了JS --> React --> Red ...
- python的requests快速上手、高级用法和身份认证
https://blog.csdn.net/qq_25134989/article/details/78800209 快速上手 迫不及待了吗?本页内容为如何入门 Requests 提供了很好的指引.其 ...
- 【opencv入门篇】 10个程序快速上手opencv【下】
导言:本系列博客目的在于能够在vs快速上手opencv,理论知识涉及较少,大家有兴趣可以查阅其他博客深入了解相关的理论知识,本博客后续也会对图像方向的理论进一步分析,敬请期待:) 上篇传送:http: ...
- 三分钟快速上手TensorFlow 2.0 (上)——前置基础、模型建立与可视化
本文学习笔记参照来源:https://tf.wiki/zh/basic/basic.html 学习笔记类似提纲,具体细节参照上文链接 一些前置的基础 随机数 tf.random uniform(sha ...
- 【转】Vue.js 2.0 快速上手精华梳理
Vue.js 2.0 快速上手精华梳理 Sandy 发掘代码技巧:公众号:daimajiqiao 自从Vue2.0发布后,Vue就成了前端领域的热门话题,github也突破了三万的star,那么对于新 ...
随机推荐
- map和解构赋值的拷贝
map遍历之后返回的数组是深拷贝,解构赋值一维的是深拷贝,二维是浅拷贝
- elementUI slider组件,带范围选择实现双向绑定
网上查过很多相关文章都没有一章是写element ui滑块带范围实现双向绑定 二个滑块二头的数据怎么得到 我的需求是做个时间轴要滑动选择不同的时间 开始很难做最后一点一点摸索得出的结论 好在写出来了先 ...
- Adobe软件资源 PS PR AE等等
整理了一波Adobe软件,19年20年21年Mac版本的都有,关注Rand_cs即可领取
- Steam Epic 启动程序默认地址
Steam Epic 启动程(启动器)序默认地址 "D:\Games\EpicAPP\Epic Games\Launcher\Portal\Binaries\Win32\EpicGamesL ...
- LINQ to Entities does not recognize the method 'System.String ToString()' method
LINQ to Entities does not recognize the method 'System.String ToString()' method, and this method ca ...
- nordic的nrf52系列——ADC在使用时如何校准增益误差(基于SDK)
简介:ADC在实际使用的时候都要进行误差校准,那Nordic的nrf52系列如何进行校准,如果不校准又有什么影响尼,接下来我将通过实验进行测试,验证不校准和校准的影响(本测试的基础是,默认输入阻抗和采 ...
- 订单请求接口设计,避免timeout超时问题 下单解决
订单请求接口设计,避免timeout超时问题 下单解决 接上篇:外部系统对接下单幂等性校验逻辑及接口超时处理 https://www.cnblogs.com/oktokeep/p/17668039.h ...
- 行为型模式(Behavioer Pattern)
行为型设计模式 行为型模式定义了系统中对象之间的交互与通信,研究系统在运行时对象之间的相互通信与协作,进一步明确对象的职责,包括对系统中较为复杂的流程的控制. 在软件系统运行时对象并不是孤立存在的,它 ...
- Asp.net Core Flurl.Http 结合IHttpClientFactory管理HttpClient生命周期
Asp.net Core, 在我用过的多种Http REST 客户端: RestSharp WebApiClient Refit Flurl 中,Flurl可以说是最符合我口味的,用起来那可真的顺滑无 ...
- 关于 Jupyter Nbconvert 自定义 LaTeX 模板,中文兼容与格式设置,从 Notebook 构建 LaTeX PDF 文档
目录 为什么会有这篇随笔的内容? 简述一下我遇到的问题 Nbconvert 转换 .ipynb 文件的基本方法 Jupyter Nbconvert 构建中文 \(\LaTeX\) 文档的痛点 Jupy ...