python批量制作雷达图
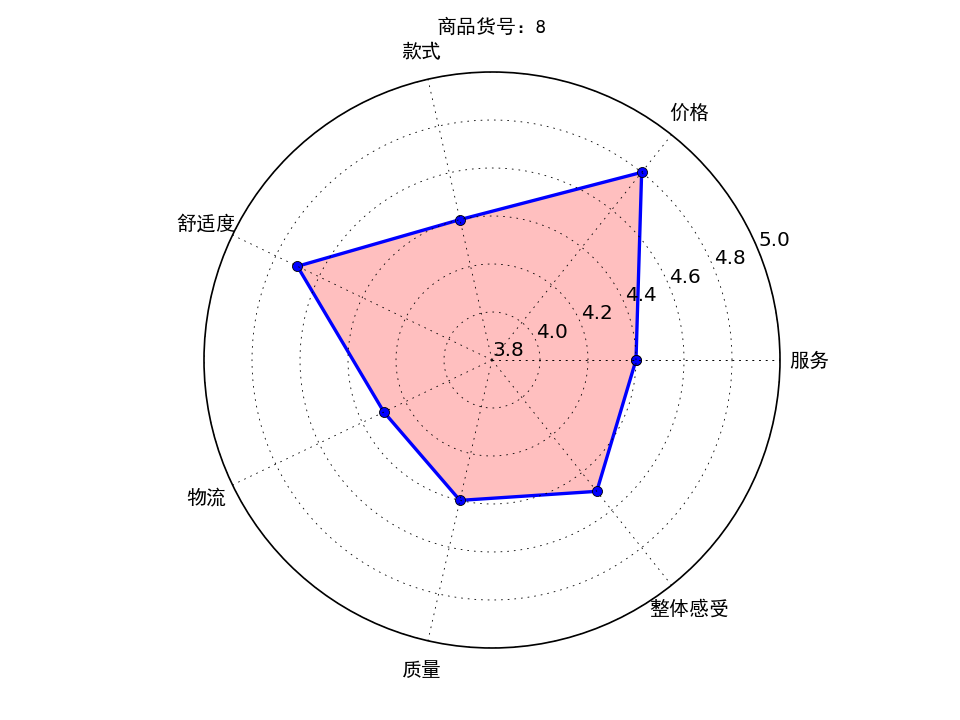
老板要画雷达图,但是数据好多组怎么办?不能一个一个点excel去画吧,那么可以利用python进行批量制作,得到样式如下:
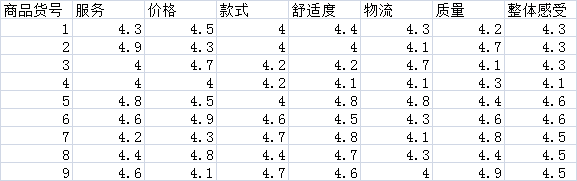
首先制作一个演示的excel,评分为excel随机数生成:
1 =INT((RAND()+4)*10)/10
加入标签等得到的excel样式如下(部分,共计32行):
那么接下来就是打开python写码了,本文是基于python3.4进行编写
 wb = load_workbook(filename=r'C:\Users\Administrator\Desktop\数据指标.xlsx')  ##读取路径

     ws = wb.get_sheet_by_name("Sheet1")  ##读取名字为Sheet1的sheet表

     info_id = []

     info_first = []

     for row_A in range(2, 32):  ## 遍历第2行到32行

         id = ws.cell(row=row_A, column=1).value  ## 遍历第2行到32行,第1列

         info_id.append(id)

     for col in range(2, 9):  ##读取第1到9列

         first = ws.cell(row=1, column=col).value

         info_first.append(first)  ##得到1到8列的标签

     info_data = []

     for row_num_BtoU in range(2, len(info_id) + 2):  ## 遍历第2行到32行

         row_empty = []  ##建立一个空数组作为临时储存地,每次换行就被清空

         for i in range(2, 9):  ## 遍历第2行到32行,第2到9列

             data_excel = ws.cell(row=row_num_BtoU, column=i).value

             if data_excel == None:

                 pass

             else:

                 row_empty.append(data_excel)  ##将单元格信息储存进去

         info_data.append(row_empty)
分步讲解:
读取excel表格:
   wb = load_workbook(filename=r'C:\Users\Administrator\Desktop\数据指标.xlsx')  ##读取路径

     ws = wb.get_sheet_by_name("Sheet1")  ##读取名字为Sheet1的sheet表
需要用到库:
import xlsxwriter
from openpyxl import load_workbook
在命令指示符下输入:
pip install xlsxwriter
等待安装即可,后面的库也是如此:
将第一列ID储存,以及第一行的标签,标签下面的数值分别储存在:
    info_id = []

    info_first = []

    info_data = []
读取数据后接下来需要设置写入的格式:
 workbook = xlsxwriter.Workbook('C:\\Users\\Administrator\\Desktop\\result.xlsx')

     worksheet = workbook.add_worksheet()  # 创建一个工作表对象

     #字体格式

     font = workbook.add_format(

         {'border': 1, 'align': 'center', 'font_size': 11, 'font_name': '微软雅黑'})  ##字体居中,11号,微软雅黑,给一般的信息用的

     #写下第一行第一列的标签

     worksheet.write(0, 0, '商品货号', font)

     ##设置图片的那一列宽度

     worksheet.set_column(0, len(info_first) + 1, 11)  # 设定第len(info_first) + 1列的宽度为11
将标签数据等写入新的excel表格中:
 #新建一个excel保存结果

     workbook = xlsxwriter.Workbook('C:\\Users\\Administrator\\Desktop\\result.xlsx')

     worksheet = workbook.add_worksheet()  # 创建一个工作表对象

     #字体格式

     font = workbook.add_format(

         {'border': 1, 'align': 'center', 'font_size': 11, 'font_name': '微软雅黑'})  ##字体居中,11号,微软雅黑,给一般的信息用的

     #写下第一行第一列的标签

     worksheet.write(0, 0, '商品货号', font)

     ##设置图片的那一列宽度

     worksheet.set_column(0, len(info_first) + 1, 11)  # 设定第len(info_first) + 1列的宽度为11

     ##写入标签

     for k in range(0,7):

         worksheet.write(0, k + 1, info_first[k], font)

     #写入最后一列标签

     worksheet.write(0, len(info_first) + 1, '雷达图', font)
制作雷达图:
     #设置雷达各个顶点的名称

     labels = np.array(info_first)

     #数据个数

     data_len = len(info_first)

     for i in range(0,len(info_id)):

         data = np.array(info_data[i])

         angles = np.linspace(0, 2*np.pi, data_len, endpoint=False)

         data = np.concatenate((data, [data[0]])) # 闭合

         angles = np.concatenate((angles, [angles[0]])) # 闭合

         fig = plt.figure()

         ax = fig.add_subplot(111, polar=True)# polar参数!!

         ax.plot(angles, data, 'bo-', linewidth=2)# 画线

         ax.fill(angles, data, facecolor='r', alpha=0.25)# 填充

         ax.set_thetagrids(angles * 180/np.pi, labels, fontproperties="SimHei")

         ax.set_title("商品货号:" + str(info_id[i]), va='bottom', fontproperties="SimHei")

         ax.set_rlim(3.8,5)# 设置雷达图的范围

         ax.grid(True)

         plt.savefig("C:\\Users\\Administrator\\Desktop\\result\\商品货号:" + str(info_id[i]) + ".png", dpi=120)
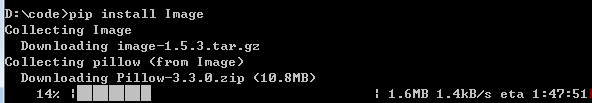
图片太大怎么办?用库改变大小即可:
         import Image

         ##更改图片大小

         infile = “C:\\Users\\Administrator\\Desktop\\result\\商品货号:" + str(info_id[i]) + ".png“

         outfile = ”C:\\Users\\Administrator\\Desktop\\result1\\商品货号:" + str(info_id[i]) + ".png”

         im = Image.open(infile)

         (x, y) = im.size

         x_s = 80    ## 设置长

         y_s = 100  ## 设置宽

         out = im.resize((x_s, y_s), Image.ANTIALIAS)

         out.save(outfile,'png',quality = 95)
将大图片和小图片放在了result和result1两个不同的文件夹,需要再前边创建这两个文件夹:
     if os.path.exists(r'C:\\Users\\Administrator\\Desktop\\result'):  # 建立一个文件夹在桌面,文件夹为result

         print('result文件夹已经在桌面存在,继续运行程序……')

     else:

         print('result文件夹不在桌面,新建文件夹result')

         os.mkdir(r'C:\\Users\\Administrator\\Desktop\\result')

         print('文件夹建立成功,继续运行程序')

     if os.path.exists(r'C:\\Users\\Administrator\\Desktop\\result1'):  # 建立一个文件夹在C盘,文件夹为result1

         print('result1文件夹已经在桌面存在,继续运行程序……')

     else:

         print('result1文件夹不在桌面,新建文件夹result1')

         os.mkdir(r'C:\\Users\\Administrator\\Desktop\\result1')

         print('文件夹建立成功,继续运行程序')
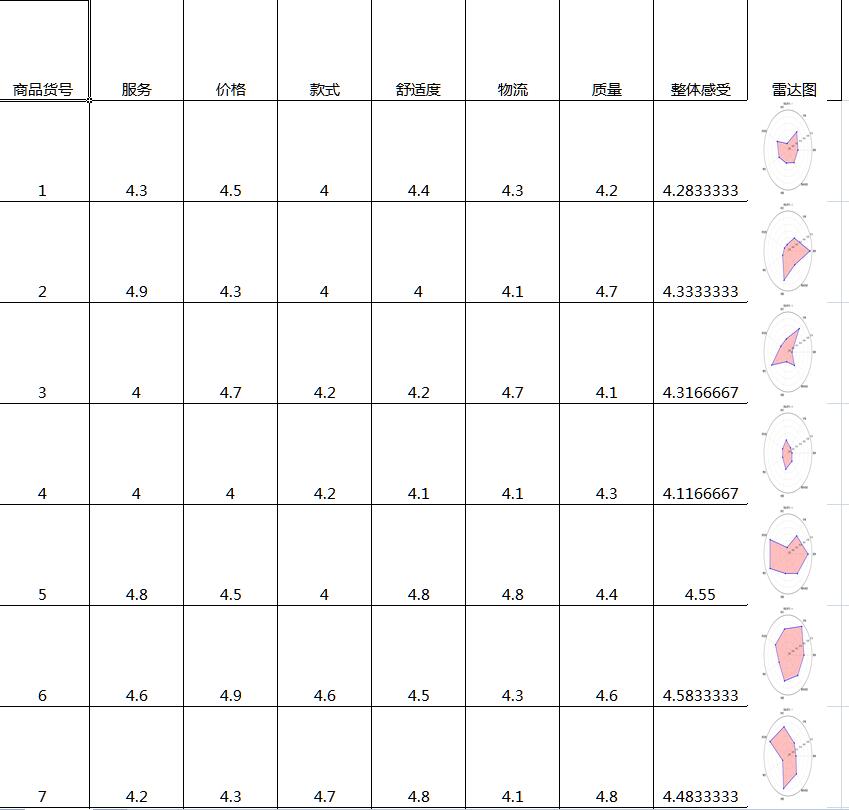
最后插入图片到excel中:
         worksheet.insert_image(i + 1, len(info_first) + 1, 'C:\\Users\\Administrator\\Desktop\\result1\\' + "商品货号:" + str(info_id[i]) + '.png')  ##写入图片

         time.sleep(1)##防止写入太快电脑死机

         plt.close() #   一定要关掉图片,不然python打开图片20个后会崩溃

     workbook.close()#最后关闭excel
得到的效果如下:
附上完整代码:
 import numpy as np

 import matplotlib.pyplot as plt

 import xlsxwriter

 from openpyxl import load_workbook

 import os

 import time

 from PIL import Image

 if __name__ == '__main__':

     if os.path.exists(r'C:\\Users\\Administrator\\Desktop\\result'):  # 建立一个文件夹在桌面,文件夹为result

         print('result文件夹已经在桌面存在,继续运行程序……')

     else:

         print('result文件夹不在桌面,新建文件夹result')

         os.mkdir(r'C:\\Users\\Administrator\\Desktop\\result')

         print('文件夹建立成功,继续运行程序')

     if os.path.exists(r'C:\\Users\\Administrator\\Desktop\\result1'):  # 建立一个文件夹在C盘,文件夹为result1

         print('result1文件夹已经在桌面存在,继续运行程序……')

     else:

         print('result1文件夹不在桌面,新建文件夹result1')

         os.mkdir(r'C:\\Users\\Administrator\\Desktop\\result1')

         print('文件夹建立成功,继续运行程序')

     wb = load_workbook(filename=r'C:\Users\Administrator\Desktop\数据指标.xlsx')  ##读取路径

     ws = wb.get_sheet_by_name("Sheet1")  ##读取名字为Sheet1的sheet表

     info_id = []

     info_first = []

     for row_A in range(2, 32):  ## 遍历第2行到32行

         id = ws.cell(row=row_A, column=1).value  ## 遍历第2行到32行,第1列

         info_id.append(id)

     for col in range(2, 9):  ##读取第1到9列

         first = ws.cell(row=1, column=col).value

         info_first.append(first)  ##得到1到8列的标签

     print(info_id)

     print(info_first)

     info_data = []

     for row_num_BtoU in range(2, len(info_id) + 2):  ## 遍历第2行到32行

         row_empty = []  ##建立一个空数组作为临时储存地,每次换行就被清空

         for i in range(2, 9):  ## 遍历第2行到32行,第2到9列

             data_excel = ws.cell(row=row_num_BtoU, column=i).value

             if data_excel == None:

                 pass

             else:

                 row_empty.append(data_excel)  ##将单元格信息储存进去

         info_data.append(row_empty)

     print(info_data)

     print(len(info_data))

     # 设置雷达各个顶点的名称

     labels = np.array(info_first)

     # 数据个数

     data_len = len(info_first)

     # 新建一个excel保存结果

     workbook = xlsxwriter.Workbook('C:\\Users\\Administrator\\Desktop\\result.xlsx')

     worksheet = workbook.add_worksheet()  # 创建一个工作表对象

     # 字体格式

     font = workbook.add_format(

         {'border': 1, 'align': 'center', 'font_size': 11, 'font_name': '微软雅黑'})  ##字体居中,11号,微软雅黑,给一般的信息用的

     # 写下第一行第一列的标签

     worksheet.write(0, 0, '商品货号', font)

     ##设置图片的那一列宽度

     worksheet.set_column(0, len(info_first) + 1, 11)  # 设定第len(info_first) + 1列的宽度为11

     ##写入标签

     for k in range(0, 7):

         worksheet.write(0, k + 1, info_first[k], font)

     # 写入最后一列标签

     worksheet.write(0, len(info_first) + 1, '雷达图', font)

     # 将其他参数写入excel中

     for j in range(0, len(info_id)):

         worksheet.write(j + 1, 0, info_id[j], font)  # 写入商品货号

         worksheet.set_row(j, 76)  ##设置行宽

         for x in range(0, len(info_first)):

             worksheet.write(j + 1, x + 1, info_data[j][x], font)  # 写入商品的其他参数

     for i in range(0, len(info_id)):

         data = np.array(info_data[i])

         angles = np.linspace(0, 2 * np.pi, data_len, endpoint=False)

         data = np.concatenate((data, [data[0]]))  # 闭合

         angles = np.concatenate((angles, [angles[0]]))  # 闭合

         fig = plt.figure()

         ax = fig.add_subplot(111, polar=True)  # polar参数!!

         ax.plot(angles, data, 'bo-', linewidth=2)  # 画线

         ax.fill(angles, data, facecolor='r', alpha=0.25)  # 填充

         ax.set_thetagrids(angles * 180 / np.pi, labels, fontproperties="SimHei")

         ax.set_title("商品货号:" + str(info_id[i]), va='bottom', fontproperties="SimHei")

         ax.set_rlim(3.8, 5)  # 设置雷达图的范围

         ax.grid(True)

         plt.savefig("C:\\Users\\Administrator\\Desktop\\result\\商品货号:" + str(info_id[i]) + ".png", dpi=120)

         # plt.show()在python中显示

         ##更改图片大小

         infile = "C:\\Users\\Administrator\\Desktop\\result\\商品货号:" + str(info_id[i]) + ".png"

         outfile = "C:\\Users\\Administrator\\Desktop\\result1\\商品货号:" + str(info_id[i]) + ".png"

         im = Image.open(infile)

         (x, y) = im.size

         x_s = 80  ## 设置长

         y_s = 100  ## 设置宽

         out = im.resize((x_s, y_s), Image.ANTIALIAS)

         out.save(outfile, 'png', quality=95)

         worksheet.insert_image(i + 1, len(info_first) + 1,

                                'C:\\Users\\Administrator\\Desktop\\result1\\' + "商品货号:" + str(

                                    info_id[i]) + '.png')  ##写入图片

         time.sleep(1)  ##防止写入太快电脑死机

         plt.close()  # 一定要关掉图片,不然python打开图片20个后会崩溃

     workbook.close()  # 最后关闭excel
python批量制作雷达图的更多相关文章
- python+matplotlib制作雷达图3例分析和pandas读取csv操作
1.例一 图1 代码1 #第1步:导出模块 import numpy as np import matplotlib.pyplot as plt from matplotlib import font ...
- 在Excel中制作雷达图
雷达图的作用 雷达图是专门用来进行多指标体系比较分析的专业图表.从雷达图中可以看出指标的实际值与参照值的偏离程度,从而为分析者提供有益的信息.雷达图一般用于成绩展示.效果对比量化.多维数据对比等等,只 ...
- HTML5 Canvas制作雷达图实战
雷达图又叫蜘蛛网图,是一种对各项数据查看很明显的表现图,在很多游戏中,对游戏中的每个角色的分析图一般也用这种图. 下面,用HTML5的Cavas来实现雷达图. 效果 一.创建Canvas var mW ...
- DevExpressXtraReport—制作雷达图
存储过程: SET ANSI_NULLS ON GO SET QUOTED_IDENTIFIER ON GO -- ========================================== ...
- 用Python批量裁取图,来获取文件夹中所有图片名
批量截图(截取正方形图,哪个边短就用哪个边作为标准来截取) 功能是裁取图片中红色框的部分. 代码为: import sys from tkinter.tix import Tk from PIL im ...
- Python成绩单雷达图
1numpy库 numpy 是 python 的科学计算库 部分功能: 1.使用numpy读取txt文件 # dtype = "str":指定数据格式 # delimiter = ...
- Python绘制雷达图(俗称六芒星)
原文链接:https://blog.csdn.net/Just_youHG/article/details/83904618 背景 <Python数据分析与挖掘实战> 案例2–航空公司客户 ...
- 使用python制作动图
利用python制作gif图 引言 当写文章时候,多张图片会影响排版,可以考虑制作gif图 准备 pip install imageio 代码 # This is a sample Python sc ...
- Python成绩雷达图
代码 import numpy as np import matplotlib import matplotlib.pyplot as plt matplotlib.rcParams['font.fa ...
随机推荐
- ERP通用存储过程封装(三)
一:解释 SQL Server提供了一种方法:可以将一些预先编译的SQL语句集中起来由SQL Server数据库服务器来完成以实现某个任务,这就是存储过程.存储过程常驻在SQL Server ...
- Unity3D ShaderLab 透明裁剪着色器
Unity3D ShaderLab 透明裁剪着色器 上一篇,我们介绍了使用Alpha实现透明的手法,其实Unity为我们的#pragma提供了另一种参数,是我们能做出更高效 简单的透明效果,也就是裁剪 ...
- C#_WinForm接收命令行参数
C#_WinForm接收命令行参数 2014-08-03 10:17 534人阅读 评论(0) 收藏 举报 首先,我要仔细的声明下,本文讲的是接受命令行参数,让程序启动.而不是启动那个黑黑的框...我 ...
- iOS-appDelegate 生命周期
- (void)applicationWillResignActive:(UIApplication *)application 说明:当应用程序将要入非活动状态执行,在此期间,应用程序不接收消息或事 ...
- MINIX3 内核时钟分析
MINIX3 内核时钟分析 4.1 内核时钟概要 先想想为什么 OS 需要时钟?时钟是异步的一个非常重要的标志,设想一下,如 果我们的应用程序需要在多少秒后将触发某个程序或者进程,我们该怎么做到? ...
- ubuntu 挂载优盘
不知道为什么重装一次ubuntu后无法自动挂载优盘,只好手动: sudo mount /dev/sdb1 /media/YCC_FD/ 注意,这里优盘是sdb 而非sda 查找自己优盘在什么地方,可以 ...
- 如何重启Activity
有的时候,我们只是想重启某个Activity,但是不重启整个App. 一种做法是: Intent intent = getIntent(); overridePendingTransition(0, ...
- ss命令使用示例
导读 ss是Socket Statistics的缩写,可以用来获取socket统计信息,它可以显示和netstat类似的内容.但ss的优势在于它能够显示更多更详细的有关TCP和连接状态的信息,而且比n ...
- DataTransfer(setData()方法)
DataTransfer对象专门用来存储拖放时要携带的数据,它可以被设置为拖放事件对象的DataTransfer属性.---把拖动的数据存入其中setData有两个参数:1.第一个参数为携带数据的数据 ...
- UVa 839 天平
原题链接:https://uva.onlinejudge.org/index.php?option=com_onlinejudge&Itemid=8&page=show_problem ...