(转)How to Use Elasticsearch, Logstash, and Kibana to Manage MySQL Logs
A comprehensive log management and analysis strategy is vital, enabling organizations to understand the relationship between operational, security, and change management events and maintain a comprehensive understanding of their infrastructure. Log files from web servers, applications, and operating systems also provide valuable data, though in different formats, and in a random and distributed fashion.
No real-world web application can exist without a data storage backend, and most applications today use relational database management systems (RDBMS) for storing and managing data. The most commonly used database is MySQL, which is an open-source RDBMS that is the ‘M’ in the open-source enterprise LAMP Stack (Linux, Apache, MySQL and PHP).
Middle and large-sized applications send multiple database queries per second, and slow queries are often the cause of slow page loading and even crashes. The task of analyzing query performance is critical to determine the root cause of these bottlenecks, and most databases come with built-in profiling tools to help us.
Provisioning an Elasticsearch cluster in Qbox is easy. In this article, we walk you through the initial steps and show you how simple it is to start and configure your cluster. We then install and configure logstash to ship our MySQL or MariaDB/Galera logs to Elasticsearch. MySQL logs shipped to elasticsearch can then be visualized and analyzed via Kibana dashboards.
Our Goal
The goal of the tutorial is to use Qbox as a Centralised Logging and Monitoring solution. Qbox provides out of box solution for Elasticsearch, Kibana and many of Elasticsearch analysis and monitoring plugins. We will set up Logstash in a separate node or machine to gather MySQL or MariaDB/Galera logs from single or multiple servers, and use Qbox’s provisioned Kibana to visualize the gathered logs.
Our ELK stack setup has three main components:
Elasticsearch: It is used to store all of the application and monitoring logs(Provisioned by Qbox).
Logstash: The server component that processes incoming logs and feeds to ES.
Kibana: A web interface for searching and visualizing logs (Provisioned by Qbox).
For this post, we will be using hosted Elasticsearch on Qbox.io. You can sign up or launch your cluster here, or click "Get Started" in the header navigation. If you need help setting up, refer to "Provisioning a Qbox Elasticsearch Cluster."
Prerequisites
The amount of CPU, RAM, and storage that your Elasticsearch Server will require depends on the volume of logs that you intend to gather. For this tutorial, we will be using a Qbox provisioned Elasticsearch with the following minimum specs:
Provider:
AWSVersion:
5.1.1RAM:
1 GBCPU:
vCPU1Replicas:
0
The above specs can be changed per your desired requirements. Please select the appropriate names, versions, regions for your needs. For this example, we used Elasticsearch version 5.1.1, the most current version is 5.3. We support all versions of Elasticsearch on Qbox. (To learn more about the major differences between 2.x and 5.x, click here.)
In addition to our Elasticsearch Server, we will require a separate logstash server to process incoming MySQL or MariaDB/Galera logs from client servers and ship them to Elasticsearch. There can be a single or multiple client servers for which you wish to ship logs to Elasticsearch. For simplicity or testing purposes, the logstash server can also act as the client server itself. The Endpoint and Transport addresses for our Qbox provisioned Elasticsearch cluster are as follows:
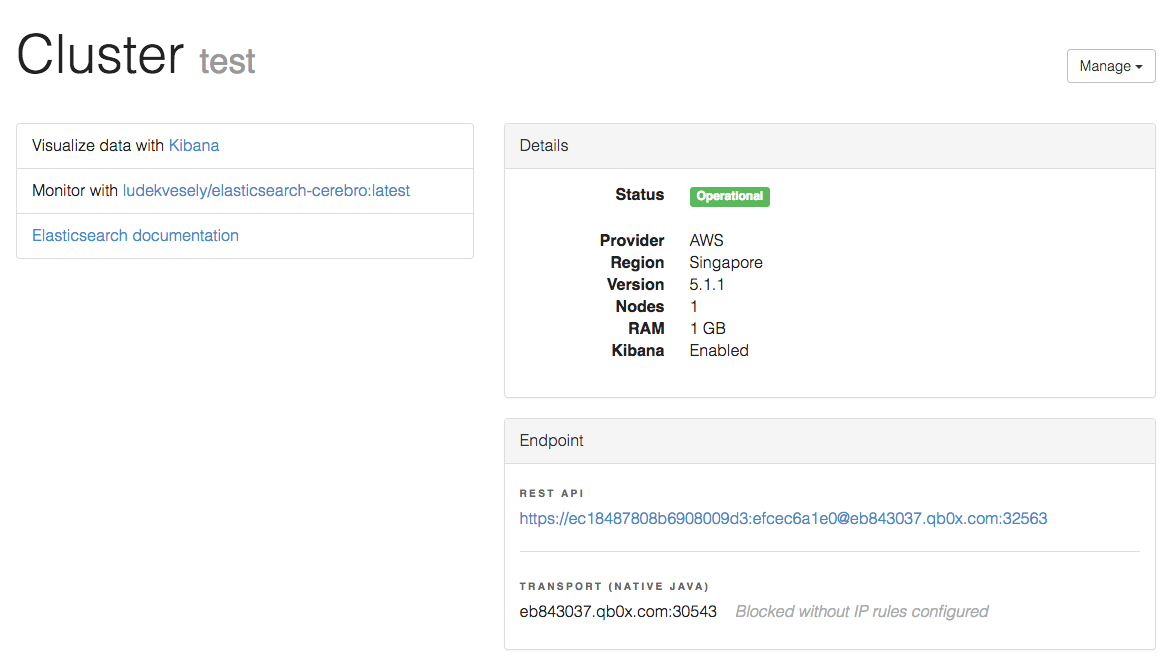
Endpoint: REST API
https://ec18487808b6908009d3:efcec6a1e0@eb843037.qb0x.com:32563
Authentication
Username =
ec18487808b6908009d3Password =
efcec6a1e0
TRANSPORT (NATIVE JAVA)
eb843037.qb0x.com:30543
Note: Please make sure to whitelist the logstash server IP from Qbox Elasticsearch cluster. Also, the elasticsearch server must have access to all client servers to collect MySQL logs from.
Installing MySQL
If you’ve already got MySQL installed, you can skip to the next step. If not, enter the following command to update your system:
sudo apt-get update
And then install MySQL:
sudo apt-get install mysql-server
During installation, you’ll need to set the root password. Make note of it, as you’ll be needing it whenever logging into mysql server.
Configure MySQL to Write Log Files
We need to configure MySQL to write general and slow query log files because those configurations are disabled by default. Then, we need to set the threshold for creating logs.
To do this, first open the ‘my.cnf’ configuration file:
sudo vim /etc/mysql/my.cnf
Next, uncomment and edit the following lines:
general_log_file = /var/log/mysql/mysql.log

general_log= 1

log_slow_queries = /var/log/mysql/mysql-slow.log

long_query_time = 1

log-queries-not-using-indexes = 1
Make sure to restart MySQL after making these changes:
sudo service mysql restart
Install Logstash
Download and install the Public Signing Key:
wget -qO - <a href="https://packages.elastic.co/GPG-KEY-elasticsearch">https://packages.elastic.co/GP...</a> | sudo apt-key add -
We will use the Logstash version 2.4.x as compatible with our Elasticsearch version 5.1.x. The Elastic Community Product Support Matrix can be referred in order to clear any version issues.
Add the repository definition to your /etc/apt/sources.list file:
echo "deb <a href="https://packages.elastic.co/logstash/2.4/debian">https://packages.elastic.co/lo...</a> stable main" | sudo tee -a /etc/apt/sources.list
Run sudo apt-get update and the repository is ready for use. You can install it with:
sudo apt-get update && sudo apt-get install logstash
Alternatively, logstash tar can also be downloaded from Elastic Product Releases Site. Then, the steps of setting up and running logstash are pretty simple:
Download and unzip Logstash
Prepare a
logstash.confconfig fileRun
bin/logstash -f logstash.conf -tto check config (logstash.conf)Run
bin/logstash -f logstash.conf
Configure Logstash
Logstash configuration files are in the JSON-format, and reside in /etc/logstash/conf.d. The configuration consists of three sections: inputs, filters, and outputs.
Let's create a configuration file called 02-mysql-input.conf and set up our "mysql" input:
sudo vi /etc/logstash/conf.d/02-mysql-input.conf
Insert the following input configuration:
input {

  file {

    path => ["/var/log/mysql/mysql.log", “/var/log/mysql/mysql-slow.log”, "/var/log/mysql/mysql_error.log"]

    type => "mysql"

  }

}
NOTE : MySQL log files path may differ based upon your environment, logging configuration and underlying OS.
Save and quit. This specifies a mysql input that will listen on tcp port 5044. Now let's create a configuration file called 10-mysql-filter.conf, where we will add a filter for mysql messages:
sudo vi /etc/logstash/conf.d/10-mysql-filter.conf
Insert the following mysql filter configuration:
filter {

   # Deal with the multi-line MySQL/MariaDB log entries

   if [type] == "mysql" {

       multiline {

           pattern => "^%{NUMBER} *%{NUMBER}"

           negate  => true

           what    => "previous"

       }

       # Strip out MySQLs messy timestamps

       grok {

           match => [ 'message', "(?m)^%{NUMBER:date} *%{NOTSPACE:time} %{GREEDYDATA:message}" ]

           overwrite => [ 'message' ]

           add_field => { "mysql_time" => "%{date} %{time}" }

       }

       # Check if we have a severity field

       if [message] =~ /^\[/ {

           grok {

               match => [ 'message', "(?m)\[%{NOTSPACE:severity}\] %{GREEDYDATA:message}" ]

               overwrite => [ 'message' ]

           }

       }

       # If the message contains WSREP:, it regards the galera cluster

       if  [message] =~ /WSREP:/ {

           mutate {

               replace => [ "type", "Galera" ]

           }

           grok {

               match => [ 'message', "(?m)WSREP: %{GREEDYDATA:message}" ]

               overwrite => [ 'message' ]

           }

       }

   }

}
Save and quit. This filter looks for logs that are labeled as "mysql" type and it will try to use grok to parse incoming MySQL logs to make it structured and queryable.
Lastly, we will create a configuration file called 30-elasticsearch-output.conf:
sudo vi /etc/logstash/conf.d/30-elasticsearch-output.conf
Insert the following output configuration:
output {

 elasticsearch {

   hosts => ["https://eb843037.qb0x.com:32563/"]

   user => "ec18487808b6908009d3"

   password => "efcec6a1e0"

   index => "mysql-%{+YYYY.MM.dd}"

   document_type => "mysql_logs"

 }

 stdout { codec => rubydebug }

}
Save and exit. This output basically configures Logstash to store the logs data in Elasticsearch which is running at https://eb843037.qb0x.com:30024/, in an index named after the MySQL.
If you have downloaded logstash tar or zip, you can create a logstash.conf file having input, filter and output all in one place.
sudo vi LOGSTASH_HOME/logstash.conf
Insert the following input, filter and output configuration in logstash.conf:
input {

 file {

   path => ["/var/log/mysql/mysql.log", "/var/log/mysql/mysql-slow.log", "/var/log/mysql/mysql_error.log"]

   type => "mysql"

 }

}

filter {

   # Deal with the multi-line MySQL/MariaDB log entries

   if [type] == "mysql" {

       multiline {

           pattern => "^%{NUMBER} *%{NUMBER}"

           negate  => true

           what    => "previous"

       }

       # Strip out MySQLs messy timestamps

       grok {

           match => [ 'message', "(?m)^%{NUMBER:date} *%{NOTSPACE:time} %{GREEDYDATA:message}" ]

           overwrite => [ 'message' ]

           add_field => { "mysql_time" => "%{date} %{time}" }

       }

       # Check if we have a severity field

       if [message] =~ /^\[/ {

           grok {

               match => [ 'message', "(?m)\[%{NOTSPACE:severity}\] %{GREEDYDATA:message}" ]

               overwrite => [ 'message' ]

           }

       }

       # If the message contains WSREP:, it regards the galera cluster

       if  [message] =~ /WSREP:/ {

           mutate {

               replace => [ "type", "Galera" ]

           }

           grok {

               match => [ 'message', "(?m)WSREP: %{GREEDYDATA:message}" ]

               overwrite => [ 'message' ]

           }

       }

   }

}

output {

 elasticsearch {

   hosts => ["https://eb843037.qb0x.com:32563/"]

   user => "ec18487808b6908009d3"

   password => "efcec6a1e0"

   index => "mysql-%{+YYYY.MM.dd}"

   document_type => "mysql_logs"

 }

 stdout { codec => rubydebug }

}
If you want to add filters for other applications that use the MySQL input, be sure to name the files so they sort between the input and the output configuration (i.e. between 02- and 30-).
Test your Logstash configuration with this command:
sudo service logstash configtest
It should display Configuration OK if there are no syntax errors. Otherwise, try and read the error output to see what's wrong with your Logstash configuration.
Restart Logstash, and enable it, to put our configuration changes into effect:
sudo service logstash restart

sudo update-rc.d logstash defaults 96 9
If you have downloaded logstash tar or zip, it can be run using following command
bin/logstash -f logstash.conf
Next, we'll load the sample Kibana dashboards.
Load Kibana Dashboards
When you are finished setting Logstash server to collect logs from client servers, let's look at Kibana, the web interface provisioned by Qbox. Kibana User interface can be used for filtering, sorting, discovering and visualizing logs that are stored in Elasticsearch. Go ahead and click on Visualize data with Kibana from your cluster configuration dashboard.
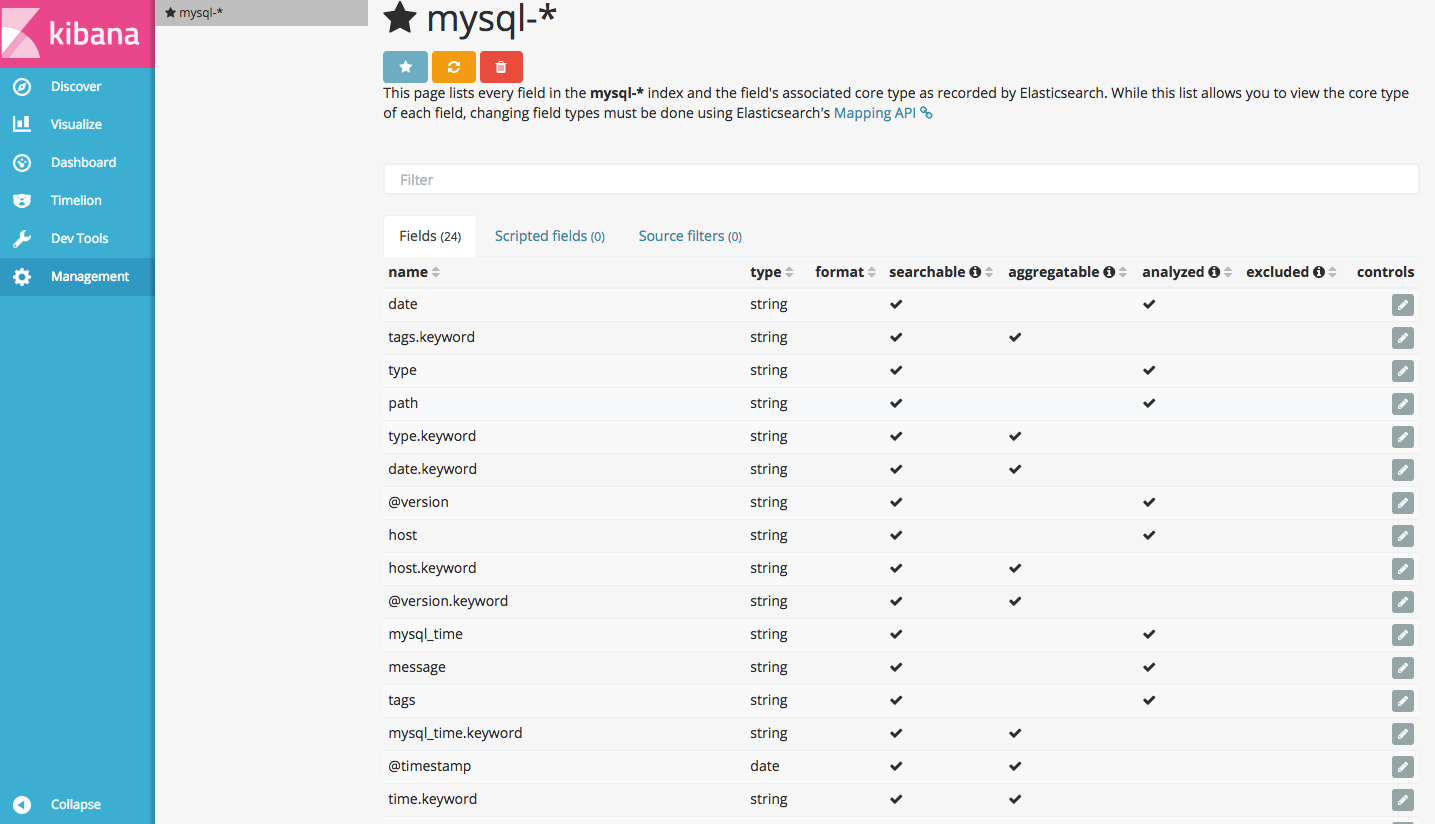
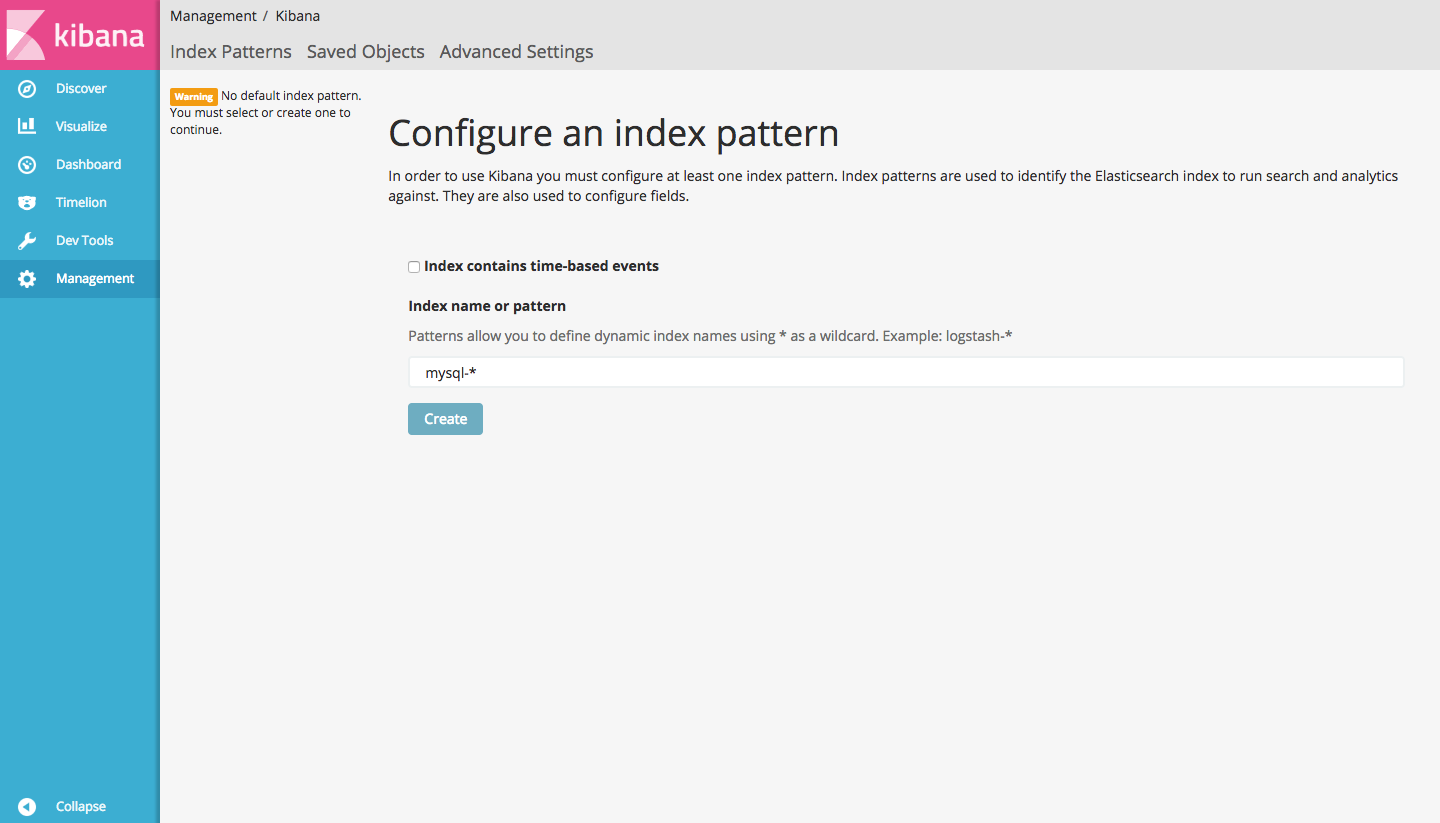
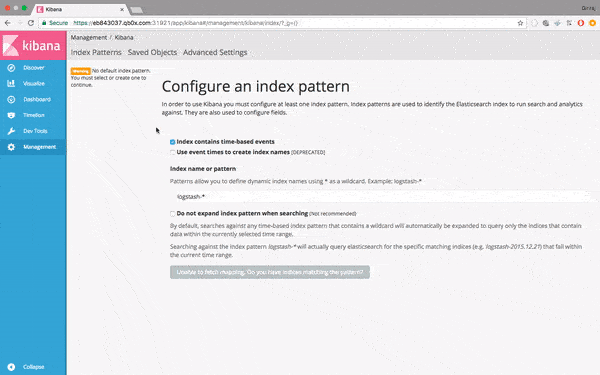
Go ahead and select [mysql]-YYY.MM.DD from the Index Patterns menu (left side), then click the Star (Set as default index) button to set the MySQL index as the default.
Now click the Discover link in the top navigation bar. By default, this will show you all of the log data over the last 15 minutes. You should see a histogram with log events, with log messages below:
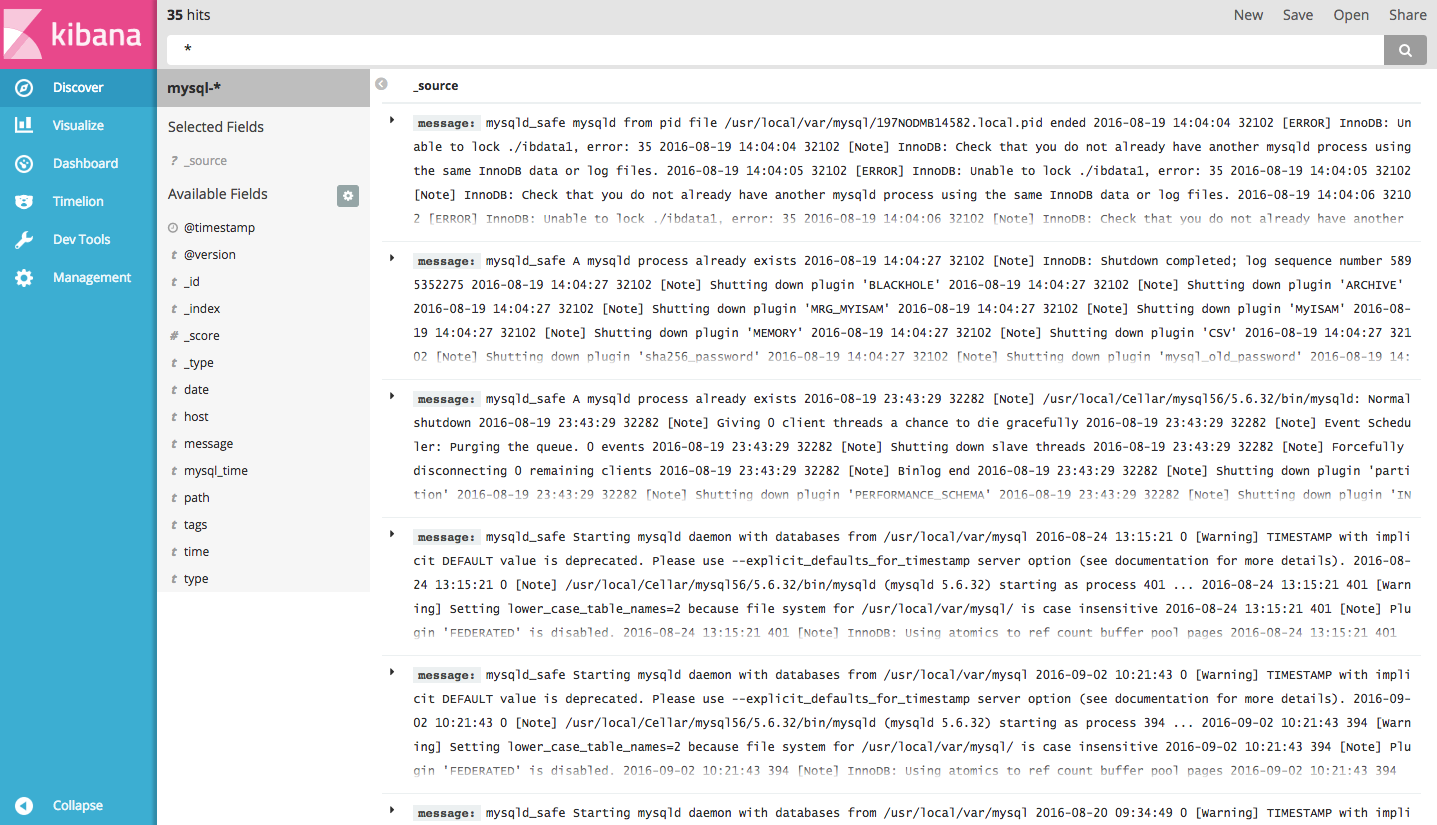
Right now, there won't be much in there because you are only gathering MySQL logs from your client servers. Here, you can search and browse through your logs. You can also customize your dashboard.
Try the following things:
Search for MySQL log file types in Kibana: ‘mysql’, ‘mysql_error’ and ‘mysql_slow_query’.
Search for a particular hostname (search for host: "hostname")
Change the time frame by selecting an area on the histogram or from the menu above
Create visualizations and populate them in specific dashboards.
Once your logs have arrived, you can begin to use Kibana to query Elasticsearch, filter the logs based on your needs, and save your searches to create visualizations.
Conclusion
Analyzing MySQL logs is very critical considering performance of overall application. Queries that take longer to process than a predefined length of time will be logged in the MySQL slow query log. The error log also contains useful information, reporting when MySQL was started or stopped and when critical errors occurred. But as with any type of log data, log analysis and management are tasks that challenge even the most experienced of teams, especially in enterprise production environments that produce log files containing thousands of entries every day.
Qbox provisioned Elasticsearch makes it very easy for us to visualize centralized logs using Logstash and Kibana. Remember that we can send pretty much any type of log or indexed data to Logstash, but the data becomes even more useful if it is parsed and structured with grok.
What do we look for in centralized logging? As it happens, many things, but the most important are as follows.
A way to parse data and send them to a central database in near real-time.
The capacity of the database to handle near real-time data querying and analytics.
A visual representation of the data through filtered tables, dashboards, and so on.
The ELK stack (Elasticsearch, Logstash, and Kibana) can do all that and it can easily be extended to satisfy the particular needs we’ll set in front of us.
Other Helpful Tutorials
- How to Use Elasticsearch, Logstash, and Kibana to Manage Logs
- How to Use Elasticsearch, Logstash, and Kibana to Manage Apache Logs
- How to Use Elasticsearch, Logstash, and Kibana to Manage NGINX Logs
- Getting Started with Elasticsearch on Qbox
- The Authoritative Guide to Elasticsearch Performance Tuning (Part 1)
Give It a Whirl!
It's easy to spin up a standard hosted Elasticsearch cluster on any of our 47 Rackspace, Softlayer, Amazon, or Microsoft Azure data centers. And you can now provision your own AWS Credits on Qbox Private Hosted Elasticsearch.
Questions? Drop us a note, and we'll get you a prompt response.
Not yet enjoying the benefits of a hosted ELK stack enterprise search on Qbox? We invite you to create an account today and discover how easy it is to manage and scale your Elasticsearch environment in our cloud hosting service.
贴下我的配置:
input {

 file {

   path => ["/var/log/mysql/mysql.log", "/var/log/mysql/slow.log"]

   type => "mysql"

   start_position => "beginning"

 }

}

filter {

   if [type] == "mysql" {

       multiline {

           pattern => "^%{NUMBER} *%{NUMBER}"

           negate  => true

           what    => "previous"

       }

       # Strip out MySQLs messy timestamps

       grok {

           match => [ 'message', "(?m)^%{NUMBER:date} *%{NOTSPACE:time} %{GREEDYDATA:message}" ]

           overwrite => [ 'message' ]

           add_field => { "mysql_time" => "%{date} %{time}" }

       }

       # Check if we have a severity field

       if [message] =~ /^\[/ {

           grok {

               match => [ 'message', "(?m)\[%{NOTSPACE:severity}\] %{GREEDYDATA:message}" ]

               overwrite => [ 'message' ]

           }

       }

       # If the message contains WSREP:, it regards the galera cluster

       if  [message] =~ /WSREP:/ {

           mutate {

               replace => [ "type", "Galera" ]

           }

           grok {

               match => [ 'message', "(?m)WSREP: %{GREEDYDATA:message}" ]

               overwrite => [ 'message' ]

           }

       }

   }

}

output {

 elasticsearch {

   hosts => ["10.75.8.167:9200"]

   index => "mysql-%{+YYYY.MM.dd}"

   document_type => "mysql_logs"

 }

 stdout { codec => rubydebug }

}

input {

	file {

 		path => "/var/log/mysql/error.log"

 		type => mysql_error

		 start_position => "beginning"

	}

}

filter {

   if [type] == "mysql_error" {

       grok {

           match => [ 'message', "(?m)^%{NUMBER:date} *%{NOTSPACE:time} %{GREEDYDATA:message}" ]

           overwrite => [ 'message' ]

           add_field => { "mysql_time" => "%{date} %{time}" }

       }

       # Check if we have a severity field

       if [message] =~ /^\[/ {

           grok {

               match => [ 'message', "(?m)\[%{NOTSPACE:severity}\] %{GREEDYDATA:message}" ]

               overwrite => [ 'message' ]

           }

       }

       # If the message contains WSREP:, it regards the galera cluster

       if  [message] =~ /WSREP:/ {

           mutate {

               replace => [ "type", "Galera" ]

           }

           grok {

               match => [ 'message', "(?m)WSREP: %{GREEDYDATA:message}" ]

               overwrite => [ 'message' ]

           }

       }

   }

}

output {

  elasticsearch {

   hosts => ["10.75.8.167:9200"]

   index => "errorsql"

   document_type => "mysql_logs"

 }

 stdout { codec => rubydebug }

}
转自:https://qbox.io/blog/mysql-logs-elasticsearch-logstash-kibana
贴下我的数据库配置:
# For advice on how to change settings please see

# http://dev.mysql.com/doc/refman/5.7/en/server-configuration-defaults.html

[mysqld]

#

# Remove leading # and set to the amount of RAM for the most important data

# cache in MySQL. Start at 70% of total RAM for dedicated server, else 10%.

# innodb_buffer_pool_size = 128M

#

# Remove leading # to turn on a very important data integrity option: logging

# changes to the binary log between backups.

# log_bin

#

# Remove leading # to set options mainly useful for reporting servers.

# The server defaults are faster for transactions and fast SELECTs.

# Adjust sizes as needed, experiment to find the optimal values.

# join_buffer_size = 128M

# sort_buffer_size = 2M

# read_rnd_buffer_size = 2M

datadir=/var/lib/mysql

socket=/var/lib/mysql/mysql.sock

# Disabling symbolic-links is recommended to prevent assorted security risks

symbolic-links=0

#log-error=/var/log/mysqld.log

#log=/var/log/mysql.log

#long_query_time=2

#log-slow-queries=/var/log/slowquery.log

pid-file=/var/run/mysqld/mysqld.pid

log-error=/var/log/mysqld.log

pid-file=/var/run/mysqld/mysqld.pid

general_log = on

general_log_file = /var/log/mysql/mysql.log

general_log= 1

log_error = /var/log/mysql/error.log

log_warnings = 2

sql_mode='NO_ENGINE_SUBSTITUTION'

[client]

socket=/var/lib/mysql/mysql.sock
(转)How to Use Elasticsearch, Logstash, and Kibana to Manage MySQL Logs的更多相关文章
- Manage Spring Boot Logs with Elasticsearch, Logstash and Kibana
下载地址:https://www.elastic.co/downloads When time comes to deploy a new project, one often overlooked ...
- ElasticSearch+Logstash+Filebeat+Kibana集群日志管理分析平台搭建
一.ELK搜索引擎原理介绍 在使用搜索引擎是你可能会觉得很简单方便,只需要在搜索栏输入想要的关键字就能显示出想要的结果.但在这简单的操作背后是搜索引擎复杂的逻辑和许多组件协同工作的结果. 搜索引擎的组 ...
- elasticsearch+logstash+redis+kibana 实时分析nginx日志
1. 部署环境 2. 架构拓扑 3. nginx安装 安装在192.168.176.128服务器上 这里安装就简单粗暴了直接yum安装nginx [root@manager ~]# yum -y in ...
- 利用ansible-playbook一键部署ELK(ElasticSearch,logstash and kibana)
一.部署前环境介绍: es集群5台(es01,es02,es03,es04,es05),logstash服务器1台(logstash2),kibana服务器1台(kibana2),模拟apache服务 ...
- 使用ELK(Elasticsearch + Logstash + Kibana) 搭建日志集中分析平台实践--转载
原文地址:https://wsgzao.github.io/post/elk/ 另外可以参考:https://www.digitalocean.com/community/tutorials/how- ...
- (转)开源分布式搜索平台ELK(Elasticsearch+Logstash+Kibana)入门学习资源索引
Github, Soundcloud, FogCreek, Stackoverflow, Foursquare,等公司通过elasticsearch提供搜索或大规模日志分析可视化等服务.博主近4个月搜 ...
- 开源分布式搜索平台ELK(Elasticsearch+Logstash+Kibana)入门学习资源索引
from: http://www.w3c.com.cn/%E5%BC%80%E6%BA%90%E5%88%86%E5%B8%83%E5%BC%8F%E6%90%9C%E7%B4%A2%E5%B9%B ...
- CentOS 6.x ELK(Elasticsearch+Logstash+Kibana)
CentOS 6.x ELK(Elasticsearch+Logstash+Kibana) 前言 Elasticsearch + Logstash + Kibana(ELK)是一套开源的日志管理方案, ...
- How To Use Logstash and Kibana To Centralize Logs On CentOS 6
原文链接:https://www.digitalocean.com/community/tutorials/how-to-use-logstash-and-kibana-to-centralize-l ...
随机推荐
- SQL-游标-查询数据库中的所有表的数据个数
--sql语句-游标等使用 ) ) declare @i INT ) declare @cstucount INT --上方设置变量 --初始值 declare mCursor cursor --设置 ...
- Python六大开源框架对比:Web2py略胜一筹(转)
Python是一门动态.面向对象语言.其最初就是作为一门面向对象语言设计的,并且在后期又加入了一些更高级的特性.除了语言本身的设计目的之外,Python标准库也是值得大家称赞的,Python甚至还自带 ...
- windows8 Metro App用Javascript来调用C#的library
(转自:http://www.ronaldwidha.net/2012/05/10/winrt-calling-c-csharp-class-libraries-from-winjs-javascri ...
- Android 1.6 PackageManagerService源码分析
文件清单 framework\base\services\core\java\com\android\server\pm\PackageManagerService.java PackageManag ...
- qcow2、raw、vmdk等镜像格式的比较和基本转换
注:本文转自http://www.cnblogs.com/feisky/archive/2012/07/03/2575167.html 云计算用一个朋友的话来说:”做云计算最苦逼的就是得时时刻刻为 ...
- JavaScript通知浏览器,更改通知数目
http://lab.ejci.net/favico.js/ http://www.zhangxinxu.com/study/201607/web-notifications.html http:// ...
- Unity3D笔记 Collect
一.输入轴 默认输入轴: Horizontal 和 Vertical被映射到w, a, s, d键和方向键 Fire1, Fire2, Fire3被分别映射到Ctrl,Option(Alt)和Comm ...
- Spark2 Dataset分析函数--排名函数row_number,rank,dense_rank,percent_rank
select gender, age, row_number() over(partition by gender order by age) as rowNumber, ...
- Mongodb 副本集 数据同步简单测试
副本集的搭建,请见 CENTOS6.5 虚拟机MONGODB创建副本集 接下来将简单说明下副本集之间的数据同步. 1.首先,进入primary节点 MOGO_PATH/bin/mongo -por ...
- postgresql----网络地址类型和函数
本人对网络这块实在是搞不清楚,要是能有人推荐一下资料就好了!不知道有没有跟我一样呢?!所以在这里先贴一点从其他地方搞来的一些IPv4的东东. IPv4主要包括一下5类地址 A类: 0 7位 网络号 2 ...