用Excel创建SQL server性能报告
转载自Kun Lee “Creating SQL Server performance based reports using Excel”
性能测试调优中对数据库的监控十分重要,使用Excel方便地生成report对我们的工作效率提高也很重要。本文用到的Excel数据在另一篇博文“怎样获取Windows平台下SQL server的性能计数器值”里有详细描写。或者进到本文中给出的博客链接“Setting up Performance Monitor to always collect performance statistics”(下一段中),按照文中方法得到。
Problem
In a previous tip, "Setting up Performance Monitor to always collect performance statistics" I wrote about how to collect performance monitor data, but once you have the data then what do you do with it. In this tip I will show you how I use Excel to analyze the data to help determine where your bottlenecks may be and also an easy way to create quick reports and charts for your SQL Servers.
Solution
Before we get started here are a couple of things you will need for this tip.
- Microsoft Excel 2007 - you also can use Excel 2003 or earlier version but for this tip, I used the latest version.
- Perfmon trace files at least one day in "csv" format. - if you have a file in "blg" format, you can easily convert it by using the "relog" tool. When I get a chance, I will write another tip about the relog tool and other tools that work well with Perfmon. To collect data using Perfmon you can review this tip Setting up Performance Monitor to always collect performance statistics.
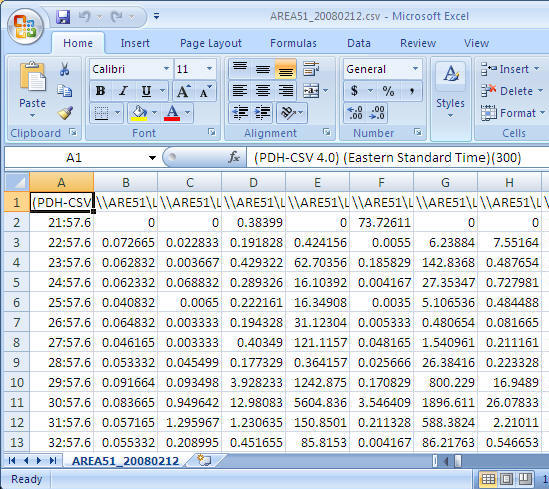
Step 1: Open the csv file
Once you have collected the performance data you can open the csv file using Excel and you should see data similar to the following.
Step 2: Adjust the format
To allow easy reporting of the data there are a few things that I do to adjust the data.
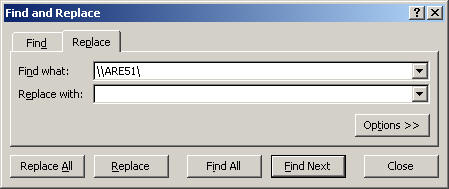
- Replace server name with an empty string - it helps to make reading the counter names easier. In this case I am replacing "\\AREA51\" the name of my server to nothing. (This is optional, but recommended)
- Cell - A1: Replace "(PDH-CSV 4.0) (Eastern Standard Time)(300)" with "Time" (Optional, but recommended)
- Delete the second row - very often, the first data row has bad data
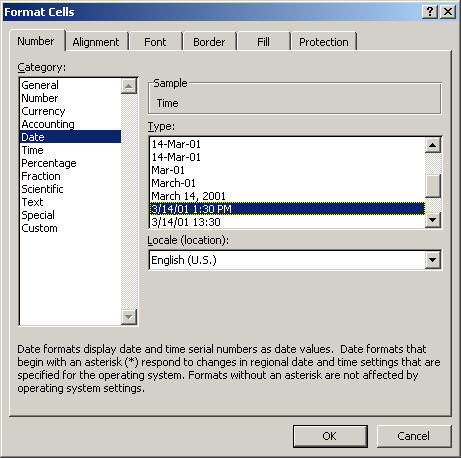
- Change COLUMN A cell format to "date time"
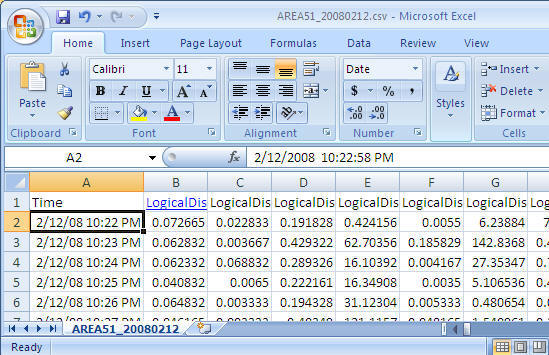
Final look before we start using it the data.
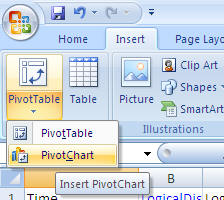
Step 3: Create PivotTable with PivotChart
- From the Insert menu select PivotTable and then select PivotChart as shown below
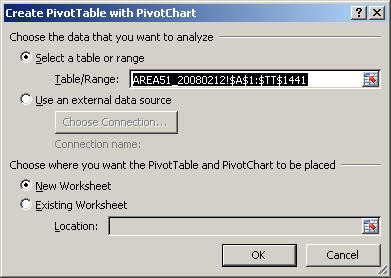
Take the default settings and click "OK"
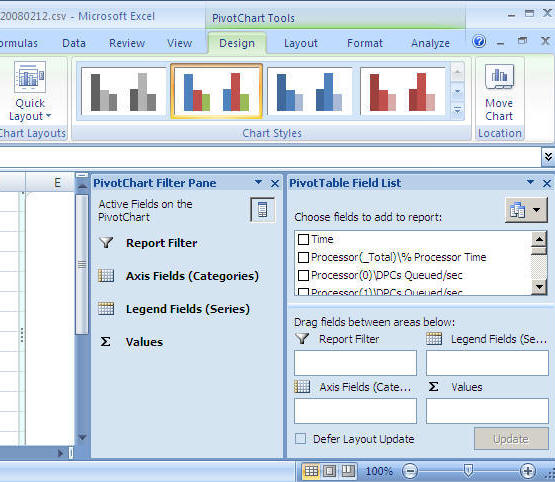
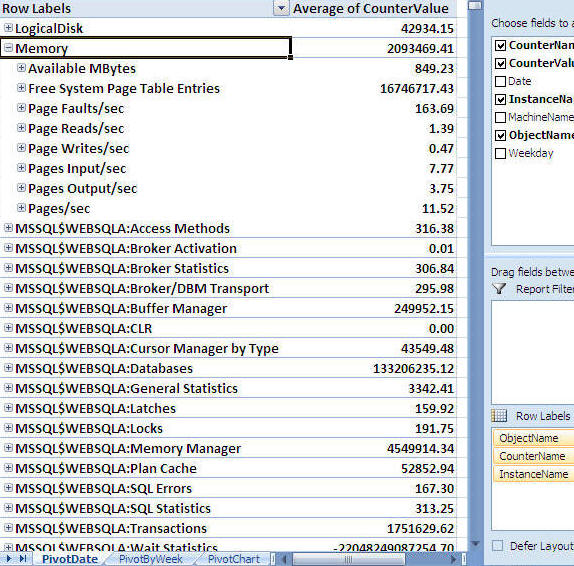
After you select the above you will get a screen similar to the following. (to get a bigger workspace area you can close the "PivotChart Filter Pane")
Step 4: Let's generate our first graph
For this example we will look at CPU
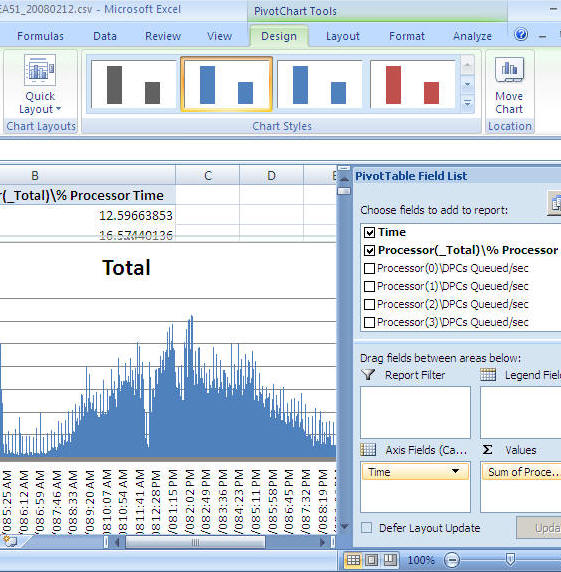
- From the "PivotTable Field List" select "Time" and drag it into the "Axis Fields (Categories)" area
- From the "PivotTable Field List" select "Process(_Total)\% Process Time" and drag it into the "Values" area
- At this point you will have a graph similar to the one shown below
You can now just select the chart and copy and paste it into a report, an email, Word document etc... as shown below
If you want to change it from processor time to batch requests you can remove "Process(_Total)\% Process Time" and select "SQLServer:SQL Statistics\Batch Requests/sec" and you will get a chart like below
Next Steps
- There are many ways to extend this reporting to make it more useful for both short term and long term needs. In order to do that, it is easier to load the Perfmon data into SQL Server and use the power of SQL Server along with Excel to generate the reports.
- By using the "relog" tool, you can load the Perfmon data directly into SQL Server
- By using the "logman" tool, you can setup Perfmon to store the performance data directly to SQL Server
- To get you started you can download a sample CSV file here with a lot of performance counters
- Here are a few more examples of reports and charts you can create
Sample 1
Sample 2
Sample 3
用Excel创建SQL server性能报告的更多相关文章
- SQL Server Profiler监控SQL Server性能
全面掌握SQL Server Profiler 1. 原理与相关概念介绍 SQL Server Profiler,大家已经非常熟悉.常常在性能优化中使用,本文档详细介绍SQL Server ...
- SQL Server 性能优化详解
故事开篇:你和你的团队经过不懈努力,终于使网站成功上线,刚开始时,注册用户较少,网站性能表现不错,但随着注册用户的增多,访问速度开始变慢,一些用户开始发来邮件表示抗议,事情变得越来越糟,为了留住用户, ...
- SQL Server 性能优化之RML Utilities:快速入门(Quick Start)(1)
SQL Server 性能优化之RML Utilities:快速入门(Quick Start)(1) 安装Quick Start工具 RML(Replay Markup Language)是MS ...
- SQL Server 性能优化之——系统化方法提高性能
SQL Server 性能优化之——系统化方法提高性能 阅读导航 1. 概述 2. 规范逻辑数据库设计 3. 使用高效索引设计 4. 使用高效的查询设计 5. 使用技术分析低性能 6. 总结 1. 概 ...
- 影响Sql server性能的因素
目前本人在看<SQL Server性能调优实战> ,以下内容是本人看书笔记 数据库性能取决于各方面综合因素: 硬件,操作系统,软件 硬件:内存,CPU,磁盘 当服务器的物理内存不足时,会产 ...
- sql server 性能调优之 资源等待PAGELATCH
一.概述 在前几章介绍过 sql server 性能调优资源等待之PAGEIOLATCH,PAGEIOLATCH是出现在sql server要和磁盘作交互的时候,所以加个IO两个字.这次来介绍PAGE ...
- sql server 性能调优之 CPU消耗最大资源分析1 (自sqlserver服务启动以后)
一. 概述 上次在介绍性能调优中讲到了I/O的开销查看及维护,这次介绍CPU的开销及维护, 在调优方面是可以从多个维度去发现问题如I/O,CPU, 内存,锁等,不管从哪个维度去解决,都能达到调优的效 ...
- [转]SQL Server 性能调优(io)
目录 诊断磁盘io问题 常见的磁盘问题 容量替代了性能 负载隔离配置有问题 分区对齐配置有问题 总结 关于io这一块,前面的东西如磁盘大小,磁盘带宽,随机读取写入,顺序读取写入,raid选择,DA ...
- CPU开销sql server 性能调优
sql server 性能调优 CPU开销分析 一. 概述 上次在介绍性能调优中讲到了I/O的开销查看及维护,这次介绍CPU的开销及维护, 在调优方面是可以从多个维度去发现问题如I/O,CPU, 内存 ...
随机推荐
- jdbc向各种数据库发送sql语句
1.有了JDBC,向各种关系数据发送SQL语句就是一件很容易的事.换言之,有了JDBC API,就不必为访问Sybase数据库专门写一个程序,为访问Oracle数据库又专门写一个程序,或为访问Info ...
- fenye
<div class="ptb20 navpages"> <span class=" ">共有<span class=" ...
- Alamofire 的使用
最近,AFNetworking 的作者Mattt Thompson提交了一个新的类似于 AFNetworking 的网络 基础库,并且是专门使用最新的 Swift 语言来编写的,名为:Alamofir ...
- 使用Qt5.7.0 VS2015版本生成兼容XP的可执行程序 good(从VS2012 update1开始支持xp和c++11)
一.直接使用VS2012/VS2013/VS2015生成XP兼容的可执行程序 Visual Studio刚发布时没打补丁,称为RTM版,之后会陆续发布补丁,进行bug修复和功能增强.VS2010及之前 ...
- http获取图片信息
一.安卓访问网络需要AndroidManifest.xml配置这样一个节点 <manifest> <uses-permission android:name="androi ...
- 采用阿里的API进行动态域名解析
#!/usr/bin/env python # -*- coding:utf-8 -*- import os from aliyunsdkcore import client from aliyuns ...
- 一个简单的js实现倒计时函数
<!DOCTYPE html PUBLIC "-//W3C//DTD XHTML 1.0 Transitional//EN" "http://www.w3.org/ ...
- cordova IOS源码浅析
cordova封装了一套js和OC通信的代码,cordova.js下的iOSExex是关键的js去调原生的发起点. function iOSExec() { var successCallback, ...
- WPF 仪表盘 刻度盘 动态 加载中 开源
1. 表盘 参数可以设置, codeproject上写的.网址在这里. 源码里有demo,很详细. 源码在这里. 2. 动态Loading 截图效果跟实际有点不一样. 自己把源码写成 资源就好用了呗 ...
- python Gunicorn
1. 简介 Gunicorn(Green Unicorn)是给Unix用的WSGI HTTP 服务器,它与不同的web框架是非常兼容的.易安装.轻.速度快. 2. 示例代码1 def app(envi ...