python-matplotlib-lec0
直奔主题吧。。以下是对matplotlib画图的简单讲解,代码已测试。
win7 + pycharm + python 2.7
参考文档:
http://old.sebug.net/paper/books/scipydoc/matplotlib_intro.html
捷径:查看gallery,寻找要画的图,copy代码,修改,done
http://matplotlib.org/gallery.html
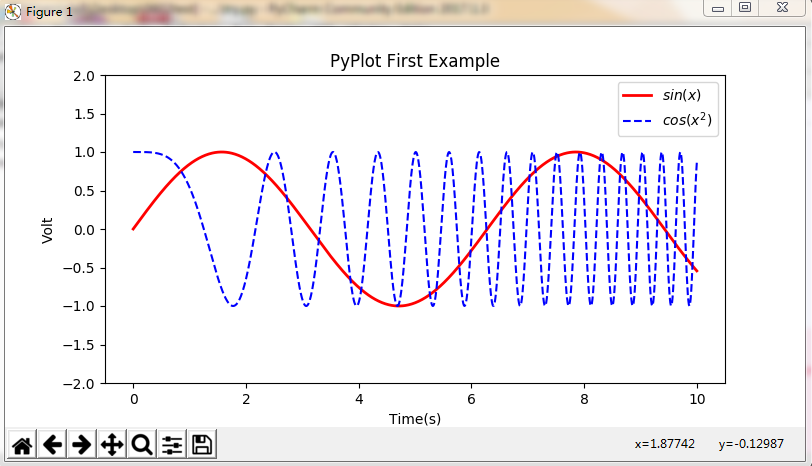
# -*- coding: utf-8 -*-

import numpy as np

import matplotlib.pyplot as plt

x = np.linspace(0, 10, 1000)

y = np.sin(x)

z = np.cos(x**2)

# figsize:单位为英寸 dpi:指定绘图对象的分辨率,default is 80.

# 宽度现在为8*80=640

# 但是用工具栏中的保存按钮保存下来的png图像的大小是800*400像素。

plt.figure(figsize=(8,4))

# latex inserted, use it directly.

plt.plot(x,y,label="$sin(x)$",color="red",linewidth=2)

# "b--":formated string, blue and dashed line

plt.plot(x,z,"b--",label="$cos(x^2)$")

plt.xlabel("Time(s)")

plt.ylabel("Volt")

plt.title("PyPlot First Example")

plt.ylim(-2, 2)

plt.legend()

plt.show()

# figure(i) means draw ith figure. If i exists, it will not create new figure object,

# but make it as current figure object

plt.figure(1)

plt.plot(x,y,label="$sin(x)$",color="red",linewidth=2)

plt.show()

plt.figure(2)

plt.plot(x,z,"b--",label="$cos(x^2)$")

plt.show()
python-matplotlib-lec0的更多相关文章
- python matplotlib 中文显示参数设置
python matplotlib 中文显示参数设置 方法一:每次编写代码时进行参数设置 #coding:utf-8import matplotlib.pyplot as pltplt.rcParam ...
- python matplotlib plot 数据中的中文无法正常显示的解决办法
转发自:http://blog.csdn.net/laoyaotask/article/details/22117745?utm_source=tuicool python matplotlib pl ...
- python matplotlib画图产生的Type 3 fonts字体没有嵌入问题
ScholarOne's 对python matplotlib画图产生的Type 3 fonts字体不兼容,更改措施: 在程序中添加如下语句 import matplotlib matplotlib. ...
- 使用Python matplotlib做动态曲线
今天看到“Python实时监控CPU使用率”的教程: https://www.w3cschool.cn/python3/python3-ja3d2z2g.html 自己也学习如何使用Python ma ...
- python matplotlib 中文显示乱码设置
python matplotlib 中文显示乱码设置 原因:是matplotlib库中没有中文字体.1 解决方案:1.进入C:\Anaconda64\Lib\site-packages\matplot ...
- Python - matplotlib 数据可视化
在许多实际问题中,经常要对给出的数据进行可视化,便于观察. 今天专门针对Python中的数据可视化模块--matplotlib这块内容系统的整理,方便查找使用. 本文来自于对<利用python进 ...
- 转:使用 python Matplotlib 库 绘图 及 相关问题
使用 python Matplotlib 库绘图 转:http://blog.csdn.net/daniel_ustc/article/details/9714163 Matplotlib ...
- python+matplotlib 绘制等高线
python+matplotlib 绘制等高线 步骤有七: 有一个m*n维的矩阵(data),其元素的值代表高度 构造两个向量:x(1*n)和y(1*m).这两个向量用来构造网格坐标矩阵(网格坐标矩阵 ...
- 安装python Matplotlib 库
转:使用 python Matplotlib 库 绘图 及 相关问题 使用 python Matplotlib 库绘图 转:http://blog.csdn.net/daniel_ustc ...
- python matplotlib.pyplot 散点图详解(1)
python matplotlib.pyplot散点图详解(1) 一.创建散点图 可以用scatter函数创建散点图 并使用show函数显示散点图 代码如下: import matplotlib.py ...
随机推荐
- .Net Core 做请求监控NLog
使用 NLog 给 Asp.Net Core 做请求监控 https://www.cnblogs.com/cheesebar/p/9078207.html 为了减少由于单个请求挂掉而拖垮整站的情况发生 ...
- Nuxt使用记录
代码及插件需要根据环境引入 (服务端没有window,document,浏览器端没有global) const myPlugins = { install(Vue, options) { Vue.pr ...
- MariaDB 实现主从复制
實驗目的: MariaDB為MySQL的一個分支,其完全開源.無版權之虞且操作上與 MySQL 一脈相承,實際應用中非常廣泛,軟件本身很小,安裝容易,使用簡單. 但其也有缺點,指令行方式操作,無原生G ...
- Java_面向对象的 static 和 abstract
static:表示静态的 static:可以用来修饰属性.方法.代码块(或初始化块).内部类. 一.static修饰属性(类变量): public class TestStatic { //stati ...
- 零基础逆向工程14_C语言08_指针02_反汇编
1.指针数组 5: char* keyword[] = {"if", "for", "while", "switch"} ...
- Jquery 日期差函数 修改 对火狐进行兼容
function DateDiff(sDate1, sDate2) { //sDate1和sDate2是yyyy-MM-dd格式 var aDate, oDate1, oDate2, iDays; a ...
- Selenium3+webdriver学习笔记2(常用元素定位方式,定位单个元素共8种,总共有23种)
#!/usr/bin/env python# -*- coding:utf-8 -*- from selenium import webdriver import time,os # about:ad ...
- POJ 3260 The Fewest Coins 最少硬币个数(完全背包+多重背包,混合型)
题意:FJ身上有各种硬币,但是要买m元的东西,想用最少的硬币个数去买,且找回的硬币数量也是最少(老板会按照最少的量自动找钱),即掏出的硬币和收到的硬币个数最少. 思路:老板会自动找钱,且按最少的找,硬 ...
- HDU 5452 Minimum Cut (Spaning Tree)
生成树的上的一个非根结点对应一条生成树上的边,然后这个结点的子树上连出去的边就对应去掉这条边的割, 然后就可以对树外的边求LCA,在LCA上标记,利用这个信息可以算出有多少条边在子树上,以及有多少条边 ...
- 最全面的 python 字符串拼接总结(带注释版)
在 Python 中字符串连接有多种方式,这里简单做个总结,应该是比较全面的了,方便以后查阅. 加号连接 第一种,通过+号的形式: >>> a, b = 'hello', ' wor ...