google perftools分析程序性能
Google perftools
1、功能简介
它的主要功能就是通过采样的方式,给程序中cpu的使用情况进行“画像”,通过它所输出的结果,我们可以对程序中各个函数(得到函数之间的调用关系)耗时情况一目了然。在对程序做性能优化的时候,这个是很重要的,先把最耗时的若干个操作优化好,程序的整体性能提升应该十分明显,这也是做性能优化的一个最为基本的原则—先优化最耗时的。
2、安装
1、下载gperftools
Wget https://code.google.com/p/gperftools/downloads/detail?name=gperftools-2.0.tar.gz
2、tar –xzf gperftools-2.0.tar.gz
3、cd gperftools-2.0
4、./configure --prefix=/usr/local –enable-frame-pointers
5、make && make install
ps:编译时打开了 –enable-frame-pointers ,这要求被测试的程序在编译时要加上gcc编译选项,否则某些多线程程序可能会 core:
CCFLAGS=-fno-omit-frame-pointer
ps:perftools对2.4内核的多线程支持不是很好,只能分析主线程,但是2.6内核解决了这个问题。
安装图形化分析工具kcachegrind:
kcachegrind用来分析产生的profiling文件,linux环境下使用。
kcachegrind install:sudo apt-get install kcachegrind
3、使用
方法有三种:
1、直接调用提供的api:这种方式比较适用于对于程序的某个局部来做分析的情况,直接在要做分析的局部调用相关的api即可。
方式:调用函数:ProfilerStart() and ProfilerStop()
2、链接静态库:这种方式是最为常用的方式,后面会有详细的介绍。
方式:在代码link过程中添加参数 –lprofiler
For example:gcc […] -o helloworld –lprofiler
运行程序:env CPUPROFILE=./helloworld.prof ./helloworld
指定要profile的程序为helloworld,并且指定产生的分析结果文件的路径为./helloworld.prof
3、链接动态库:这种方式和静态库的方式差不多,但通常不推荐使用,除非使用者不想额外链一个静态库(因为链接静态库会增大binary的大小)的情况,可以考虑使用这种方式。
方式:运行时使用LD_PRELOAD,e.g. % env LD_PRELOAD="/usr/lib/libprofiler.so" <binary>(不推荐这种方式)。
Ps:env是linux下插入环境变量的shell命令
4、 查看收集数据结果
查看profile结果:pprof工具,它是一个perl的脚本,通过这个工具,可以将google-perftool的输出结果分析得更为直观,输出为图片、pdf等格式。
Ps:在使用pprof之前需要先安装运行per15,如果要进行图标输出则需要安装dot,如果需要--gv模式的输出则需要安装gv。
调用pprof分析数据文件:
% pprof /bin/ls ls.prof
Enters "interactive" mode
% pprof --text /bin/ls ls.prof
Outputs one line per procedure
% pprof --gv /bin/ls ls.prof
Displays annotated call-graph via 'gv'
% pprof --gv --focus=Mutex /bin/ls ls.prof
Restricts to code paths including a .*Mutex.* entry
% pprof --gv --focus=Mutex --ignore=string /bin/ls ls.prof
Code paths including Mutex but not string
% pprof --list=getdir /bin/ls ls.prof
(Per-line) annotated source listing for getdir()
% pprof --disasm=getdir /bin/ls ls.prof
(Per-PC) annotated disassembly for getdir()
% pprof --text localhost:1234
Outputs one line per procedure for localhost:1234
% pprof --callgrind /bin/ls ls.prof
Outputs the call information in callgrind format
分析callgrind的输出:
使用kcachegrind工具来对.callgrind输出进行分析
e.g. % pprof --callgrind /bin/ls ls.prof > ls.callgrind
% kcachegrind ls.callgrind
4、举例
事例一:cpu_profiler_example.cpp,在代码中插入标签,可以针对某个函数进行特定的profile
代码如下:

关注两个函数:ProfilerStart() and ProfilerStop()
Makefile:
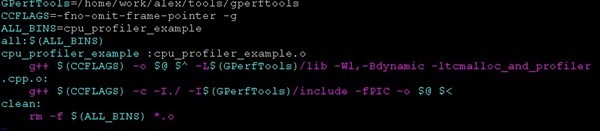
-L 动态链接库地址,但是有可能程序执行的时候,找不到动态链接库,所以得
export LD_LIBRARY_PATH=LD_LIBRARY_PATH:"/home/work/alex/tools/gperftools/lib"
1)执行./cpu_profile_example

生成一个性能数据文件: cpu_profiler_example_29502.prof
Ps:当然指定性能数据文件生成的路径和文件名:
CPUPROFILE=/tmp/profile ./myprogram
将在/tmp目录下产生profile性能数据文件
2)分析性能数据
pprof -text cpu_profiler_example cpu_profiler_example_3875.prof

Text输出结果分析:
14 2.1% 17.2% 58 8.7% std::_Rb_tree::find
含义如下:
14:find函数花费了14个profiling samples
2.1%:find函数花费的profiling samples占总的profiling samples的比例
17.2%:到find函数为止,已经运行的函数占总的profiling samples的比例
58:find函数加上find函数里的被调用者总共花费的profiling samples
8.7%:find函数加上find函数里的被调用者总共花费的profiling samples占总的profiling samples的比例
std::_Rb_tree::find:表示profile的函数
ps: 100 samples a second,所以得出的结果除以100,得秒单位
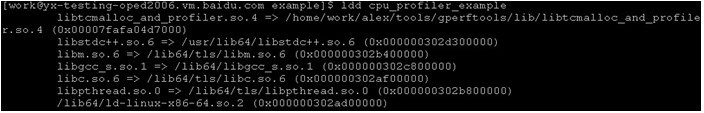
Ldd可以查看一个程序要链接那些动态库:
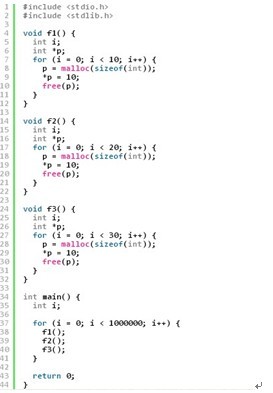
事例二:cpu_profiler_example.cpp,不需要在代码里添加任何标签,将profile所有的函数。
代码如下:

Makefile:

1)执行程序,生成性能数据文件
CPUPROFILE=/tmp/profile ./cpu_profiler_example
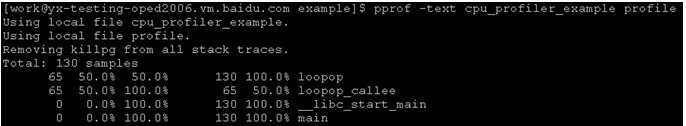
2)分析数据文件
1)pprof -text cpu_profiler_example profile
2)命令行交互模式

事例三:由于我们的程序有可能是服务程序,而服务程序不会自动执行完退出,如果以ctrl+c退出也不是正常的exit(0)的方式退出,而这会导致我们在profile的时候,收集到的数据不全甚至是空的,采用如下解决办法:
将ProfilerStart和ProfilerStop这2个函数封装到两个信号处理函数中,给服务程序发信号SIGUSR1,就开始profile,给服务程序发信号SIGUSR2,就停止profile。这样我们可以随时对程序进行profiling,并获得数据。
代码如下:

 1 #include <stdio.h>

 2 #include <sys/types.h>

 3 #include <unistd.h>

 4 #include <signal.h>

 5 #include <google/profiler.h>

 6

 7 //SIGUSR1: start profiling

 8 //SIGUSR2: stop profiling

 9

10 static void gprof_callback(int signum)

11 {

12     if (signum == SIGUSR1)

13     {

14         printf("Catch the signal ProfilerStart\n");

15         ProfilerStart("bs.prof");

16     }

17     else if (signum == SIGUSR2)

18     {

19         printf("Catch the signal ProfilerStop\n");

20         ProfilerStop();

21     }

22 }

23

24 static void setup_signal()

25 {

26     struct sigaction profstat;

27     profstat.sa_handler = gprof_callback;

28     profstat.sa_flags = 0;

29     sigemptyset(&profstat.sa_mask);

30     sigaddset(&profstat.sa_mask, SIGUSR1);

31     sigaddset(&profstat.sa_mask, SIGUSR2);

32

33     if ( sigaction(SIGUSR1, &profstat,NULL) < 0 )

34     {

35         fprintf(stderr, "Fail to connect signal SIGUSR1 with start profiling");

36     }

37     if ( sigaction(SIGUSR2, &profstat,NULL) < 0 )

38     {

39         fprintf(stderr, "Fail to connect signal SIGUSR2 with stop profiling");

40     }

41 }

42

43 int loopop_callee()

44 {

45     int n=0;

46     for(int i=0; i<10000; i++)

47     {

48         for(int j=0; j<10000; j++)

49         {

50              n |= i%100 + j/100;

51         }

52     }

53     return n;

54 }

55

56 int loopop()

57 {

58     int n=0;

59     while(1)

60     {

61         for(int i=0; i<10000; i++)

62         {

63             for(int j=0; j<10000; j++)

64             {

65                 n |= i%100 + j/100;

66             }

67         }

68         printf("result:  %d\n", (loopop_callee)() );

69     }

70     return n;

71 }

72

73 int main(int argc,char** argv)

74 {

75     char program[1024]={0};

76     //snprintf(program,1023,"%s_%d.prof",argv[0],getpid());

77     setup_signal();

78     printf("result:  %d\n", (loopop)() );

79     return 0;

80 }
关注两个函数gprof_callback和setup_signal。
启动程序,可以采用kill -s SIGUSR1 5722和kill -s SIGUSR2 5722来开始采集和停止采集,5722是进程pid。
5、心得
最后,补充一点,要用google-perftool来分析程序,必须保证程序能正常退出。
采用kcachegrind查看函数之间依赖,并分析程序性能

google perftools分析程序性能的更多相关文章
- python cProfile分析程序性能
转自:http://xianglong.me/article/analysis-python-application-performance-using-cProfile/?utm_source=tu ...
- cProfile分析程序性能
Python标准库中提供了三种用来分析程序性能的模块,分别是cProfile, profile和hotshot,另外还有一个辅助模块stats.这些模块提供了对Python程序的确定性分析功能,同时也 ...
- perf + Flame Graph火焰图分析程序性能
1.perf命令简要介绍 性能调优时,我们通常需要分析查找到程序百分比高的热点代码片段,这便需要使用 perf record 记录单个函数级别的统计信息,并使用 perf report 来显示统计结果 ...
- [转]perf + 火焰图分析程序性能
1.perf命令简要介绍 性能调优时,我们通常需要分析查找到程序百分比高的热点代码片段,这便需要使用 perf record 记录单个函数级别的统计信息,并使用 perf report 来显示统计结果 ...
- perf + 火焰图分析程序性能
1.perf命令简要介绍 性能调优时,我们通常需要分析查找到程序百分比高的热点代码片段,这便需要使用 perf record 记录单个函数级别的统计信息,并使用 perf report 来显示统计结果 ...
- 使用strace+pstack利器分析程序性能
引言 有时我们需要对程序进行优化.减少程序响应时间.除了一段段地对代码进行时间复杂度分析,我们还有更便捷的方法吗? 若能直接找到影响程序运行时间的函数调用,再有针对地对相关函数进行代码分析和优化,那相 ...
- 利用vs自带工具分析程序性能
测试程序写好后可以通过VS2010分析菜单里选择启用性能向导 选择CPU采样后就选择需要分析的项目 测试项目选择完成后就可以运行分析,结束分析后VS2010会提供个详细报告文档 从分析结果来看GetC ...
- 【初体验】valgrind分析程序性能
wget https://fossies.org/linux/misc/valgrind-3.15.0.tar.bz2 tar -jxvf valgrind-3.15.0.tar.bz2 cd val ...
- 如何使用strace+pstack利器分析程序性能
http://www.cnblogs.com/bangerlee/archive/2012/04/30/2476190.html
随机推荐
- [转贴]使用CryptoAPI解析X509证书和P12证书
原文在 http://bbs.pediy.com/archive/index.php?t-97663.html,但是觉得这篇文章非常好,我抄下来作我笔记用 一.解析X509证书 1.从磁盘上的证书文件 ...
- Rails3.2.3+ruby1.9.3 环境搭建,提示安全警告
错误描述: 照着教程搭建了Rails的环境,能够正常运行,但是会但一个警告,如下: SECURITY WARNING: No secret option provided to Rack::Sessi ...
- C# zip压缩
/**//* * Gary Zhang -- cbcye@live.com * www.cbcye.com * www.quicklearn.cn * cbcye.cnblogs.com */ usi ...
- find 日常使用
find 查找文件 fidn 目录 参数 find ~ -type f find /log -name "root.log" find . -type f -exec ls -l ...
- Centos4.3安装MySQL-python-1.2.3,出现error: command 'gcc' failed with exit status 1
在Linux Centos 4.3上安装MySQL-python-1.2.3的时候出现error: command 'gcc' failed with exit status 1, 具体原因是因为没有 ...
- struts2加入自定义的actionValidatorManager实现类
<constant name="struts.actionValidatorManager" value="bap"/>
- 数据库 一致性读&&当前读
今天小伙伴问了一个sql的问题: update t set status=2 where id in(select id from t where status=1) 这个sql,在并发的情况下,会不 ...
- Matlab工具箱安装体会
总结有两点: 1.如需添加jar包等附加库,可在待安装工具箱下,新建一个java文件夹,并将jar包等文件存放在里面,然后执行以下操作: 1)Create or open your preferenc ...
- JAVA与.NET的相互调用——通过Web服务实现相互调用
JAVA与.NET是现今世界竞争激烈的两大开发媒体,两者语言有很多相似的地方.而在很多大型的开发项目里面,往往需要使用两种语言进行集成开发.而很多的开发人员都会偏向于其中一种语言,在使用集成开发的时候 ...
- Eclipse工具使用技巧总结
首先推荐一篇非常好的How to use eclipse文章 ,讲的是eclipse使用的方方面面,非常实用,推荐给大家! 一.常用快捷键:Ctrl+F11 运行Ctrl+Shift+/ 在代码窗口中 ...