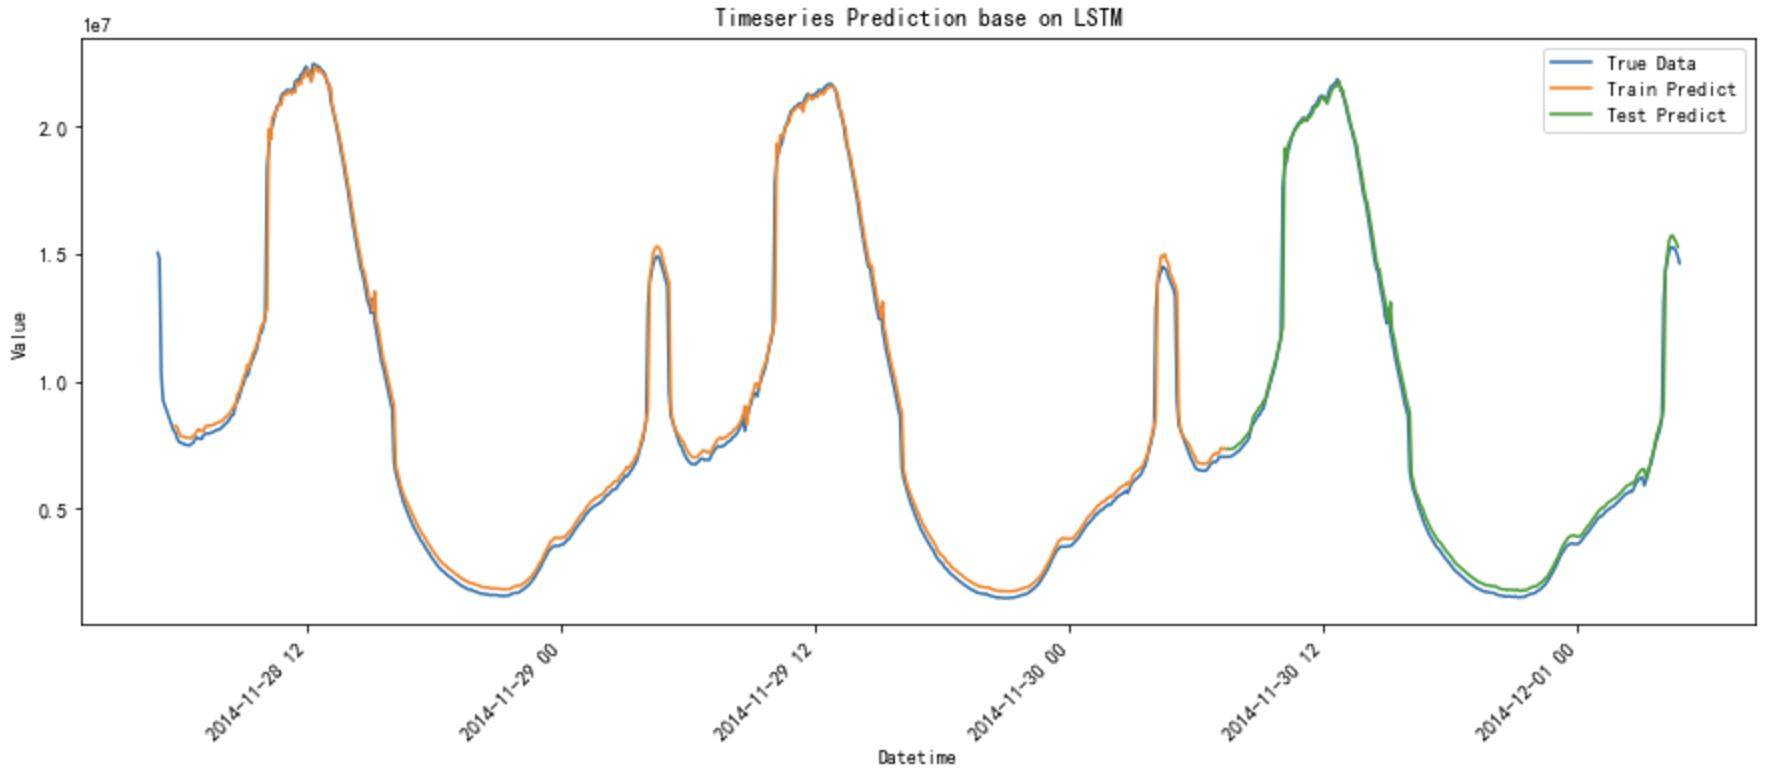
Timeseries Prediction Demo base on LSTM
示例代码
import json

import time

import datetime

import requests as req

import numpy as np

import pandas as pd

import matplotlib.pyplot as plt

import matplotlib.dates as mdates

from sklearn.preprocessing import MinMaxScaler

from tensorflow.keras.models import Sequential

from tensorflow.keras.layers import LSTM, Dense

def date2ts(date_str, layout="%Y-%m-%d %H:%M:%S"):

    date_struct=time.strptime(date_str, layout)

    return int(time.mktime(date_struct))

# 画图之前转换成北京时间

def to_beijing_time(datetime_index):

    return datetime_index.tz_localize('UTC').tz_convert('Asia/Shanghai')

# 载入原始数据

with open("dataset_2014.json", "r") as rf:

    c = rf.read()

d = json.loads(c)

data = {}

for i in range(288*3):

    ts = date2ts(d['data']['datetime'][i])

    data[ts] = d['data']['count'][i]

# 将字典转换为 DataFrame

df = pd.DataFrame(list(data.items()), columns=['timestamp', 'value'])

df['datetime'] = pd.to_datetime(df['timestamp'], unit='s')

df.set_index('datetime', inplace=True)

df.drop('timestamp', axis=1, inplace=True)

# 确保数据按时间顺序排序

df = df.sort_index()

# 重新采样为 5 分钟间隔,填充缺失值

df = df.resample('5T').mean()

df.interpolate(method='linear', inplace=True)

# 数据标准化

scaler = MinMaxScaler(feature_range=(0, 1))

df_scaled = scaler.fit_transform(df)

print("Original Data:\n", df)

print("Scaled Data:\n", df_scaled)

# 创建数据集函数

def create_dataset(data, time_step=1):

    X, y = [], []

    for i in range(len(data) - time_step - 1):

        X.append(data[i:(i + time_step), 0])

        y.append(data[i + time_step, 0])

    return np.array(X), np.array(y)

time_step = 10  # 设定用于输入的时间步长

X, y = create_dataset(df_scaled, time_step)

# 拆分训练和测试数据集

train_size = int(len(X) * 0.7)

test_size = len(X) - train_size

X_train, X_test = X[:train_size], X[train_size:]

y_train, y_test = y[:train_size], y[train_size:]

# 转换为 LSTM 输入格式

X_train = X_train.reshape(X_train.shape[0], X_train.shape[1], 1)

X_test = X_test.reshape(X_test.shape[0], X_test.shape[1], 1)

# 构建 LSTM 模型

model = Sequential()

model.add(LSTM(50, return_sequences=True, input_shape=(time_step, 1)))

model.add(LSTM(50, return_sequences=False))

model.add(Dense(25))

model.add(Dense(1))

model.compile(optimizer='adam', loss='mean_squared_error')

model.fit(X_train, y_train, batch_size=1, epochs=10)

# 预测

train_predict = model.predict(X_train)

test_predict = model.predict(X_test)

# 反标准化预测结果

train_predict = scaler.inverse_transform(train_predict)

test_predict = scaler.inverse_transform(test_predict)

# 反标准化实际值

df_inv_scaled = scaler.inverse_transform(df_scaled)

# print("Inverse Scaled Data:\n", df_inv_scaled)

# 创建用于绘制图像的空数组

train_predict_plot = np.empty_like(df_scaled)

train_predict_plot[:, :] = np.nan

train_predict_plot[time_step:len(train_predict) + time_step, :] = train_predict

# 计算测试预测结果的起始和结束点

start_point = len(train_predict) + time_step  # 设定起始点位置

end_point = start_point + len(test_predict)

test_predict_plot = np.empty_like(df_scaled)

test_predict_plot[:, :] = np.nan

test_predict_plot[start_point:end_point, :] = test_predict[:df_scaled.shape[0] - start_point, :]  # 放置到合适位置

# 将时间戳转换回原始时间格式

original = df.index

original_beijing = to_beijing_time(original)

# 创建 figure 绘图

plt.figure(figsize=(15, 6))

plt.title("Timeseries Prediction base on LSTM")

plt.plot(original_beijing, df_inv_scaled, label='True Data')  # 确保这里使用适当逆标准化数据

plt.plot(original_beijing, train_predict_plot, label='Train Predict')

plt.plot(original_beijing, test_predict_plot, label='Test Predict')

# 格式化 X 轴,提高可读性

plt.gca().xaxis.set_major_locator(mdates.HourLocator(interval=12))

plt.gca().xaxis.set_major_formatter(mdates.DateFormatter('%Y-%m-%d %H:%M', tz=original_beijing.tz))

plt.gcf().autofmt_xdate(rotation=45)

plt.xlabel('Datetime')

plt.ylabel('Value')

plt.legend()

plt.show()

# # 提取最后3天的数据

# last_three_days_mask = original >= (original.max() - pd.Timedelta(days=3))

# filtered_original = original[last_three_days_mask]

# filtered_df_inv_scaled = df_inv_scaled[last_three_days_mask]

# filtered_train_predict_plot = train_predict_plot[last_three_days_mask]

# filtered_test_predict_plot = test_predict_plot[last_three_days_mask]

# # 转换时间为北京时间

# filtered_original_beijing = to_beijing_time(filtered_original)

# plt.figure(figsize=(15, 6))

# plt.title("Timeseries Prediction base on LSTM (last 3 days)")

# plt.plot(filtered_original_beijing, filtered_df_inv_scaled, label='True Data')  # 确保这里使用适当逆标准化数据

# plt.plot(filtered_original_beijing, filtered_train_predict_plot, label='Train Predict')

# plt.plot(filtered_original_beijing, filtered_test_predict_plot, label='Test Predict')

# # 格式化 X 轴使用年,并倾斜显示

# plt.gca().xaxis.set_major_locator(mdates.HourLocator(interval=4))

# plt.gca().xaxis.set_major_formatter(mdates.DateFormatter('%Y-%m-%d %H:%M', tz=filtered_original_beijing.tz))

# plt.gcf().autofmt_xdate(rotation=45)

# plt.xlabel('Datetime')

# plt.ylabel('Value')

# plt.legend()

# plt.show()
效果对比
Timeseries Prediction Demo base on LSTM的更多相关文章
- 【转载】Chaotic Time-Series Prediction
原文地址:https://cn.mathworks.com/help/fuzzy/examples/chaotic-time-series-prediction.html?requestedDomai ...
- 用C++调用tensorflow在python下训练好的模型(centos7)
本文主要参考博客https://blog.csdn.net/luoyexuge/article/details/80399265 [1] bazel安装参考:https://blog.csdn.net ...
- 高并发下MySQL出现checking permissions
在某些数据访问层框架中,会使用show full tables from test like 'demo',来检查数据库的状态.当数据库中表的数量较少时,并没有出现严重的问题.但是当数据库中的表数量多 ...
- python中from module import * 的一个陷阱
from module import *把module中的成员全部导到了当前的global namespace,访问起来就比较方便了.当然,python style一般不建议这么做,因为可能引起nam ...
- JavaScript 的性能优化:加载和执行
随着 Web2.0 技术的不断推广,越来越多的应用使用 javascript 技术在客户端进行处理,从而使 JavaScript 在浏览器中的性能成为开发者所面临的最重要的可用性问题.而这个问题又因 ...
- Bootstrap 栅格系统(转载)
源地址:http://www.cnblogs.com/linjiqin/p/3559800.html Bootstrap 栅格系统 目录1.简介2.栅格选项3.列偏移4.嵌套列5.列排序 1.简介Bo ...
- python之import机制
1. 标准 import Python 中所有加载到内存的模块都放在 sys.modules .当 import 一个模块时首先会在这个列表中查找是否已经加载了此模块,如果加载了则只是将 ...
- c++ 虚析构函数[避免内存泄漏]
c++ 虚析构函数: 虚析构函数(1)虚析构函数即:定义声明析构函数前加virtual 修饰, 如果将基类的析构函数声明为虚析构函数时,由该基类所派生的所有派生类的析构函数也都自动成为虚析构函数. ...
- springboot学习随笔(四):Springboot整合mybatis(含generator自动生成代码)
这章我们将通过springboot整合mybatis来操作数据库 以下内容分为两部分,一部分主要介绍generator自动生成代码,生成model.dao层接口.dao接口对应的sql配置文件 第一部 ...
- CMake 常用方法
CMake 允许开发者编写平台无关的 CMakeLists.txt 文件来定制整个编译流程,然后再根据目标用户的平台进一步生成所需的本地化 Makefile 和工程文件,如 Linux 的Makefi ...
随机推荐
- 关于μkeil v5.40(keil5) 如何使用STM32(ARM)虚拟下载器进行Proteus联调
最近我心血来潮,想用Proteus+keil5进行联调,但仔细在网上一找,全是某SDN扒下来的陈年老黑X,都快转出数字包浆了还在用,完完全全跟不上时代,也全是51单片机的版本,STM32(ARM)根本 ...
- WO Mic - 免费麦克风
WO Mic可以将您的手机变成电脑麦克风.您无需支付一分钱购买任何设备.如果您选择无线传输,它也是便携的.数百万用户已经安装并每天都在使用它进行通话.录音.语音遥控等活动. 三大组件协同工作以实现这一 ...
- Octotree插件 - 可以列出github项目的目录结构
Octotree - GitHub code tree
- TreeSet练习 根据字符串长度排序
String类已经实现了Comparable接口,我们可以根据TreeSet提供的构造器传入自己的比较器. public class Set4 { public static void main(St ...
- 关于The JSON value could not be converted to System.DateTime的解决方案
如下json格式提交到后台后报: The JSON value could not be converted to System.DateTime. Path: $.beginTime | LineN ...
- RPC实战与核心原理之时钟轮
时钟轮在RPC中的应用 回顾 在分布式环境下,RPC 框架自身以及服务提供方的业务逻辑实现,都应该对异常进行合理地封装,让使用方可以根据异常快速地定位问题:而在依赖关系复杂且涉及多个部门合作的分布式系 ...
- codeup之字符串比较
Description 比较两个字符串s1和s2的大小,如果s1>s2,则输出一个正数:若s1=s2,则输出0:若s1<s2,则输出一个负数. 要求:不用strcpy函数:两个字符串用ge ...
- 8086汇编(16位汇编)学习笔记00.DEBUG命令使用解析及范例大全
转载自:https://bpsend.net/thread-99-1-1.html 启动 Debug,它是可用于测试和调试 MS-DOS 可执行文件的程序. Debug [[drive:][path] ...
- IDEA配置实体类Serializable快捷键生成serialVersionUID
创建实体类后,如果需要继承Serializable类并生成随机序列号serialVersionUID,在IDEA中使用Serializable快捷键最为合适,故这里为大家介绍如何配置此快捷键. ...
- [Minecraft] Eon 扩展包
Release Eon 扩展包 摘要&前言 是的,原版装备不够 OP,于是我做了这个模组.额外地,我添加了一些有趣的物品. 非原创内容(仅有贴图) 声明:本模组中使用的非原创内容均不用于盈利. ...