【原创】大数据基础之Logstash(1)简介、安装、使用
Logstash 6.6.2

官方:https://www.elastic.co/products/logstash
一 简介
Centralize, Transform & Stash Your Data
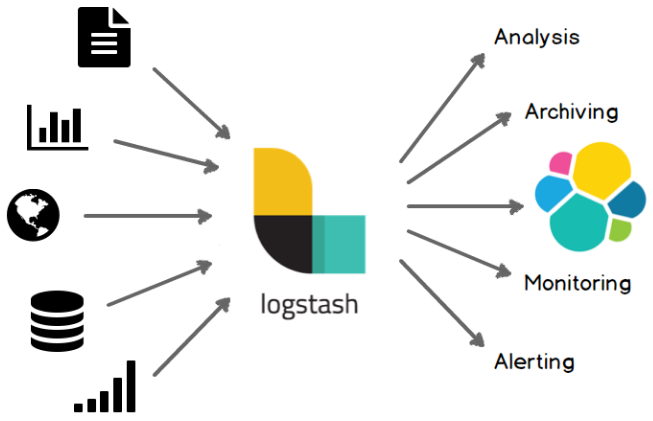
Logstash is an open source, server-side data processing pipeline that ingests data from a multitude of sources simultaneously, transforms it, and then sends it to your favorite “stash.” (Ours is Elasticsearch, naturally.)
集中、转换、储存你的数据:logstash是一个开源的服务端数据处理管道,可以从非常多的数据源接受数据、转换格式、同时发送到你的数据仓库中;
结构
A Logstash pipeline has two required elements, input and output, and one optional element, filter.
1 INPUTS
Ingest Data of All Shapes, Sizes, and Sources
Data is often scattered or siloed across many systems in many formats. Logstash supports a variety of inputs that pull in events from a multitude of common sources, all at the same time. Easily ingest from your logs, metrics, web applications, data stores, and various AWS services, all in continuous, streaming fashion.
接收任何形式、大小和来源的数据:数据通常以各种格式分散在各个系统中,logstash支持很多类型的input可以从各种数据源中将数据拉取过来,这些数据源包括日志、监控、web应用、数据存储等;
2 FILTERS
Parse & Transform Your Data On the Fly
As data travels from source to store, Logstash filters parse each event, identify named fields to build structure, and transform them to converge on a common format for easier, accelerated analysis and business value.
将你的数据进行解析并转换格式:当数据收集上来之后,logstash filter会解析每一条数据,识别数据格式,同时将数据转换为更通用的格,方便后续更简单快速的分析;
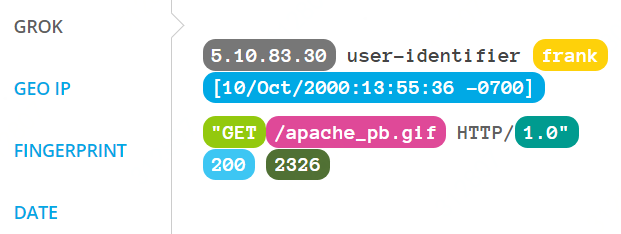
最常用的filter包括grok(正则)和ruby(代码),另外还有mutate/date/json/kv,可以轻松解析你的任意数据;
3 OUTPUTS
Choose Your Stash, Transport Your Data
While Elasticsearch is our go-to output that opens up a world of search and analytics possibilities, it’s not the only one available.
选择你的数据仓库,移动你的数据:elasticsearch提供了无限的搜索和分析的可能性,但es并不是唯一的output;
二 安装
1 ambari安装
详见:https://www.cnblogs.com/barneywill/p/10281678.html
2 docker安装
详见:https://www.cnblogs.com/barneywill/p/10367297.html
3 手工tar安装
$ wget https://artifacts.elastic.co/downloads/logstash/logstash-6.6.2.tar.gz
$ tar xvf logstash-6.6.2.tar.gz
$ cd logstash-6.6.2
logstash插件目录
$LOGSTASH_HOME/vendor/bundle/jruby/2.3.0/gems/
可以看到当前所有的插件以及对应的版本,手工查看和安装插件:
$LOGSTASH_HOME/bin/logstash-plugin list
$LOGSTASH_HOME/bin/logstash-plugin install logstash-input-jdbc
插件源码:https://github.com/logstash-plugins
4 手工yum安装
# rpm --import https://artifacts.elastic.co/GPG-KEY-elasticsearch
# yum install logstash
注册服务:
$ sudo /usr/share/logstash/bin/system-install /etc/logstash/startup.options systemd
三 使用
1 调试filter
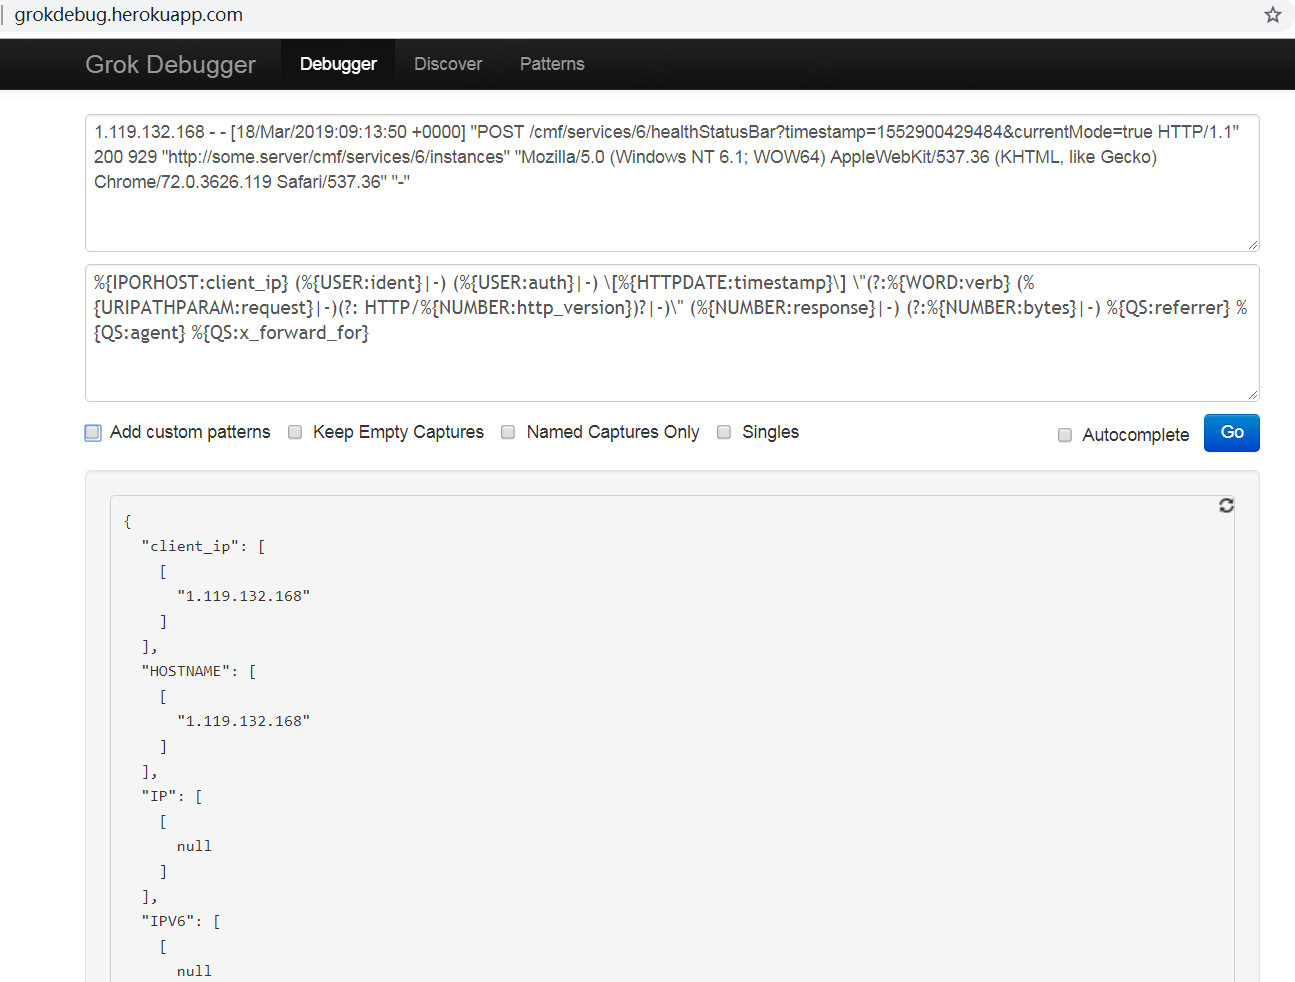
调试grok
http://grokdebug.herokuapp.com/
内置grok pattern
https://github.com/elastic/logstash/blob/v1.4.2/patterns/grok-patterns
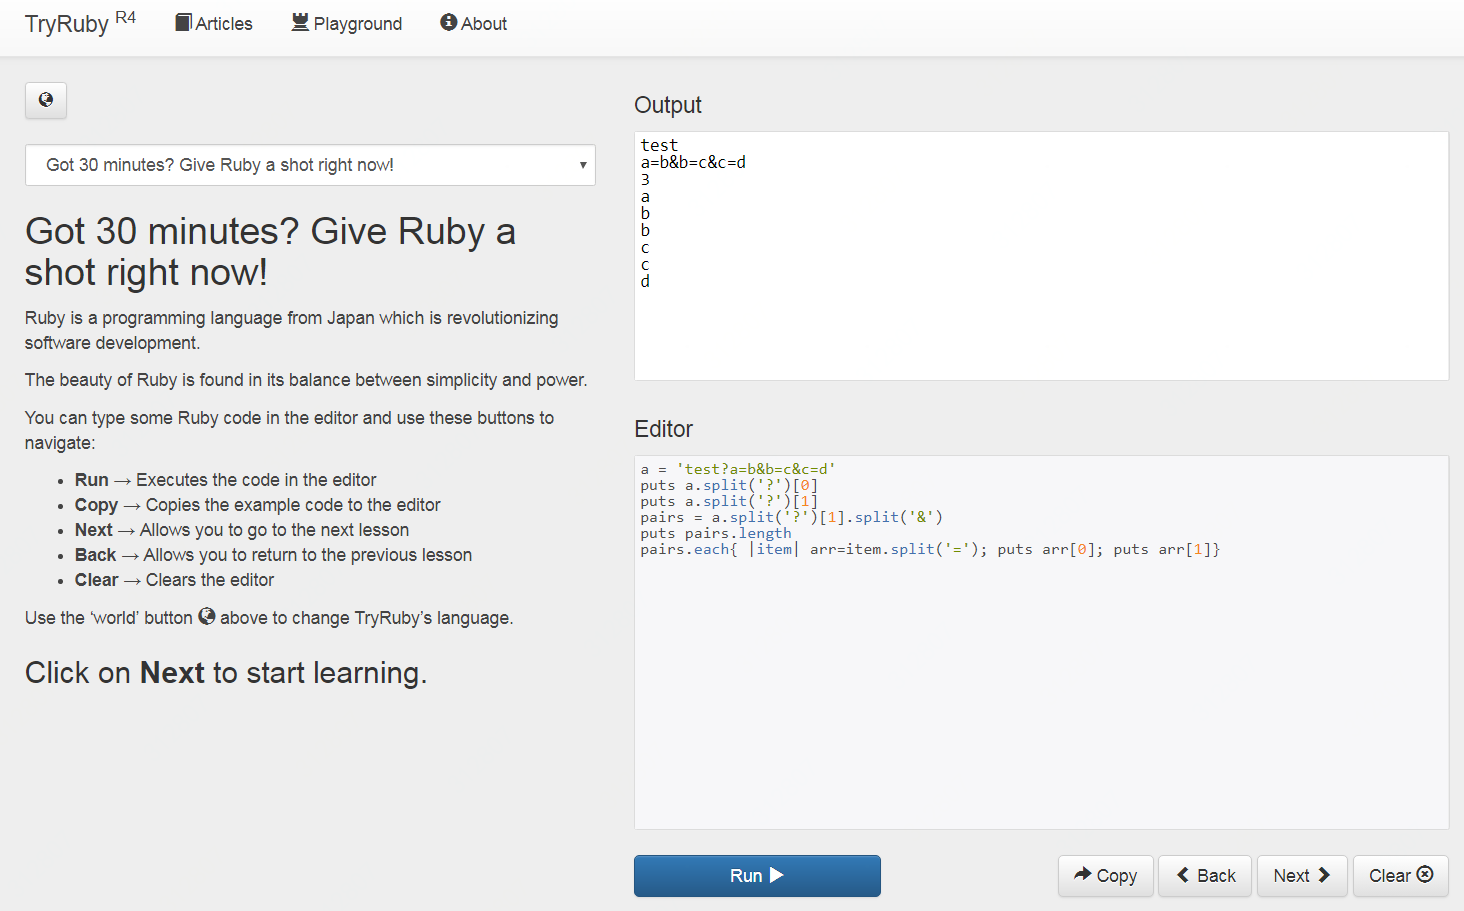
调试ruby
https://ruby.github.io/TryRuby/
2 测试nginx日志的解析:file->grok->stdout
nginx日志默认格式:
    #log_format  main  '$remote_addr - $remote_user [$time_local] "$request" '

    #                  '$status $body_bytes_sent "$http_referer" '

    #                  '"$http_user_agent" "$http_x_forwarded_for"';
nginx日志示例:
1.119.132.168 - - [18/Mar/2019:09:13:50 +0000] "POST /cmf/services/6/healthStatusBar?timestamp=1552900429484¤tMode=true HTTP/1.1" 200 929 "http://some.server/cmf/services/6/instances" "Mozilla/5.0 (Windows NT 6.1; WOW64) AppleWebKit/537.36 (KHTML, like Gecko) Chrome/72.0.3626.119 Safari/537.36" "-"
配置文件
test.conf
input {

    file {

        path => [ "/tmp/test.log" ]

        start_position => "beginning"

        ignore_older => 0

    }

}

filter {

    grok {

        match => { "message" => "%{IPORHOST:client_ip} (%{USER:ident}|-) (%{USER:auth}|-) \[%{HTTPDATE:timestamp}\] \"(?:%{WORD:verb} (%{URIPATHPARAM:request}|-)(?: HTTP/%{NUMBER:http_version})?|-)\" (%{NUMBER:response}|-) (?:%{NUMBER:bytes}|-) %{QS:referrer} %{QS:agent} %{QS:x_forward_for}" }

    }

}

output {

    stdout {}

}
启动
$LOGSTASH_HOME/bin/logstash -f /path/to/test.conf --path.data=/path/to/data --verbose --debug
注意:如果一台机器上启动多个logstash,要通过--path.data来区分;通过--verbose --debug显示控制台中的output;
测试
$ head -5 /var/log/nginx/access.log >> /tmp/test.log
更多input详见
https://www.elastic.co/guide/en/logstash/current/input-plugins.html
更多filter详见
https://www.elastic.co/guide/en/logstash/current/filter-plugins.html
最常用的filter:grok
https://www.elastic.co/guide/en/logstash/current/plugins-filters-ruby.html
最常用的filter:ruby
https://www.elastic.co/guide/en/logstash/current/plugins-filters-ruby.html
常用的filter:mutate
https://www.elastic.co/guide/en/logstash/current/plugins-filters-mutate.html
常用的filter:date
https://www.elastic.co/guide/en/logstash/current/plugins-filters-date.html
常用的filter:json
https://www.elastic.co/guide/en/logstash/current/plugins-filters-json.html
常用的filter:kv
https://www.elastic.co/guide/en/logstash/current/plugins-filters-kv.html
更多output详见
https://www.elastic.co/guide/en/logstash/current/output-plugins.html
【原创】大数据基础之Logstash(1)简介、安装、使用的更多相关文章
- 【原创】大数据基础之Logstash(4)高可用
logstash高可用体现为不丢数据(前提为服务器短时间内不可用后可恢复比如重启服务器或重启进程),具体有两个方面: 进程重启(服务器重启) 事件消息处理失败 在logstash中对应的解决方案为: ...
- 【原创】大数据基础之Logstash(3)应用之http(in和out)
一个logstash很容易通过http打断成两个logstash实现跨服务器或者跨平台间数据同步,比如原来的流程是 logstash: nginx log -> kafka 打断成两个是 log ...
- 【原创】大数据基础之Logstash(2)应用之mysql-kafka
应用一:mysql数据增量同步到kafka 1 准备mysql测试表 mysql> create table test_sync(id int not null auto_increment, ...
- 【原创】大数据基础之Logstash(5)监控
有两种方式来监控logstash: api ui(xpack) When you run Logstash, it automatically captures runtime metrics tha ...
- 【原创】大数据基础之Logstash(3)应用之file解析(grok/ruby/kv)
从nginx日志中进行url解析 /v1/test?param2=v2¶m3=v3&time=2019-03-18%2017%3A34%3A14->{'param1':' ...
- 【原创】大数据基础之Logstash(6)mongo input
logstash input插件之mongodb是第三方的,配置如下: input { mongodb { uri => 'mongodb://mongo_server:27017/db' pl ...
- 大数据基础环境--jdk1.8环境安装部署
1.环境说明 1.1.机器配置说明 本次集群环境为三台linux系统机器,具体信息如下: 主机名称 IP地址 操作系统 hadoop1 10.0.0.20 CentOS Linux release 7 ...
- 【原创】大数据基础之Zookeeper(2)源代码解析
核心枚举 public enum ServerState { LOOKING, FOLLOWING, LEADING, OBSERVING; } zookeeper服务器状态:刚启动LOOKING,f ...
- CentOS6安装各种大数据软件 第八章:Hive安装和配置
相关文章链接 CentOS6安装各种大数据软件 第一章:各个软件版本介绍 CentOS6安装各种大数据软件 第二章:Linux各个软件启动命令 CentOS6安装各种大数据软件 第三章:Linux基础 ...
随机推荐
- 今天终于想明白为什么java包要倒着写
比如 com.baidu.video,因为java内部实际上是以文件夹形式存在的,是按com,baidu,video依次生成文件夹的具体功能的是子文件夹,所以要倒着写.
- 【十三】jvm 性能调优工具之 jstack
一.介绍 jstack是java虚拟机自带的一种堆栈跟踪工具.jstack用于打印出给定的java进程ID或core file或远程调试服务的Java堆栈信息,如果是在64位机器上,需要指定选项&qu ...
- 认证加密算法php hash_hmac和java hmacSha1的问题
public class Test{ public static void main(String[] args) throws Exception { String postString = &qu ...
- lua 立即执行函数
背景 不同文件中,lua提供模块写法, 使用local修饰,可以将变量或者函数,声明为模块内有效,例如 模块暴漏变量使用 return 表的方式. local aafunc = function() ...
- Spring 快速开始 启动Spring
[启动Spring必须配置] [web.xml部署描述符方式] 1.配置Servlet级别上下文 <servlet> <servlet-name>springDispatche ...
- table的复制 SqlServer 数据库添加临时表(select 字段1,字段2,字段3 into)
select 字段1,字段2,字段3 into tempname form table where table.id=1; oralce : insert into MID_DRUG_DETA ...
- 迅为IMX6核心板兼容工业级、商业扩展级、Plus版本核心板
IMX6核心板兼容单核.双核.四核.工业级.汽车级.iMX6Q最新Plus版本,可根据用户需求更换,百变定制,高端产品无忧! iMX6Q核心板(四核商业级) iMX6DL核心板(双核商业级) iMX6 ...
- Java基础_0305:简单Java类
简单Java类 简单Java类是一种在实际开发之中使用最多的类的定义形式,在简单Java类中包含有类.对象.构造方法.private封装等核心概念的使用,而对于简单Java类首先给出如下的基本开发要求 ...
- JSON字符串解析成JSON数据格式
在JS中将JSON的字符串解析成JSON数据格式,一般有两种方式: 1.一种为使用eval()函数. 2. 使用Function对象来进行返回解析. 使用eval函数来解析,并且使用jquery的ea ...
- 算法-链的操作(一)-合并两个排序的链接(no.25)
合并两个排序的链接(no.25) 把下面连个排好序的链,从小到大排序链接. list1 : 1 -> 6 -> 8 list2 : 2-> 5 -> 9 def merge(h ...