day27-3 matplatlib模块
matplotlib
- 图形可视化,主要用来画图
- 别问,问就是看不懂
尚
折线图
# 一般使用下面的这个语句,设置字体编码

plt.rcParams['font.sans-serif'] = ['SimHei']

plt.rcParams['axes.unicode_minus'] = False
# cmd命令行用ipython也可以执行这些代码

x = [10,2,3]

y = [11,23,10]

plt.title('标题', fontsize=20, color='red')

plt.ylabel('y轴', fontsize=20, color='green')

plt.xlabel('x轴', fontsize=20)

# plt.plot(x, y, linestyle=':', marker='v')   #### 画折线图

plt.plot(x, y,'--v' )

plt.show()
柱状图
- 豆瓣电影数据为例,画出需求图
movies  = pd.read_csv('douban_movie.csv')

movies.head()
| 名字 | 投票人数 | 类型 | 产地 | 上映时间 | 时长 | 年代 | 评分 | 首映地点 | |
|---|---|---|---|---|---|---|---|---|---|
| 0 | 肖申克的救赎 | 692795.0 | 剧情/犯罪 | 美国 | 1994-09-10 00:00:00 | 142 | 1994 | 9.6 | 多伦多电影节 |
| 1 | 控方证人 | 42995.0 | 剧情/悬疑/犯罪 | 美国 | 1957-12-17 00:00:00 | 116 | 1957 | 9.5 | 美国 |
| 2 | 美丽人生 | 327855.0 | 剧情/喜剧/爱情 | 意大利 | 1997-12-20 00:00:00 | 116 | 1997 | 9.5 | 意大利 |
| 3 | 阿甘正传 | 580897.0 | 剧情/爱情 | 美国 | 1994-06-23 00:00:00 | 142 | 1994 | 9.4 | 洛杉矶首映 |
| 4 | 霸王别姬 | 478523.0 | 剧情/爱情/同性 | 中国大陆 | 1993-01-01 00:00:00 | 171 | 1993 | 9.4 | 香港 |
画出各个国家或者地区电影的数量
res = movies.groupby('产地').size().sort_values(ascending=False)	# 根据产地分组,降序显示数量

x = res.index

y = res.values

plt.figure(figsize=(20,6))	# 设置画布大小

plt.title('各个国家或者地区电影的数量', fontsize=20, color='red')	# 设置标题

plt.xlabel('产地', fontsize=20)	# x轴标题

plt.ylabel('数量', fontsize=18)	# y轴标题

plt.xticks(fontsize=15, rotation=45)	# x轴刻度,rotation代表旋转多少度

for a, b in zip(x, y):

    # text就是写值,a,b+100是代表写的做表,b是代表要写的值,horizontalalignment代表些的位置

    plt.text(a,b+100, b, fontsize=15, horizontalalignment='center')

plt.bar(x, y)	# bar代表柱状图

plt.show()

plt.savefig('a.jpg')	# 保存
饼状图
- 根据电影的长度绘制饼图
cut方法
pd.cut( np.array([0.2, 1.4, 2.5, 6.2, 9.7, 2.1]), [1,2,3] ) # 判断值是否在(1,2] (2,3]区间中
[NaN, (1.0, 2.0], (2.0, 3.0], NaN, NaN, (2.0, 3.0]]

Categories (2, interval[int64]): [(1, 2] < (2, 3]]
df = movies.head()

df
| 名字 | 投票人数 | 类型 | 产地 | 上映时间 | 时长 | 年代 | 评分 | 首映地点 | |
|---|---|---|---|---|---|---|---|---|---|
| 0 | 肖申克的救赎 | 692795.0 | 剧情/犯罪 | 美国 | 1994-09-10 00:00:00 | 142 | 1994 | 9.6 | 多伦多电影节 |
| 1 | 控方证人 | 42995.0 | 剧情/悬疑/犯罪 | 美国 | 1957-12-17 00:00:00 | 116 | 1957 | 9.5 | 美国 |
| 2 | 美丽人生 | 327855.0 | 剧情/喜剧/爱情 | 意大利 | 1997-12-20 00:00:00 | 116 | 1997 | 9.5 | 意大利 |
| 3 | 阿甘正传 | 580897.0 | 剧情/爱情 | 美国 | 1994-06-23 00:00:00 | 142 | 1994 | 9.4 | 洛杉矶首映 |
| 4 | 霸王别姬 | 478523.0 | 剧情/爱情/同性 | 中国大陆 | 1993-01-01 00:00:00 | 171 | 1993 | 9.4 | 香港 |
s = np.array(df['时长'])

'8U' in s	# 垃圾数据

np.where('8U' == s)
(array([31644], dtype=int64),)
'12J' in s

np.where('12J' ==  s)
(array([32948], dtype=int64),)
s = np.delete(s, 31644, axis=0)

s = np.delete(s, 32947, axis=0)	# 删了就会少一行

np.where('12J' == s)
(array([], dtype=int64),)
data = pd.cut(s.astype('float'), [0,60,90,110,1000]).value_counts()	# astype:强制转换

data
(0, 60]        10323

(60, 90]        7727

(90, 110]      13233

(110, 1000]     7449

dtype: int64
x = data.index

y = data.values

plt.figure(figsize=(10,6))

plt.title('电影时长分布图')

patchs, l_text, p_text = plt.pie(y, labels=x, autopct='%0.2f%%', colors='bgry')	# pie画饼图

for i in p_text:

    i.set_size(15)

    i.set_color('w')

for l in l_text:

    l.set_size(20)

    l.set_color('r')

plt.show()
NICK
条形图
import matplotlib.pyplot as plt
# 只识别英语,所以通过以下两行增加中文字体
from matplotlib.font_manager import FontProperties
# 字体路径根据电脑而定
font = FontProperties(fname='M:\STKAITI.TTF')
# jupyter 默认不显示图片,通过这一行告诉他显示
%matplotlib inline
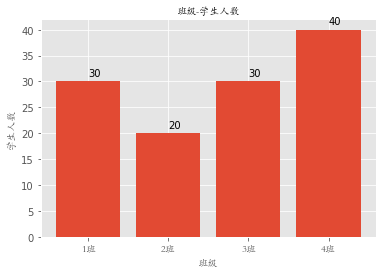
classes = ['1班', '2班', '3班', '4班'] # 相当于columns
student_amounts = [30, 20, 30, 40] # 值
classes_index = range(len(classes)) # [0, 1, 2, 3]
plt.bar(classes_index, student_amounts)
plt.xticks(classes_index, classes, FontProperties=font)
for ind,student_amount in enumerate(student_amounts):
print(ind,student_amount)
plt.text(ind,student_amount+1,student_amount)
plt.xlabel('班级', FontProperties=font)
plt.ylabel('学生人数', FontProperties=font)
plt.title('班级-学生人数', FontProperties=font)
plt.show()
0 30

1 20

2 30

3 40
直方图
import numpy as np
import matplotlib.pyplot as plt
from matplotlib.font_manager import FontProperties
%matplotlib inline
font = FontProperties(fname='M:\STKAITI.TTF')
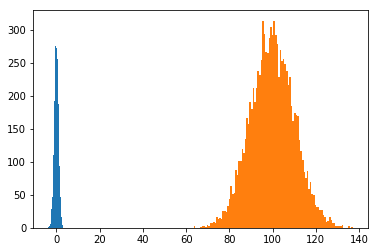
mu1, mu2, sigma = 50, 100, 10
x1 = mu2 + sigma * np.random.randn(10000)
print(x1)
[ 93.49947877  86.87378653  98.0194217  ... 108.33555519  90.58512015

 102.19048574]
x1 = np.random.randn(10000)

print(x1)
[ 0.85927045 -0.8061112   1.30878058 ... -0.32700199 -0.67669564

  0.25750884]
x2 = mu2 + sigma*np.random.randn(10000)

print(x2)
[101.62589858 109.86489987 117.41374105 ...  97.52364544 107.21076273

  99.56765772]
plt.hist(x1, bins=100)

plt.hist(x2, bins=100)

plt.show()
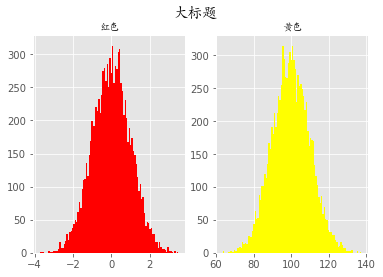
plt.style.use('ggplot')

fig = plt.figure()

# 相当于把一整块画板分成了1行2列的两个画板

ax1 = fig.add_subplot(121)

ax1.hist(x1, bins=100, color='red')

ax1.set_title('红色', fontproperties=font)

ax2 = fig.add_subplot(122)

ax2.hist(x2, bins=100, color='yellow')

ax2.set_title('黄色', fontproperties=font)

fig.suptitle('大标题', fontproperties=font, fontsize=15, weight='bold')

plt.show()
折线图
import numpy as np

import matplotlib.pyplot as plt

from matplotlib.font_manager import FontProperties

%matplotlib inline

font = FontProperties(fname='M:\STKAITI.TTF')
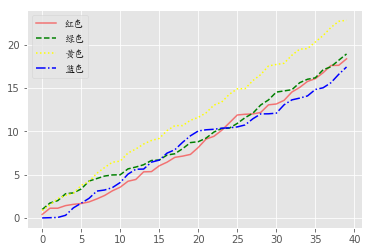
plt.style.use('ggplot')

np.random.seed(1)

data1 = np.random.rand(40).cumsum()

data2 = np.random.rand(40).cumsum()

data3 = np.random.rand(40).cumsum()

data4 = np.random.rand(40).cumsum()
plt.plot(data1, color='r', linestyle='-', alpha=0.5, label='红色')

plt.plot(data2, color='green', linestyle='--', label='绿色')

plt.plot(data3, color='yellow', linestyle=':', label='黄色')

plt.plot(data4, color='blue', linestyle='-.', label='蓝色')

plt.legend(prop=font)

plt.show()
arr = np.array([1, 2, 3, 4])

arr.cumsum()#   1,1+2,1+2+3,1+2+3+4
array([ 1, 3, 6, 10], dtype=int32)
散点图
import numpy as np

import matplotlib.pyplot as plt

from matplotlib.font_manager import FontProperties

%matplotlib inline

font = FontProperties(fname='M:\STKAITI.TTF')
x = np.arange(1, 20)

x
array([ 1,  2,  3,  4,  5,  6,  7,  8,  9, 10, 11, 12, 13, 14, 15, 16, 17,

       18, 19])
y_linear = x**2

y_linear
array([  1,   4,   9,  16,  25,  36,  49,  64,  81, 100, 121, 144, 169,

       196, 225, 256, 289, 324, 361], dtype=int32)
y_log = np.log(x)

y_log
array([0.        , 0.69314718, 1.09861229, 1.38629436, 1.60943791,

       1.79175947, 1.94591015, 2.07944154, 2.19722458, 2.30258509,

       2.39789527, 2.48490665, 2.56494936, 2.63905733, 2.7080502 ,

       2.77258872, 2.83321334, 2.89037176, 2.94443898])
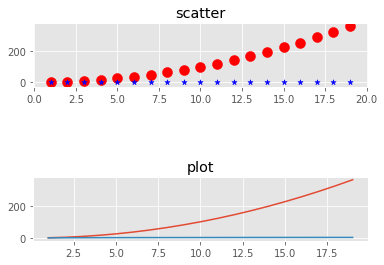
fig = plt.figure()

ax1 = fig.add_subplot(311)

ax1.scatter(x, y_linear, color='red', marker='o', s=100)

ax1.scatter(x, y_log, color='blue', marker='*', s=30)

ax1.set_title('scatter')

ax2 = fig.add_subplot(313)

ax2.plot(x, y_linear)

ax2.plot(x, y_log)

ax2.set_title('plot')

plt.plot

plt.show()
day27-3 matplatlib模块的更多相关文章
- python学习Day27--time模块、sys模块、os模块和序列化模块
[知识点] 1.时间模块: (1)时间戳时间,格林威治时间,float数据类型 英国伦敦的时间:1970.1.1 0:0:0 北京时间:1970.1.1 8:0:0 (2)结构化时间, ...
- 时间模块,os模块,sys模块
时间模块 和时间有关系的我们就要用到时间模块.在使用模块之前,应该首先导入这个模块. #常用方法 1.time.sleep(secs) (线程)推迟指定的时间运行.单位为秒. 2.time.time( ...
- [ python ] 学习目录大纲
简易博客[html+css]练习 MySQL 练习题及答案 MySQL视图.触发器.函数.存储过程 MySQL 操作总结 Day41 - 异步IO.协程 Day39/40 - 线程的操作 Day36/ ...
- python 全栈开发,Day27(复习, defaultdict,Counter,时间模块,random模块,sys模块)
一.复习 看下面一段代码,假如运行结果有问题,那么就需要在每一步计算时,打印一下结果 b = 1 c = 2 d = 3 a = b+c print(a) e = a + d print(e) 执行输 ...
- 8.6 day27 网络编程 osi七层协议 Time模块补充知识 TCP协议
Time模块补充知识 date和datetime区别是什么? date 就是年月日 datetime就是年月时时分秒 以下代码为什么会报错? import json from datetime imp ...
- (day27)subprocess模块+粘包问题+struct模块+ UDP协议+socketserver
目录 昨日回顾 软件开发架构 C/S架构 B/S架构 网络编程 互联网协议 socket套接字 今日内容 一.subprocess模块 二.粘包问题 三.struct模块 四.UDP 五.QQ聊天室 ...
- day27 模块:正则re, configparser, subprocess
Python之路,Day15 = Python基础15 re 模块补充 ret = re.findall("c.d", "abc\nd", re.S) # 后面 ...
- time模块和os模块,json模块
import time # def month(n): # time.local() # struct_time=time.strptime("%Y-%m-1","%Y- ...
- day27:异常&反射
目录 认识异常处理 1.程序错误的种类 2.异常的分类 3.AssertionError(断言assert语句失败) 异常处理的基本语法 1.异常处理的基本语法 2.带有分支的异常处理 3.处理 ...
随机推荐
- python项目开发:ftp server开发
程序要求: 1.用户加密认证 (对用户名密码进行MD5验证)2.允许同时多用户登陆 (使用socket server方法,为每个用户都创建一个信息文件)3.每个用户有自己的家目录,且只能访问自己的家目 ...
- 执行计划中Using filesort,Using temporary相关语句的优化解决
昨天听开发人员提到,相关的彩票网页当中一个页面刷新的很慢,特别是在提取数据的时候,今天早上一到,便去找开发人员要去相关的也没进行浏览,窥探哪些数据出现了问题,开发人员使用PHP开发,所以我用IE很容易 ...
- HDU 1912
坑,直接把公路看成X轴来做,然后,排序扫描一下,你懂的. #include <iostream> #include <algorithm> #include <cstdi ...
- Apache反向代理结合Tomcat集群来实现负载均衡(一)、概念理解
好的博文一般都能做到"望题知文",看下标题就知道下边要讲的内容,写这个标题时犹豫了一下,本来要将标题定位apache+tomcat实现负载均衡,但是又认为这样显得比較模糊.后来想了 ...
- golang自己定义数据类型查询与插入postgresql中point数据
golang自己定义数据类型查询与插入postgresql中point数据 详细代码例如以下: package main import ( "bytes" "databa ...
- 如何构建一个轻量级级的DI(依赖注入)
概念:依赖注入与IOC模式类似工厂模式,是一种解决调用者和被调用者依赖耦合关系的模式:它解决了对象之间的依赖关系,使得对象只依赖IOC/DI容器,不再直接相互依赖,实现松耦合,然后在对象创建时,由IO ...
- POJ2230题解
题目来源 id=2230">http://poj.org/problem?id=2230 题目大意 求无向图从起点1開始从不同方向经过全部边的一条路径.输出随意一条. 题解 把无向图的 ...
- POJ1151 Atlantis 【扫描线】
Atlantis Time Limit: 1000MS Memory Limit: 10000K Total Submissions: 16882 Accepted: 6435 Descrip ...
- Redis各种数据类型的使用场景
Redis的六种特性 l Strings l Hashs l Lists l Sets l Sorted Sets l Pub/Sub Redis各特性的应用场景 Strings Strings 数据 ...
- luogu3197 [HNOI2008] 越狱
题目大意 已知序列$P$满足$|P|=N$,(以下所有$i,i\in[1,N]$)$\forall i, P_i\in [1,M]$.求$|\{P|\exists i, P_i =P_{i+1}\}| ...