Seaborn风格设置
官方网站:seaborn: statistical data visualization — seaborn 0.11.2 documentation (pydata.org)
Seaborn是基于matplotlib的python数据可视化库,提供更高层次的API封装,包括一些高级图表可视化等工具,用于绘制更美观和信息更丰富的统计图表。
导入模块:
import numpy as np

import pandas as pd

import matplotlib.pyplot as plt

import seaborn as sns

%matplotlib inline
风格设置
全局风格设置
seaborn.set(

    context='notebook',

    style='darkgrid',

    palette='deep',

    font='sans-serif',

    font_scale=1,

    color_codes=True,

    rc=None,

)

Docstring:

Set aesthetic parameters in one step.

Each set of parameters can be set directly or temporarily, see the

referenced functions below for more information.

Parameters

----------

context : string or dict

    Plotting context parameters, see :func:`plotting_context`

style : string or dict

    Axes style parameters, see :func:`axes_style`

palette : string or sequence

    Color palette, see :func:`color_palette`

font : string

    Font family, see matplotlib font manager.

font_scale : float, optional

    Separate scaling factor to independently scale the size of the

    font elements.

color_codes : bool

    If ``True`` and ``palette`` is a seaborn palette, remap the shorthand

    color codes (e.g. "b", "g", "r", etc.) to the colors from this palette.

rc : dict or None

    Dictionary of rc parameter mappings to override the above.
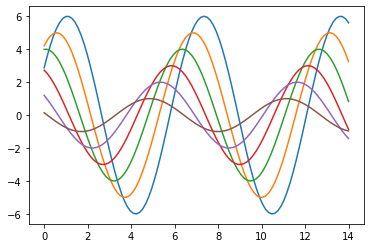
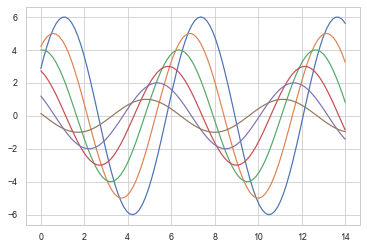
# 创建正弦函数

def sinplot(flip=1):

    x = np.linspace(0, 14, 100)

    for i in range(1, 7):

        plt.plot(x, np.sin(x + i * .5) * (7 - i) * flip)

sinplot()
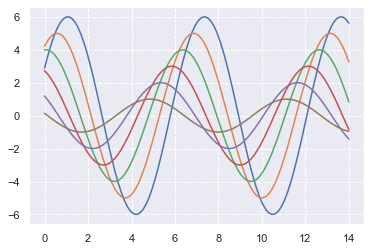
sns.set()     #设置seaborn默认风格,一旦设置就设置了全局的风格

sinplot()

plt.grid(linestyle = '--')     #设置网格线
局部风格设置
seaborn.set_style(style=None, rc=None)

Docstring:

Set the aesthetic style of the plots.

This affects things like the color of the axes, whether a grid is

enabled by default, and other aesthetic elements.

Parameters

----------

style : dict, None, or one of {darkgrid, whitegrid, dark, white, ticks}

    A dictionary of parameters or the name of a preconfigured set.

rc : dict, optional

    Parameter mappings to override the values in the preset seaborn

    style dictionaries. This only updates parameters that are

    considered part of the style definition.

Examples

--------

>>> set_style("whitegrid")

>>> set_style("ticks", {"xtick.major.size": 8, "ytick.major.size": 8})

See Also

--------

axes_style : return a dict of parameters or use in a ``with`` statement

             to temporarily set the style.

set_context : set parameters to scale plot elements

set_palette : set the default color palette for figures
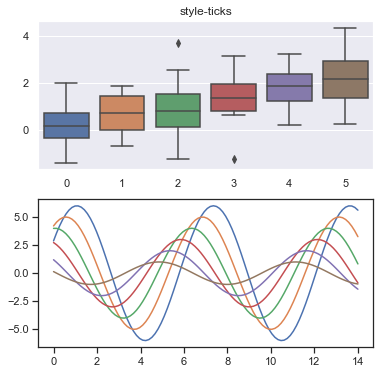
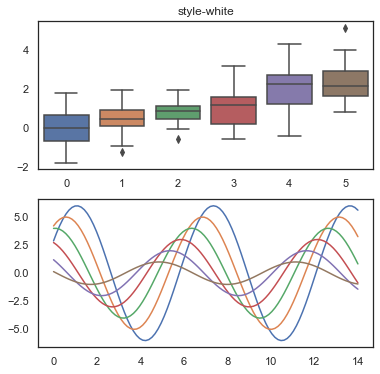
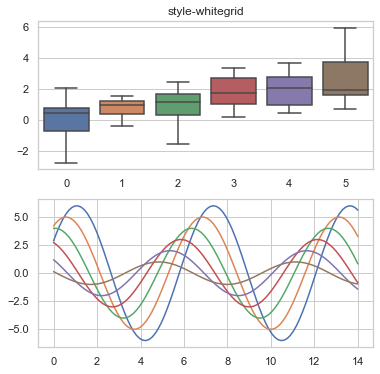
#set_style()切换图表风格

#风格选择:"white","dark","whitegrid","darkgrid","ticks"

fig = plt.figure(figsize=(6, 6))

style = 'ticks'

ax1 = fig.add_subplot(2,1,1)

sns.set_style(style)

data = np.random.normal(size=(20,6)) + np.arange(6)/2

sns.boxplot(data=data)

plt.title('style-{0}'.format(style))

ax2 = fig.add_subplot(2,1,2)

sinplot()

设置图形坐标轴
seaborn.despine(

    fig=None,

    ax=None,

    top=True,

    right=True,

    left=False,

    bottom=False,

    offset=None,

    trim=False,

)

Docstring:

Remove the top and right spines from plot(s).

fig : matplotlib figure, optional

    Figure to despine all axes of, default uses current figure.

ax : matplotlib axes, optional

    Specific axes object to despine.

top, right, left, bottom : boolean, optional

    If True, remove that spine.

offset : int or dict, optional

    Absolute distance, in points, spines should be moved away

    from the axes (negative values move spines inward). A single value

    applies to all spines; a dict can be used to set offset values per

    side.

trim : bool, optional

    If True, limit spines to the smallest and largest major tick

    on each non-despined axis.
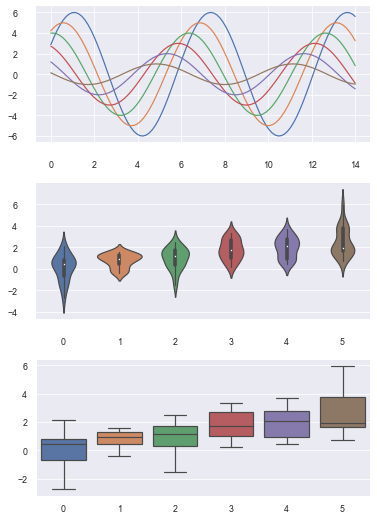
#创建图表

fig = plt.figure(figsize=(6,9))

plt.subplots_adjust(hspace=0.3)

sns.set_style('darkgrid')

ax1 = fig.add_subplot(3,1,1)

sinplot()

sns.despine()      #默认删除上和右坐标轴

ax2 = fig.add_subplot(3,1,2)

sns.violinplot(data=data)

sns.despine(offset=10, trim=True)      #offset: 与坐标轴之间的偏移;trim=True,将坐标轴限制在数据最大和最小值之间

ax3 = fig.add_subplot(3,1,3)

sns.boxplot(data=data, palette='deep')

sns.despine(left=False, right=True)   #隐藏右边坐标轴
设置子图风格
seaborn.axes_style(style=None, rc=None)

Docstring:

Return a parameter dict for the aesthetic style of the plots.

This affects things like the color of the axes, whether a grid is

enabled by default, and other aesthetic elements.

This function returns an object that can be used in a ``with`` statement

to temporarily change the style parameters.

Parameters

----------

style : dict, None, or one of {darkgrid, whitegrid, dark, white, ticks}

    A dictionary of parameters or the name of a preconfigured set.

rc : dict, optional

    Parameter mappings to override the values in the preset seaborn

    style dictionaries. This only updates parameters that are

    considered part of the style definition.
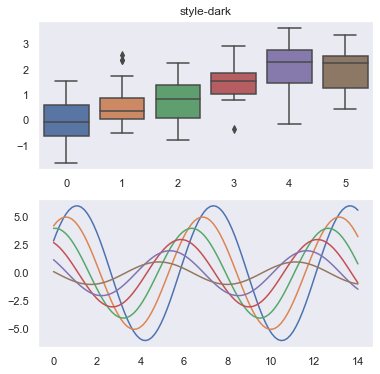
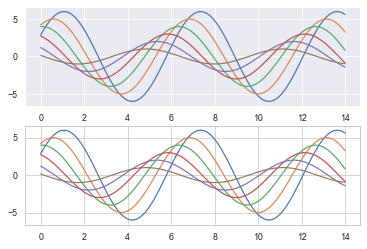
#axes_style()设置局部图表(子图)风格

#与with配合使用,实现局部代码区分

with sns.axes_style('darkgrid'):

    plt.subplot(211)

    sinplot()

#外部图表风格

sns.set_style('whitegrid')

plt.subplot(212)

sinplot()
设置图形显示尺度
seaborn.set_context(context=None, font_scale=1, rc=None)

Docstring:

Set the plotting context parameters.

This affects things like the size of the labels, lines, and other

elements of the plot, but not the overall style. The base context

is "notebook", and the other contexts are "paper", "talk", and "poster",

which are version of the notebook parameters scaled by .8, 1.3, and 1.6,

respectively.

Parameters

----------

context : dict, None, or one of {paper, notebook, talk, poster}

    A dictionary of parameters or the name of a preconfigured set.

font_scale : float, optional

    Separate scaling factor to independently scale the size of the

    font elements.

rc : dict, optional

    Parameter mappings to override the values in the preset seaborn

    context dictionaries. This only updates parameters that are

    considered part of the context definition.

Examples

--------

>>> set_context("paper")

>>> set_context("talk", font_scale=1.4)

>>> set_context("talk", rc={"lines.linewidth": 2})
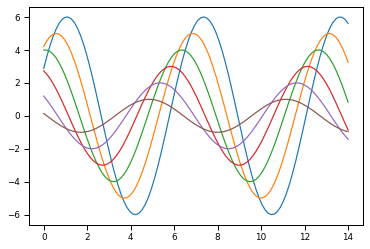
#set_context()设置图形显示尺度

#尺度类型:"paper","notebook","talk","poster"

sns.set_context()      #默认为notebook

sinplot()
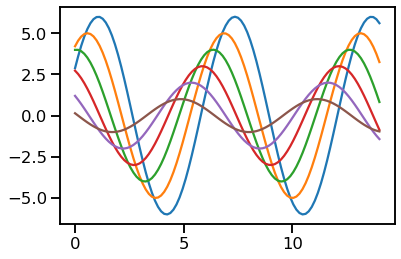
sns.set_context('paper')       #paper风格

sinplot()
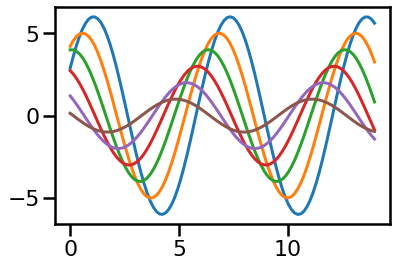
sns.set_context('talk')        #talk风格

sinplot()
sns.set_context('poster')      #poster风格

sinplot()
Seaborn风格设置的更多相关文章
- 可视化库-seaborn-布局风格设置(第五天)
1. sns.set_style() 进行风格设置, sns.set() 进行设置的重置, 五种风格 # 1.darkgrid# 2.whitegrid# 3.dark# 4.white# 5 tic ...
- 5-1可视化库Seabon-整体布局风格设置
In [1]: import seaborn as sns import numpy as np import matplotlib as mpl import matplotlib.pyplot a ...
- 谈谈CListCtrl 扩展风格设置方法-SetExtendedStyle和ModifyStyleEx 比較
谈谈CListCtrl 扩展风格设置方法 --------------------------------------SetExtendedStyle和ModifyStyleEx 比較 对于刚開始学习 ...
- android studio eclipse keymap theme 快捷键 主题风格设置
android studio eclipse keymap theme 快捷键 主题风格设置 将Android Studio的快捷键设置与eclipse一致,使用习惯的快捷键才顺手.Mac系统下:进入 ...
- 图表可视化seaborn风格和调色盘
seaborn是基于matplotlib的python数据可视化库,提供更高层次的API封装,包括一些高级图表可视化等工具. 使用seaborn需要先安装改模块pip3 install seaborn ...
- Intellij IDEA 13.1.3 字体,颜色,风格设置
作者QQ:1095737364 打开file-->settings,然后根据提示完成设置,当然,可以根据自己的爱好设置自己的风格,那个工程区的背景我还没有找到在什么地方,如果你找到了麻烦告诉我一 ...
- Android 圆形ProgressBar风格设置
Android系统自带的ProgressBar风格不是很好,如果想自己设置风格的话,一般有几种方法.首先介绍一下第一种方法通过动画实现.在res的anim下创建动画资源loading.xml: < ...
- 黄聪:Xmind修改默认字体风格设置
Xmind是一款非常好用的思维导图软件,但默认字体使用宋体不够好看,软件本身不支持设置默认字体,但通过修改配置文件达到配置默认字体的目的 默认控制风格的配置文件位置 XMind\plugins\org ...
- Eclipse代码风格设置
在编写代码的过程中,代码的呈现形式是通过eclipse的Formatter配置文件所控制的.我们可以按照自己的习惯生成属于自己的代码风格配置文件,方便规范以后的代码编写形式.具体的操作步骤如下所示:( ...
- CDockablepane风格设置
屏蔽掉pane右上角的几个按钮 即将CDockablePane右上角的三个按钮屏蔽. 1 去掉关闭按钮 在CDockablePane的派生类中,重写方法CanBeClosed即可 ...
随机推荐
- 【Python OO其一】构造函数__init__()
Python对象包括三个部分:id(identity识别码).type(对象类型).value(对象的值) __ init __()构造函数 __ init __()方法应用定义构造函数,作用是在实例 ...
- 【Azure 应用服务】在App Service中新建WebJob时候遇见错误,不能成功创建新的工作任务
问题描述 在Azure App Service界面上,添加新的Web Job(工作任务)时,一直添加失败.无详细错误提示,在App Service的Activity Logs(活动日志)中,根本没有添 ...
- 浅析图数据库 Nebula Graph 数据导入工具——Spark Writer
从 Hadoop 说起 近年来随着大数据的兴起,分布式计算引擎层出不穷.Hadoop 是 Apache 开源组织的一个分布式计算开源框架,在很多大型网站上都已经得到了应用.Hadoop 的设计核心思想 ...
- ffmpeg 使用记录
这周周末尝试把我硬盘上面的视频文件压缩了一下,但是效果并不理想.其中主要有两个原因, 视频本来就是h264的编码,再重新编码也没啥用,因为限制大小的主要是码率 ffmpeg GPU加速版的h265编码 ...
- C++ Qt开发:QHostInfo主机地址查询组件
Qt 是一个跨平台C++图形界面开发库,利用Qt可以快速开发跨平台窗体应用程序,在Qt中我们可以通过拖拽的方式将不同组件放到指定的位置,实现图形化开发极大的方便了开发效率,本章将重点介绍如何运用QHo ...
- [学习笔记]在CentOS7中用Docker方式安装Jenkins
@ 目录 原理: 创建Docker网桥网络 安装DinD 创建镜像 构建镜像 运行容器 原理: Docker in Docker (以下简称 DinD)可以在 Container 中直接运行一个 Do ...
- SelectZenEmpty 下拉框 支持 最大长度 超出... vue 组件
<template> <Select v-model="innerValue" :disabled="disabled" :clearable ...
- Postman全网最详细使用教程
Postman全网最详细使用教程 欢迎关注博主公众号「Java大师」, 专注于分享Java领域干货文章, 关注回复「postman」, 获取postman插件和安装程序: http://www.jav ...
- Hibernate之list和iterator
在Hibernate3中将Session.find(),Session.iterator()换成:session.createQuery().list(),session.createQuery(). ...
- verilog勘误系列之-->算术运算符运算失败
描述 在verilog代码设计时使用算术运算符与乘法搭配使用出现计算错误 原因 由于数据位宽设置不当导致 错误案例 wire signed [13:0] w01; wire signed [23:0] ...