
Time Series_2_Multivariate_TBC!!!!
1. Cointegration
n×1 vector yt of time series is cointegrated if each series individually integrated in the order d (d = 1, nonstationary unit-root processes, i.e., random walks; d = 0, stationary process).
1.1 Simulation for Cointegration, based on Hamilton (1994)


#generate the two time series of length 1000

set.seed(20200229)      #fix the random seed

N <- 100         #define length of simulation

x <- cumsum(rnorm(N))        #simulate a normal random walk

gamma <- 0.7         #set an initial parameter value

y <- gamma * x + rnorm(N)    #simulate the cointegrating series

plot(x, col="black", type='l', lwd=2, ylab='simulated values')

lines(y,col="skyblue", lwd=2)
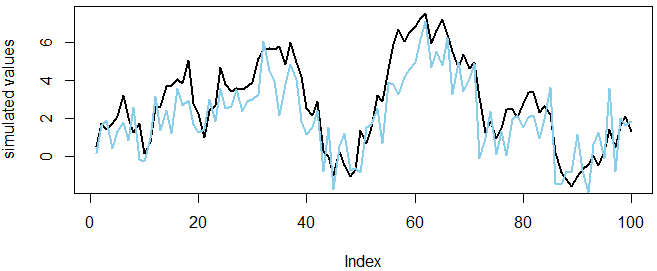
Both series are individually random walks.
In real world we don't know gamma, so need estimation based on raw data, running linear regression of one series on the other, i.e., Engle-Granger method of testing cointegration.
1.2 Statistical Tests (Augmented Dickey Fuller test)
install.packages('urca')

library('urca')

summary(ur.df(x,type="none"))

summary(ur.df(y,type="none"))
NULL: Unit root exists in the process
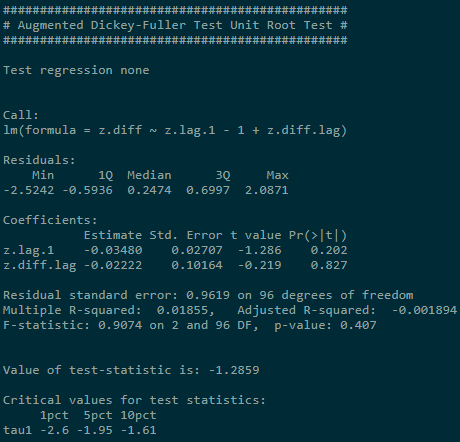
Reject NULL if test-statistic is smaller than critical value. Result shows test-statistic is larger than critical value at three usual sig.levels. We can't reject NULL.
Conclusion: Both series are individually unit root process.
1.3 Linear Combination
z <- y - gamma * x

plot(z,type='l')

summary(ur.df(z,type="none"))
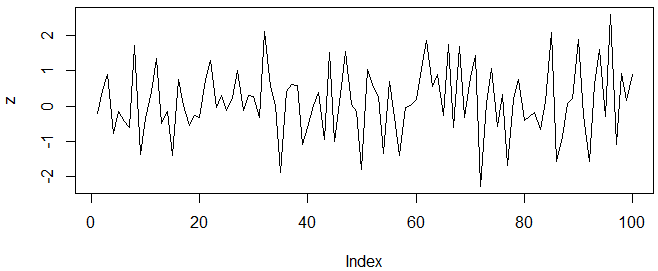
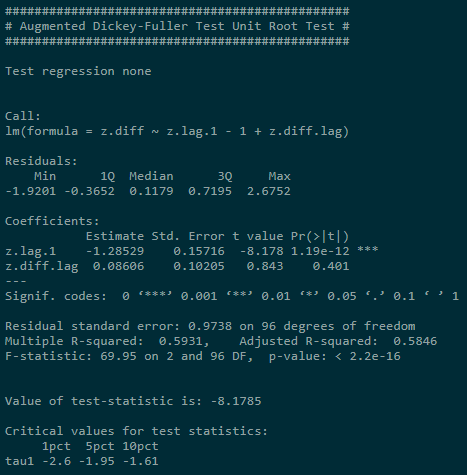
zt seems to be a white noise process and rejection of unit root if confirmed by ADF tests:
1.4 Estimate the Cointegrating Relationship using Engle-Granger method
Step 1: Run linear regression yt on xt (simple OLS estimation);
Step 2: Test residuals for the presence of a unit root.
coin <- lm(y ~ x -1)        #regression without constant

coin$resid          #obtain the residuals

summary(ur.df(coin$resid))  #ADF test of residuals
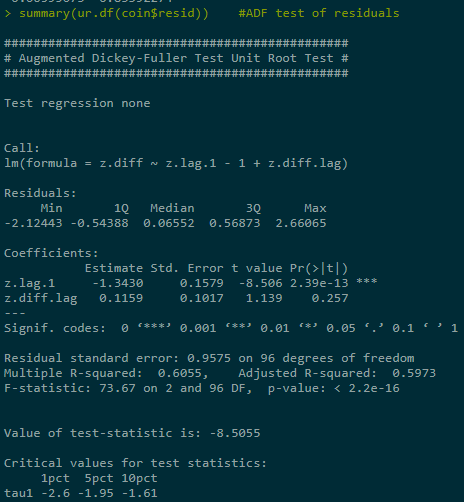
Reject NULL.
Pair trading (statistical arbitrage) exploits such cointegrating relationship, aiming to set up strategy based on the spread between two time series. If two series are cointegrated, we expect their stationary linear combination to revert to 0. By selling relatively expensive and buying cheaper one, wait for the reversion to make profit.
Intuition: Linear combination of time series (which form cointegrating relationship) is determined by underlying (long-term) economic forces, e.g., same industry companies may grow similarly; spot and forward price of financial product are bound together by no-arbitrage principle; FX rates of interlinked countries tend to move together.
2. Vector Autoregressive Model
2.1 Theory Bgs

Ai are n×n coefficient matrices for all i = 1...p;
ut is a vector white noise process (assumes lack of auto correlation, while allow contemporaneous (同时发生的) correlation between components, i.e., ut has non-diagonal covariance matrix, meaning that contemporaneous dependencies aren't modeled) with positive definite covariance matrix. Thus we can use OLS to estimate equation by equation. (叫做 reduced form VAR models)
另一种叫做 structural VAR form model, SVAR models the contemporaneous effects among variables:

Where: 
Disturbance terms are defined to be uncorrelated, thus are referred to as structural shocks.
2.2 Three-component VAR model (equity return, stock index, US Treasury bond interest rates)
2.2.1 Task: Forecast stock market index by using additional variables and identify impluse responses.
Assume: There exists a hidden long-term relationship between these three components.
2.2.2 Process:
rm(list = ls()) #clear the whole workspace

install.packages('xts');library(xts)

install.packages('vars');library('vars')

install.packages('quantmod');library('quantmod')

getSymbols('SNP', from='2012-01-02', to='2020-02-29')

getSymbols('MSFT', from='2012-01-02', to='2020-02-29')

getSymbols('DTB3', src='FRED')  #3-month T-Bill interest rates

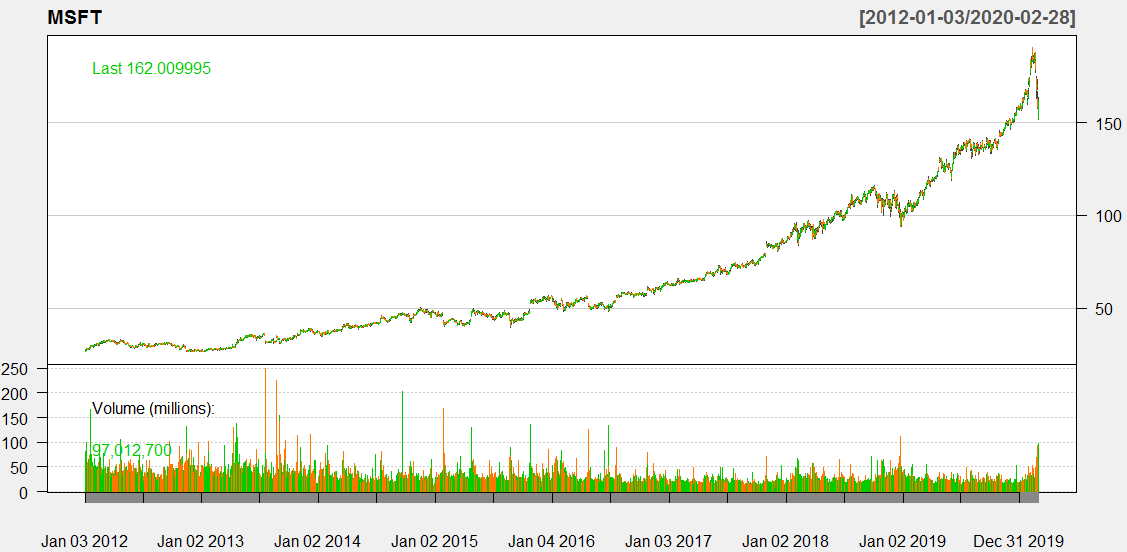
chartSeries(MSFT, theme=chartTheme('white'))
Cl(MSFT)   #closing prices

Op(MSFT)    #open prices

Hi(MSFT)    #daily highest price

Lo(MSFT)    #daily lowest price

ClCl(MSFT)  #close-to-close daily return

Ad(MSFT)    #daily adjusted closing price
Subset to obtain period of interests ,while the downloaded prices are supposed to be nonstationary series and should be transformed into stationary series:
#indexing time series data

DTB3.sub <- DTB3['2012-01-02/2020-02-29']

#Calculate returns from Adjusted log series

SNP.ret  <- diff(log(Ad(SNP)))

MSFT.ret <- diff(log(Ad(MSFT)))

#replace NA values

DTB3.sub[is.na(DTB3.sub)] <- 0

DTB3.sub <- na.omit(DTB3.sub) # return with incomplete removed

# merge the three databases to get the same length

# innerjoin returns only rows in which one set have matching keys in the other

dataDaily <- na.omit(merge(SNP.ret,MSFT.ret,DTB3.sub), join='inner')
VAR modeling usually deals with lower frequency data, so transform data to monthly (or quarterly) frequency.
#obtain monthly data, package xts

SNP.M  <- to.monthly(SNP.ret)$SNP.ret.Close

MSFT.M <- to.monthly(MSFT.ret)$MSFT.ret.Close

DTB3.M <- to.monthly(DTB3.sub)$DTB3.sub.Close
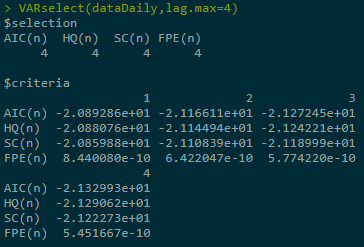
# allow a max of 4 lags

# choose the model with best(lowest Akaike Information Criterion value)

var1 <- VAR(dataDaily, lag.max=4, ic="AIC")
Or see multiple information criteria:
VARselect(dataDaily,lag.max=4)
summary(var1)


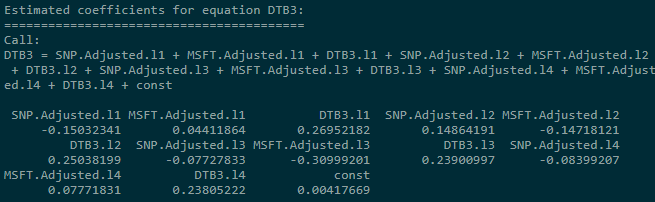
coef(var1) #concise summary of the estimated variables

residuals(var1) #list of residuals (of the corresponding ~lm)

fitted(var1)    #list of fitted values

Phi(var1)   #coefficient matrices of VMA representation

plot(var1, plot.type='multiple') #Diagram of fit and residuals for each variables
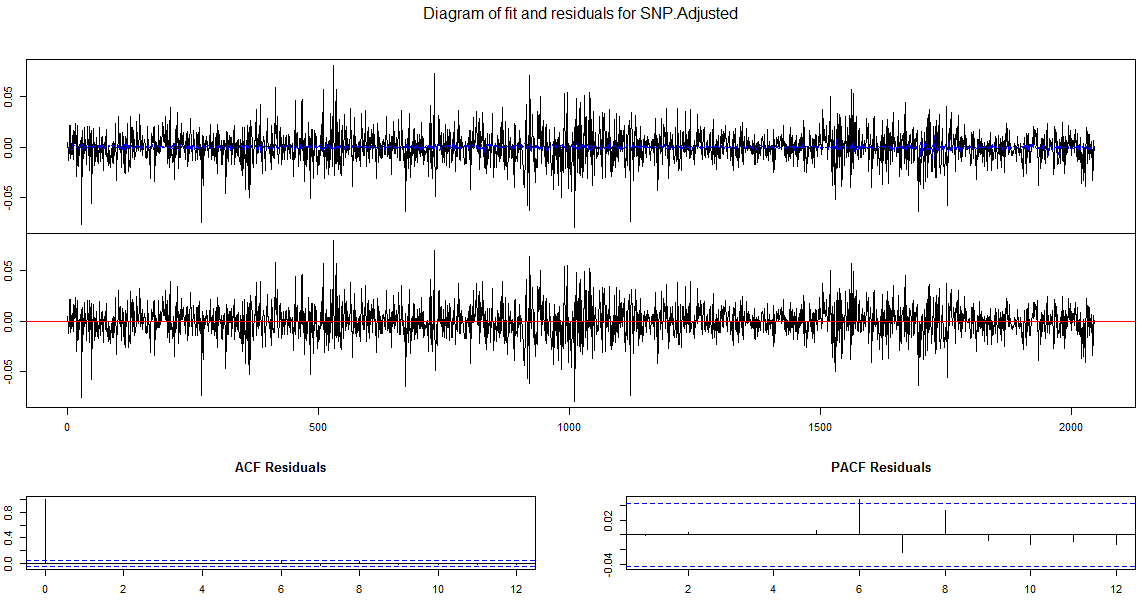
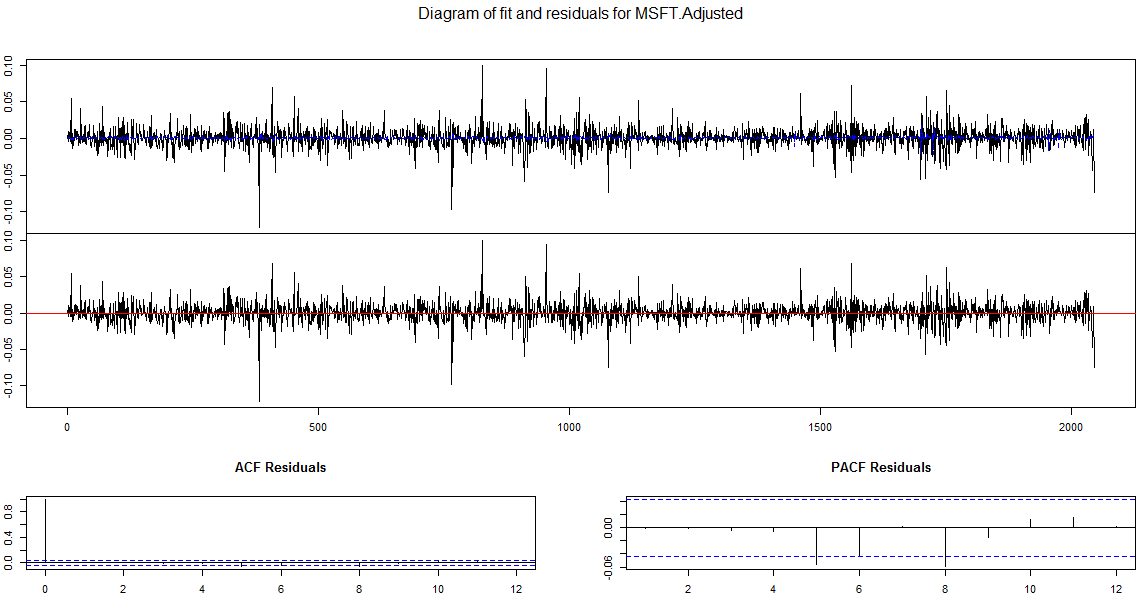
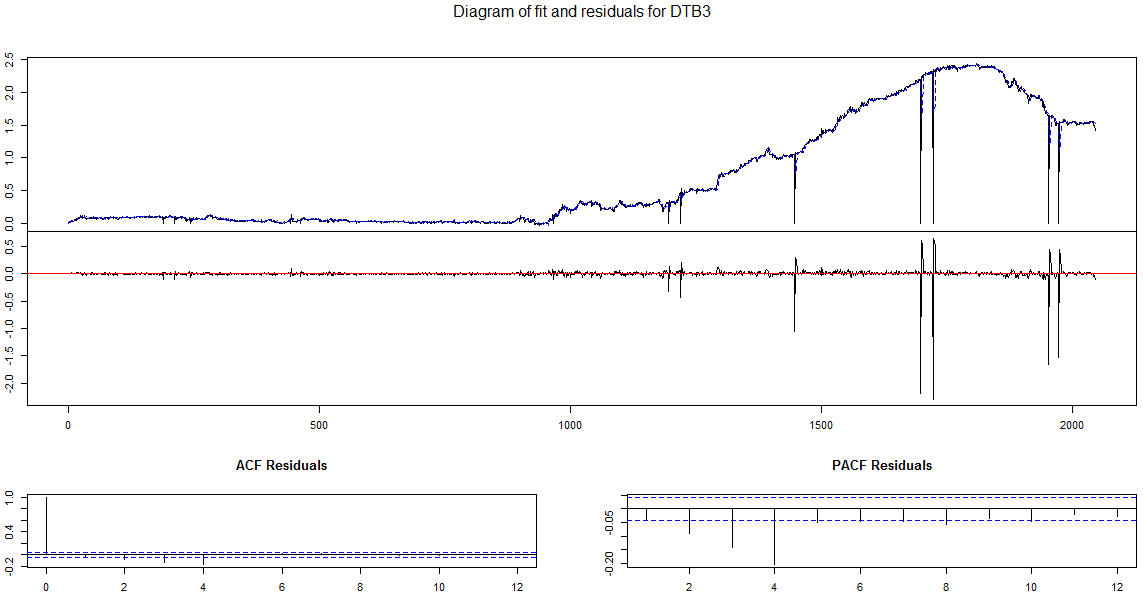
#confidence interval for bootstrapped error bands

var.irf <- irf(var1, ci=0.9)

plot(var.irf)
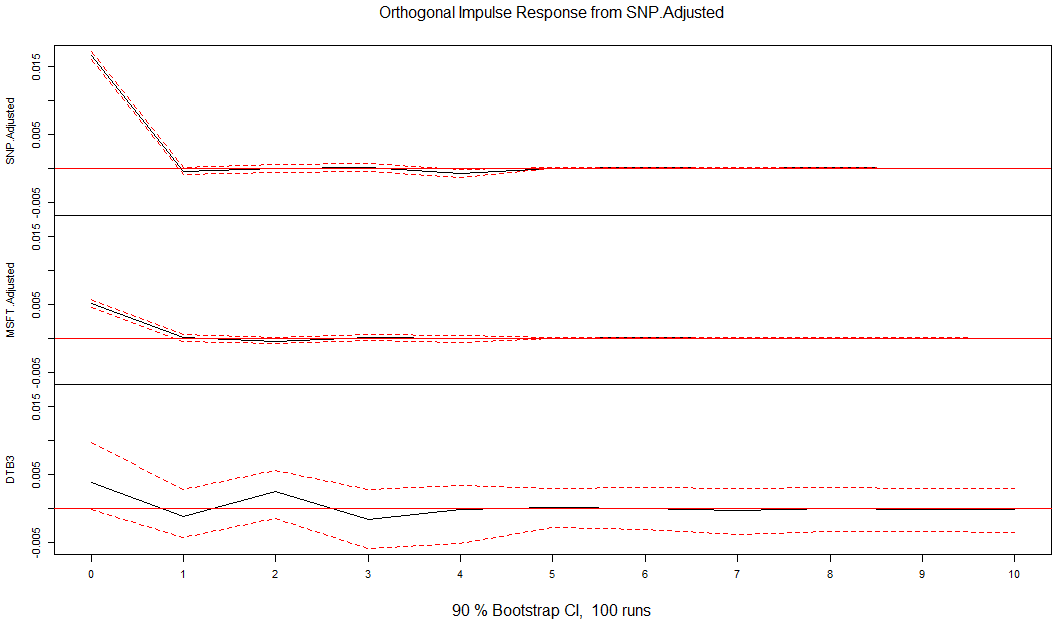
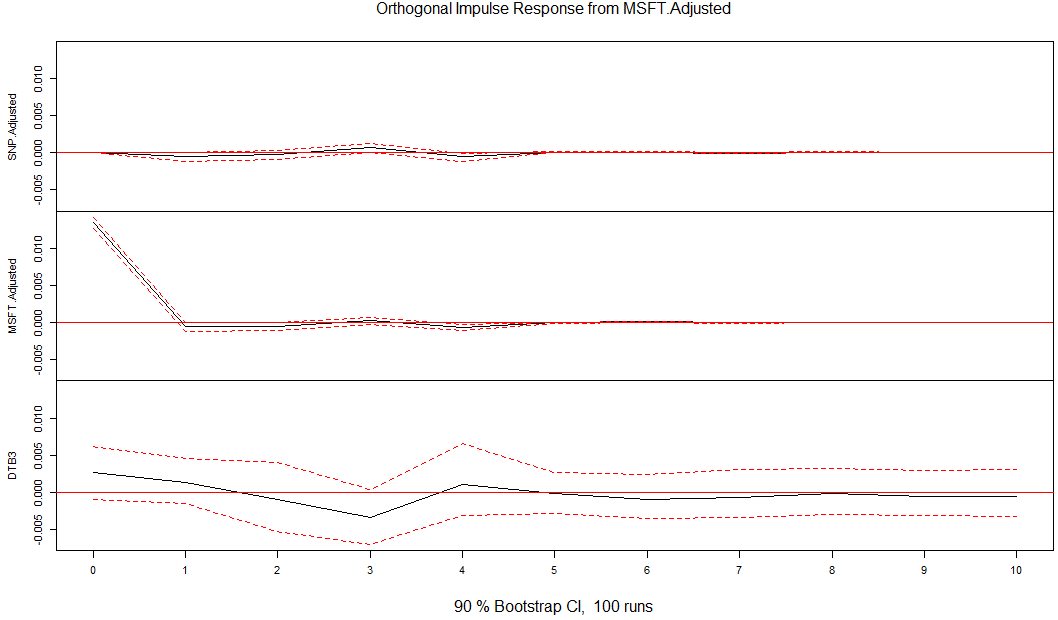
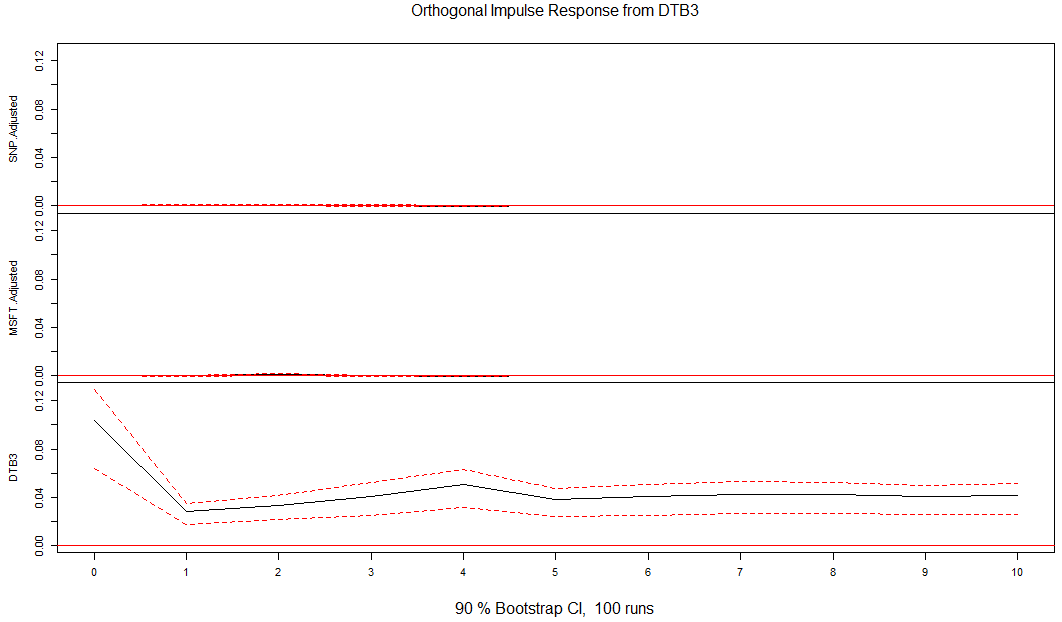
Number of required restrictions for SVAR model is K(K-1)/2, so in our case is 3.
Time Series_2_Multivariate_TBC!!!!的更多相关文章
随机推荐
- 页面分享功能,分享好友、朋友圈判断,用share_type做标记 这里用的是jweixin-1.3.2.js
这里用的是jweixin-1.3.2.js trigger: function (res) { //判断分享的状态,好友.朋友圈 localStorage.setItem("share_ty ...
- 吴裕雄--天生自然Numpy库学习笔记:NumPy 高级索引
import numpy as np x = np.array([[1, 2], [3, 4], [5, 6]]) y = x[[0,1,2], [0,1,0]] print (y) import n ...
- Nexus-配置vPC 实验二
实验一中介绍的是单面的vPC,本实验配置的是dual site(双面vPC),这样的情况将上下的Port-channel都配置在了同一vPC下面. 实验拓扑如下: N5K-1配置:N5K-1(conf ...
- 【原】mac电脑常用快捷建
wiki:http://www.wjjsoft.com/mybase_cn.html 1.终端 有时一个终端并不够,如何快速打开多个呢,在上部打开之伤的基础下,直接按快捷键command+N即可 一个 ...
- 推荐一款好用的博客离线编辑工具——OpenLiveWriter
1.前言 我们自己一般在写博客的时候都是在博客官网后台写的,但是如果要在多个平台发布博客的话,那就要复制好前面写好的博客,然后再去其它博客平台发布,可见非常的麻烦. 这里推荐一款好用的离线多功能,多平 ...
- Update(stage3):第1节 redis组件:1 - 3、web发展历史以及redis简介
Redis课程教案 1. NoSQL数据库的发展历史简介 1.web系统的变迁历史 web1.0时代简介 基本上就是一些简单的静态页面的渲染,不会涉及到太多的复杂业务逻辑,功能简单单一,基本上服务器性 ...
- pyputer安装使用
pip install jupyter 请在终端(Mac / Linux)或命令提示符(Windows)上运行以下命令: jupyter notebook 登录地址在cmd安装运行完jupyter n ...
- Start from here: <<OpenGL的基本程序解析>>
这是我的第一篇学习OpenGL的笔记,也是博主的第一篇博客,希望能够在这里和大家一起成长. 下面的代码是<OpenGL超级宝典(第五版)>中的示例代码,基本程序如下: #include & ...
- Python - 代码片段,Snippets,Gist
说明 代码片段来自网上搬运的或者自己写的 华氏温度转摄氏温度 f = float(input('请输入华氏温度: ')) c = (f - 32) / 1.8 print('%.1f华氏度 = %.1 ...
- Java 代码中如何调用 第三方Api
在代码中调用第三方API 获取数据 package com.example.demo.utils; import com.alibaba.fastjson.JSONObject; import lom ...