使用Prometheus监控SpringBoot应用
通过之前的文章我们使用Prometheus监控了应用服务器node_exporter,数据库mysqld_exporter,今天我们来监控一下你的应用。(本文以SpringBoot 2.1.9.RELEASE 作为监控目标)
编码
添加依赖
使用Prometheus监控SpringBoot应用只需要在pom文件添加如下两个依赖:
<dependency>
    <groupId>org.springframework.boot</groupId>
    <artifactId>spring-boot-starter-actuator</artifactId>
</dependency>
<dependency>
    <groupId>io.micrometer</groupId>
    <artifactId>micrometer-registry-prometheus</artifactId>
</dependency>
修改配置
修改application.properties或者application.yml文件,对外暴露监控端点
spring.application.name = blog
management.endpoints.web.exposure.include = prometheus
management.metrics.tags.application = ${spring.application.name}
启动应用
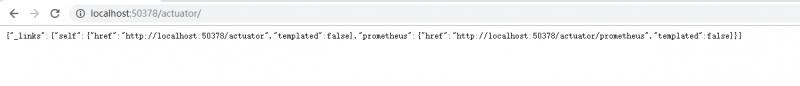
访问http://localhost:50378/actuator/查看开放端点
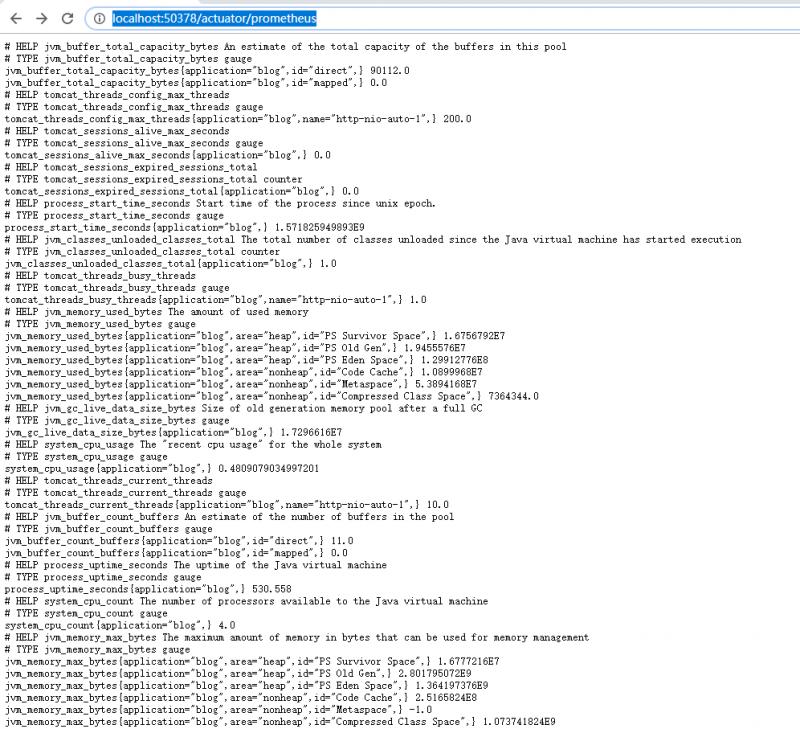
访问http://localhost:50378/actuator/prometheus查看Metrics
之前的文章中都是监控一个实例,这次咱们把端口设置成随机,启动两个实例,等下看看监控效果。
监控配置
Prometheus
修改prometheus.yml,增加监控任务
- job_name: 'SpringBoot'
metrics_path: '/actuator/prometheus'
static_configs:
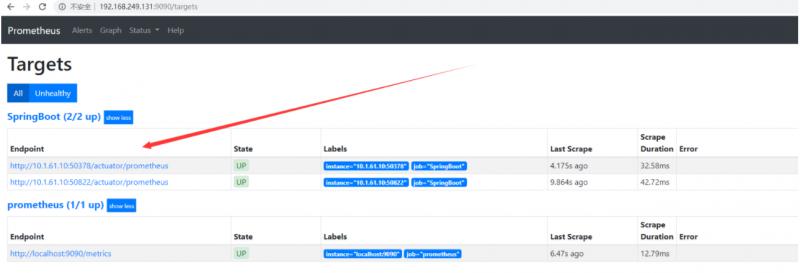
- targets: ['10.1.61.10:50378','10.1.61.10:50822']重启Prometheus,查看监控状态。
Grafana
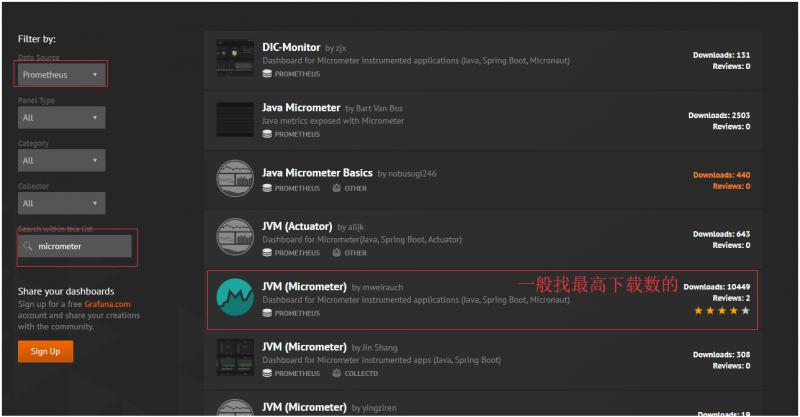
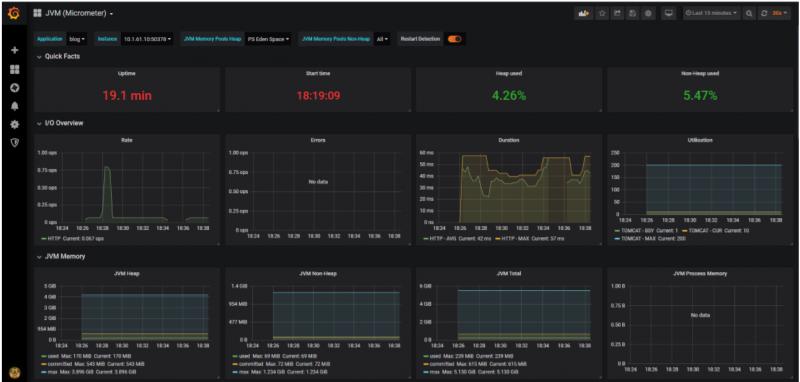
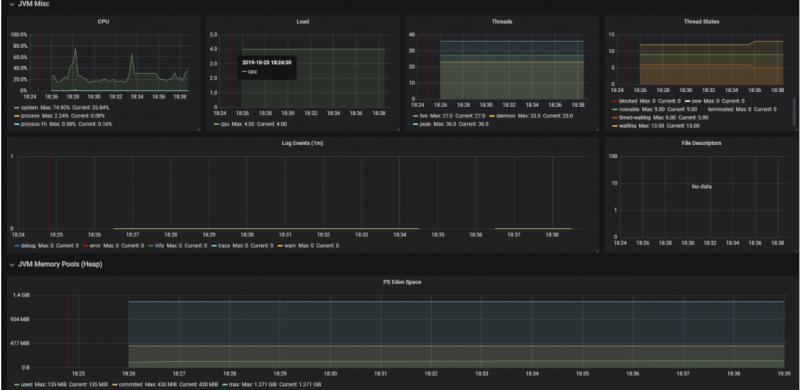
直接从grafana官网寻找JVM监控DashBoard,然后导入到Grafana中(在环境搭建篇中已经讲述了操作过程,这里就不再赘述)。
查看效果
彩蛋
我们关掉其中一个SpringBoot实例,等2分钟,然后邮箱会收到这样一封告警邮件
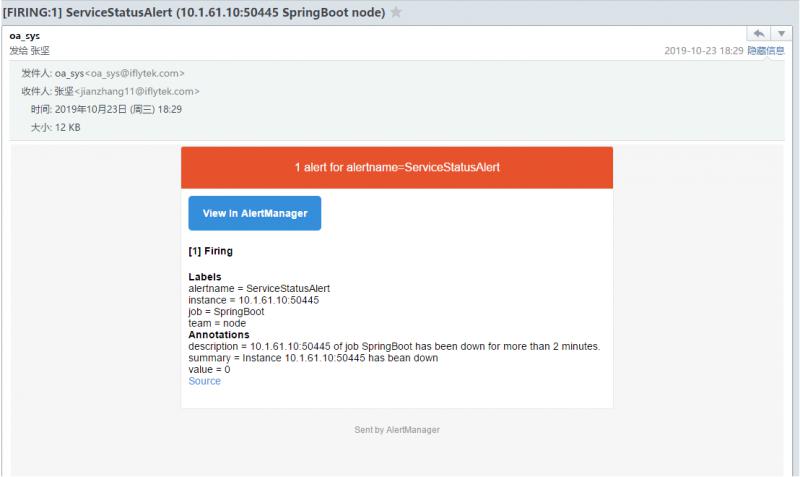
怎么实现的呢?咱们下期有缘再见!
相关文章
-
请关注个人公众号:JAVA日知录

使用Prometheus监控SpringBoot应用的更多相关文章
- Prometheus+Grafana监控SpringBoot
Prometheus+Grafana监控SpringBoot 一.Prometheus监控SpringBoot 1.1 pom.xml添加依赖 1.2 修改application.yml配置文件 1. ...
- SpringBoot使用prometheus监控
本文介绍SpringBoot如何使用Prometheus配合Grafana监控. 1.关于Prometheus Prometheus是一个根据应用的metrics来进行监控的开源工具.相信很多工程都在 ...
- Prometheus + Grafana 监控SpringBoot应用
一.用到的工具 Prometheus Grafana Micrometer Grafana Dashboard (4701) 二.安装和运行Prometheus 官网下载prometheus- ...
- 【Springboot】用Prometheus+Grafana监控Springboot应用
1 简介 项目越做越发觉得,任何一个系统上线,运维监控都太重要了.关于Springboot微服务的监控,之前写过[Springboot]用Springboot Admin监控你的微服务应用,这个方案可 ...
- Grafana+Prometheus打造springboot监控平台
1. 环境 springboot 1.5.10.RELEASE Grafana 5.4.2 Prometheus 2.6.0 jdk 1.8 2.通过micrometer与springboot应用和p ...
- SpringCloud使用Prometheus监控(基于Eureka)
本文介绍SpringCloud使用Prometheus,基于Eureka服务发现. 1.Prometheus介绍 在之前写过两篇有关Prometheus使用的文章,如下: <SpringBoot ...
- Prometheus 监控报警系统 AlertManager 之邮件告警
转载自:https://cloud.tencent.com/developer/article/1486483 文章目录1.Prometheus & AlertManager 介绍2.环境.软 ...
- prometheus监控系统
关于Prometheus Prometheus是一套开源的监控系统,它将所有信息都存储为时间序列数据:因此实现一种Profiling监控方式,实时分析系统运行的状态.执行时间.调用次数等,以找到系统的 ...
- Kubernetes集群部署史上最详细(二)Prometheus监控Kubernetes集群
使用Prometheus监控Kubernetes集群 监控方面Grafana采用YUM安装通过服务形式运行,部署在Master上,而Prometheus则通过POD运行,Grafana通过使用Prom ...
随机推荐
- 安卓APP开发简单实例 结对编程心得
开始说起搞APP开发,自己和小伙伴的编程水平真的很低,无从下手,只有在网上找点案列,学习着怎样开发,结对编程还是面临着许多问题的,大家的水平有所差异和编程风格不同,我们用eclipse做了一个仿微信登 ...
- C#加载前生成静态网页
using System;using System.Collections.Generic;using System.Linq;using System.Web;using System.Web.UI ...
- F#周报2019年第38期
新闻 宣告.NET Core 3.0第一个候选版本 .NET Core 3.0第一个候选版本中ASP.NET Core与Blazor的更新 F#的就业市场情形如何 Finalization实现细节 G ...
- 23种设计模式之装饰器模式(Decorator Pattern)
装饰器模式(Decorator Pattern) 允许向一个现有的对象添加新的功能,同时又不改变其结构.这种类型的设计模式属于结构型模式,它是作为现有的类的一个包装. 这种模式创建了一个装饰类,用来包 ...
- 手把手教你Pytest+Allure2.X定制报告详细教程,给自己的项目量身打造一套测试报告-02(非常详细,非常实用)
简介 前边一篇文章是分享如何搭建pytest+Allure的环境,从而生成一份精美的.让人耳目一新的测试报告,但是有的小伙伴或者童鞋们可能会问,我能不能按照自己的想法为我的项目测试结果量身打造一份属于 ...
- java-整型数值 用 16进制转换、2进制转换-Integer.toHexString
负数为什么要用补码表示 可以将符号位和其它位统一处理 减法也可按加法来处理 另外,两个用补码表示的数相加时,如果最高位(符号位)有进位,则进位被舍弃 正数:原码.反码.补码相同. 负数:反码符号位不变 ...
- 容器技术----------->Docker
1. 虚拟化 1)什么是虚拟化 在计算机中,虚拟化(英语:Virtualization)是一种资源管理技术,是将计算机的各种 实体资源,如服务器.网络.内存及存储等,予以抽象.转换后呈现出来,打破实体 ...
- Python实现几种简单的排序算法
一.冒泡排序 概念:为一个无序的列表排成有序的 实现过程描述:(升序) 1.比较相邻的元素,如果第一个比第二个大,就交换他们的位置 2.对每一对相邻元素重复1的工作,从开始第一队到最后一对,最后结束的 ...
- 在 Vue-cli 创建的项目中引入 Element-UI
Element-UI 是饿了么前端团队退出了一套基于 vue.js 开发的 UI 组件库,在与 Vue-cli 创建的项目结合时,需要做以下配置: 1. 安装 loader 模块 cnpm insta ...
- Java 学习笔记之 Daemon线程
Daemon线程: 线程: 用户线程 守护线程 守护线程是一种特殊的线程,在进程中不存在非守护线程了,则守护线程自动销毁. public class DaemonThread extends Thre ...