
cpu-z for ubuntu 12.04 64bit : cpu-g
wget https://launchpad.net/~phantomas/+archive/ppa/+files/cpu-g_0.9.0_amd64.deb

sudo dpkg -i cpu-g*.deb

http://www.linux.com/learn/tutorials/620416:discovering-and-monitoring-hardware-in-linux-
Discovering and Monitoring Hardware in Linux
 Exclusive
Nothing ever need be a mystery on Linux as it has a large number of excellent utilities for discovering hardware and monitoring hardware health. Here are a handful of good tools for spotting possible hard drive failure, displaying hardware information and monitoring temperatures, fans, voltages, email, music players and more.

GSmartControl provides an excellent graphical interface to smartmontools.
Hard Drive Health
You're probably familiar with the excellent smartmontools for monitoring hard drive health, and getting early warning of possible drive failure. Smartmontools runs tests and reads data on drives that have the Self-Monitoring, Analysis and Reporting Technology (S.M.A.R.T.) system built into them. It's been around seemingly forever, but did you know there is a graphical interface for it? SmartControl puts a nice interface on smartmontools and supports all of its functions.
You can run a short or long self-test with a button click, and GSmartControl is especially valuable for quickly and easily finding log files and reading SMART attributes data, reading test results, and seeing detailed data on your hard drives.
Monitoring and Alerting
It's not fun when your first warning of a failed CPU fan is a melted-down CPU. lm-sensors is still my top choice for monitoring temperatures, fans, and voltages:
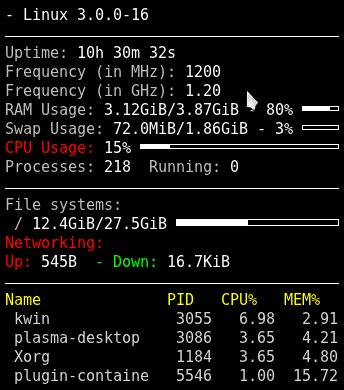
A simple Conky setup.
 $ sensors

atk0110-acpi-0

Adapter: ACPI interface

Vcore Voltage:      +1.23 V  (min =  +0.85 V, max =  +1.60 V)

 +3.3 Voltage:      +3.31 V  (min =  +2.97 V, max =  +3.63 V)

 +5 Voltage:        +4.97 V  (min =  +4.50 V, max =  +5.50 V)

 +12 Voltage:      +12.15 V  (min = +10.20 V, max = +13.80 V)

CPU FAN Speed:     3183 RPM  (min =  600 RPM)

CPU Temperature:    +44.0°C  (high = +60.0°C, crit = +95.0°C)

MB Temperature:     +40.0°C  (high = +45.0°C, crit = +75.0°C)
I wish for a nice graphical front-end and alerter to lm-sensors; GNOME and KDE release nice ones and then they disappear. Xsensors is simple, the xfce4-sensors-plugin looks great in XFCE, and the KDE4 System Monitor widget is all right, but it's not very configurable and does no alerting. psensor is a rather nice, and it can run as a server for remote monitoring. GKrellM is an old favorite cram-full of features, alerting, and configurability.
Conky takes the prize for most objects supported. In addition to the usual system monitors it monitors email, music players, instant messaging, logfiles, weather forecast, and pretty much anything you want. If there isn't a plugin to do what you want you can write one.
Probing Hardware
It helps to know what is on your system, and you're probably familiar with the lscpi command for getting detailed information on everything connected to the PCI bus. Here are a few options you may not know about:
lspci with no options shows a hardware list with vendor names, chipsets, and device types.
lspci -k displays the kernel driver in use for each device, and available kernel modules, like this example for an Nvidia graphics card:
01:00.0 VGA compatible controller: nVidia Corporation G98 [GeForce 8400 GS] (rev a1)

        Subsystem: Micro-Star International Co., Ltd. Device 1162

        Kernel driver in use: nvidia

        Kernel modules: nvidia_current, nouveau, nvidiafb
lspci -t displays a tree view that shows the relationships between your devices.
The vendor names, chipsets, subsystems, device classes-- all the information displayed by lspci comes from a giant database, the PCI ID Repository. You can update your local copy of this database, /usr/share/misc/pci.ids, by running the update-pciids command as root.
Using dmidecode
dmidecode is a wonderful utility for getting information about everything on your motherboard without opening the case, or booting to the BIOS. If you run dmidecode with no options it spits out pages of data. You can select what you want to see by consulting the DMI types table in man dmidecode. Here are some examples.
How much RAM does your motherboard support?
$ sudo dmidecode -t 16

# dmidecode 2.9

SMBIOS 2.5 present.

Handle 0x0033, DMI type 16, 15 bytes

Physical Memory Array

        Location: System Board Or Motherboard

        Use: System Memory

        Error Correction Type: None

        Maximum Capacity: 16 GB

        Error Information Handle: Not Provided

        Number Of Devices: 4
How much RAM is installed, and in which slots? This example has most of the output snipped:
$ sudo dmidecode -t 17

# dmidecode 2.9

SMBIOS 2.5 present.

Handle 0x0035, DMI type 17, 27 bytes

Memory Device

        Total Width: 64 bits

        Data Width: 64 bits

        Size: 2048 MB

        Form Factor: DIMM

        Set: None

        Locator: DIMM0

        Bank Locator: BANK0

        Type: DDR2

        Type Detail: Synchronous

        Speed: 800 MHz (1.2 ns)
What are the onboard devices, such as video, networking, sound?
$ sudo dmidecode -t 10

# dmidecode 2.9

SMBIOS 2.5 present.

Handle 0x002C, DMI type 10, 6 bytes

On Board Device Information

        Type: Video

        Status: Enabled

        Description:   ATI

Handle 0x002D, DMI type 10, 6 bytes

On Board Device Information

        Type: Ethernet

        Status: Enabled

        Description: To Be Filled By O.E.M.

The graphical lshw viewer.
And much, much more, which is all detailed in the man page.
Using lshw
The lshw command also gives a detailed peek inside your PC, and you can invoke its graphical view with lshw -X (left). It's a little weird to navigate, but everything is there.
I like the way lshw presents information. It includes details like filesystem types and sizes, bus information, and capabilities. It has a couple of nice extras: the -sanitize option scrubs IP addresses, serial numbers, and other identifiers, and the -class option lets you choose categories such as volume and disk for block devices, memory, and display. Run lshw -short to see what the categories are. Here is an abbreviated example:
$ sudo lshw -short

H/W path         Device       Class       Description

=====================================================

/0/33/2                       memory      2GiB DIMM DDR2 Synchronous 800 MHz (1.2 ns

/0/33/3                       memory      DIMM [empty]

/0/100/a/0       eth0         network     RTL8111/8168B PCI Express Gigabit Ethernet

/0/100/11/0      /dev/sda     disk        2TB SAMSUNG HD204UI

/0/100/11/0/1    /dev/sda1    volume      1651GiB EXT4 volume

/0/100/11/0/2    /dev/sda2    volume      211GiB EXT4 volume

/0/100/11/1      /dev/sdb     disk        640GB WDC WD6401AALS-0

/0/100/11/1/1    /dev/sdb1    volume      27GiB EXT4 volume

/0/100/11/1/2    /dev/sdb2    volume      1907MiB Linux swap volume

/0/100/11/0.0.0  /dev/cdrom2  disk        iHAS424   B

/1               wlan0        network     Wireless interface
cpu-z for ubuntu 12.04 64bit : cpu-g的更多相关文章
- Ubuntu 12.04 64bit 配置完android 5.0编译环境后出现“could not write bytes: Broken pipe.”而无法进入输入帐号密码的登陆界面
Ubuntu 12.04 64bit 配置完android 5.0编译环境后出现“could not write bytes: Broken pipe.”而无法进入输入帐号密码的登陆界面.上网问了问百 ...
- Ubuntu 12.04 64bit GCC交叉编译器制作 原创
...
- build linaro 4.8 on ubuntu 12.04 64bit
安装必要的软件 sudo apt-get build-dep gcc binutils gdb sudo apt-get install curl gawk sudo apt-get install ...
- mark ubuntu 16.04 64bit + cpu only install mtcnn
大神代码链接 称之为MTCNN人脸检测算法,同时有大神已经GitHub上开源了其基于caffe的C++ API 的源代码,https://github.com/DaFuCoding/MTCNN_Caf ...
- 在Ubuntu 12.04 - 64bit中安装CodeSourcery时提示错误
安装时提示错误,Your 64-bit Linux host is missing the 32-bit libraries requied to install and use Sourcery C ...
- Ubuntu 12.04 64bit 安装编译GCC 4.1.2 绝对原创
1. 下载并解压源代码: wget http://mirrors.ustc.edu.cn/gnu/gcc/gcc-4.1.2/gcc-4.1.2.tar.bz2 tar jxvf gcc-4.1.2. ...
- ubuntu 12.04 64bit 安装 teamviewer 8.0
1. 在http://www.teamviewer.com下载teamviewer_linux_x64.deb 2.sudo dpkg -i teamviewer_linux_x64.deb 3.如果 ...
- Windows XP硬盘安装Ubuntu 12.04双系统图文详解
Windows XP硬盘安装Ubuntu 12.04双系统图文详解 Ubuntu 12.04 LTS版本于2012年4月26日发布,趁着五一放假,赶紧在自己的Windows XP的电脑上安装下Ubun ...
- Ubuntu 12.04 安装MySQL
本文地址:http://www.cnblogs.com/yhLinux/p/4012689.html 本文适合新手入门. 本文是对 Ubuntu 12.04 环境下安装 MySQL 的记录,通过这两天 ...
随机推荐
- 1.0 poi单元格合合并及写入
最近项目中用到poi生成Excel时,用到了单元格合并,于是参考了http://www.anyrt.com/blog/list/poiexcel.html写的文章,但是其中有些地方不是很清楚,于是自己 ...
- 关于Python中的ifelse、while和for循环的简单小结
1.ifelse 1.1首先简单编辑一个关于ifelse的程序: _username = 'yanfeixu' _password = 'wuyifan' username = input(" ...
- (转)SPI时钟极性、时钟相位
SPI协议是一个 4 线.全双工的串口协议.根据串口时钟SCLK的相位SCPH和极性SCPOL的不同,有 4 种组合. CPOL CPHA MODE0 0 0 MODE1 0 1 MODE2 1 0 ...
- ubuntu16.04安装nvidia ,cuda(待完善)
ubuntu16.04安装nvidia 1.首先查看自己的pc显卡的型号 ubuntu16.04 查看方法: 查看GPU型号 :lspci | grep -i nvidia 查看NVIDIA驱动版本: ...
- Transcranial magnetic stimulation (TMS)
Transcranial magnetic stimulation (TMS) Effect of Transcranial Magnetic Stimulation on Free Will Tra ...
- pandas dataframe的合并(append, merge, concat)
创建2个DataFrame: >>> df1 = pd.DataFrame(np.ones((4, 4))*1, columns=list('DCBA'), index=list(' ...
- android--------自定义控件 之 组合控件篇
上篇介绍了自定义控件的自定义属性篇,地址:http://www.cnblogs.com/zhangqie/p/8969163.html 这篇博文主要来说说 自定义控件的组合控件来提高布局的复用 使用自 ...
- xml的解构与组装
xml的结构 <xml> <ToUserName><![CDATA[%s]]></ToUserName> <FromUserName>< ...
- memtrack: Couldn't load memtrack module (No such file or directory) 的问题解决
通过了编译,可是在模拟器运行时,却出现stopping…….查看logcat,发现出现错误: E/memtrack: Couldn't load memtrack module (No such fi ...
- mysql 8.0.12 修改root密码
use mysql: ALTER USER 'root'@'localhost' IDENTIFIED WITH mysql_native_password BY '新密码'; FLUSH PRIVI ...