jfreechart环形图完美实现
邮件发送由于不支持js,项目只能在后台生成环形图,用jfreechart完全可以实现,即:RingPlot。
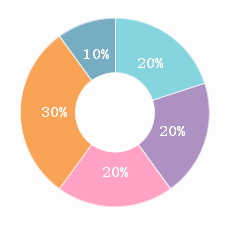
这就拿jfreechart生成的最终效果,依赖jar包jfreechart,如果有任何细节还需要调整,强烈建议去读API或者看源码,这里直接上实现代码了
import java.awt.Color;

import java.awt.Font;

import java.awt.Paint;

import java.awt.image.BufferedImage;

import java.io.ByteArrayInputStream;

import java.io.ByteArrayOutputStream;

import java.io.File;

import java.io.FileNotFoundException;

import java.io.FileOutputStream;

import java.io.IOException;

import javax.imageio.ImageIO;

import org.jfree.chart.ChartFactory;

import org.jfree.chart.ChartUtilities;

import org.jfree.chart.JFreeChart;

import org.jfree.chart.labels.StandardPieSectionLabelGenerator;

import org.jfree.chart.plot.DefaultDrawingSupplier;

import org.jfree.chart.plot.RingPlot;

import org.jfree.data.general.DefaultPieDataset;

import org.jfree.data.general.PieDataset;

public class RingChart {

    public RingChart() {

        this.createChart();

    }

    @SuppressWarnings("deprecation")

    public void createChart() {

        JFreeChart chart = ChartFactory.createRingChart(null, this.createDataset(), true, false, false);

        chart.getLegend().setVisible(false);

        // 环形图

        RingPlot ringplot = (RingPlot) chart.getPlot();

        ringplot.setOutlineVisible(false);

        //{2}表示显示百分比

        ringplot.setLabelGenerator(new StandardPieSectionLabelGenerator("{2}"));

        ringplot.setBackgroundPaint(new Color(253,253,253));

        ringplot.setOutlineVisible(false);

        //设置标签样式

        ringplot.setLabelFont(new Font("宋体", Font.BOLD, 15));

        ringplot.setSimpleLabels(true);

        ringplot.setLabelLinkPaint(Color.WHITE);

        ringplot.setLabelOutlinePaint(Color.WHITE);

        ringplot.setLabelLinksVisible(false);

        ringplot.setLabelShadowPaint(null);

        ringplot.setLabelOutlinePaint(new Color(0,true));

        ringplot.setLabelBackgroundPaint(new Color(0,true));

        ringplot.setLabelPaint(Color.WHITE);

        ringplot.setSectionOutlinePaint(Color.WHITE);

        ringplot.setSeparatorsVisible(true);

        ringplot.setSeparatorPaint(Color.WHITE);

        ringplot.setShadowPaint(new Color(253,253,253));

        ringplot.setSectionDepth(0.58);

        ringplot.setStartAngle(90);

        ringplot.setDrawingSupplier(new DefaultDrawingSupplier(

                new Paint[] {

                        new Color(134, 212, 222),

                        new Color(174, 145, 195),

                        new Color(255, 162, 195),

                        new Color(249, 163, 86),

                        new Color(119, 173, 195)

                        },

                DefaultDrawingSupplier.DEFAULT_OUTLINE_PAINT_SEQUENCE,

                DefaultDrawingSupplier.DEFAULT_STROKE_SEQUENCE,

                DefaultDrawingSupplier.DEFAULT_OUTLINE_STROKE_SEQUENCE,

                DefaultDrawingSupplier.DEFAULT_SHAPE_SEQUENCE));

        FileOutputStream fos_jpg = null;

        try {

            fos_jpg = new FileOutputStream("d:\\ring.png");

            ChartUtilities.writeChartAsPNG(fos_jpg,chart, 235, 230, null);

            System.out.println("成功");

       //以下由于jfreechart设置背景色后,背景会有留白,直接将目标图片截取

            ByteArrayOutputStream baos = new ByteArrayOutputStream();

            ChartUtilities.writeChartAsPNG(baos,chart, 240, 230, null);

            BufferedImage bi = ImageIO.read(new ByteArrayInputStream(baos.toByteArray()));

            BufferedImage sub = bi.getSubimage(5, 0, 230, 225);

            ImageIO.write(sub, "png", new File("d:\\ring_sub.png"));

        } catch (FileNotFoundException e) {

            e.printStackTrace();

        } catch (IOException e) {

            e.printStackTrace();

        } finally {

            try {

                fos_jpg.close();

            } catch (Exception e) {

                System.out.println(e.getMessage());

            }

        }

    }

   //测试数据

    public PieDataset createDataset() {

        DefaultPieDataset dataSet = new DefaultPieDataset();

        int i, j;

        String[] key = { "私募股权","房地产","基金","现金宝宝","股票" };

        int[] value = { 20, 20, 20, 30, 10 };

        for (i = 0, j = 0; i < name.length && j < value.length; i++, j++) {

            dataSet.setValue(name[i], value[j]);

        }

        return dataSet;

    }

    public static void main(String[] args) {

        new RingChart();

    }

}
jfreechart环形图完美实现的更多相关文章
- echarts实现环形图
前端框架使用的angular,使用echarts实现环形图 1. item.component.html <div id="box1" class="pie&quo ...
- 数据输入——生成你需要的echart图(堆积柱状图、扇形图、嵌套环形图)
最近论文需要一些比较直观的图表, 发现echart做出来的图还是比较美观的,这里介绍如何修改数据生成你需要的echart图. 1.堆积柱状图: http://echarts.baidu.com/exa ...
- echart 折线图、柱状图、饼图、环形图颜色修改
之前在做报表的时候用过echart 用完也就完了,而这次在用的时候已经忘了,所以这里简单记录一下,好记性不如烂笔头!!! 1.折线图修改颜色: xAxis: { type: 'category', b ...
- iOS 画环形图
由于新项目的的需求,需要画环形图,由于以前都没接触过这一类(我是菜鸟),去cocochina山找到了一个案例,个人觉得还可以,分享一下 github 地址https://github.com/zhou ...
- 修改echarts环形图的牵引线及文字位置
修改echarts环形图的牵引线及文字位置,下面代码及效果不仅如此,也包含了其它的效果哦.有问题可以留言. 根据echarts官方示例修改效果: 官方示例图: 修改效果图: 直接上代码:其它不多说. ...
- vue 结合 Echarts 实现半开环形图
Echarts 实现半开环形图 1.先看看实现的图 2.HTML部分 创建id 是 chart 的div标签. <div class="content-item"> & ...
- echarts白色实心环形图(空心饼图)的编写
// 数据接入机构统计let myDom = document.getElementById('myChart');let myWidth = myDom.offsetWidth - 5; // 获取 ...
- Qt编写自定义控件41-自定义环形图
一.前言 自定义环形图控件类似于自定义饼状图控件,也是提供一个饼图区域展示占比,其实核心都是根据自动计算到的百分比绘制饼图区域.当前环形图控件模仿的是echart中的环形图控件,提供双层环形图,有一层 ...
- 数据可视化基础专题(十三):Matplotlib 基础(五)常用图表(三)环形图、热力图、直方图
环形图 环形图其实是另一种饼图,使用的还是上面的 pie() 这个方法,这里只需要设置一下参数 wedgeprops 即可. 例子一: import matplotlib.pyplot as plt ...
随机推荐
- devi into python 笔记(二)元组 变量声明 和列表解析
元组tuple: 类似list,只是tuple是不可变的list.类似java的String都是不可改变的.注意:tuple没有方法(有待考证),不可以像list那样那个list.pop 或者list ...
- Java---俄罗斯方块小游戏
去年就已经学了这个技术了,一直没去写,现在抽个时间写了个俄罗斯方块游戏. 只有简单的新游戏,暂停,继续,积分功能.简单的实现了俄罗斯的经典功能. 不介绍了,有兴趣的自己运行一下,后面贴出了图片. 代码 ...
- linux 命令拾遗
man ascii 这个命令会打印出八进制.十六进制和十进制的ASCII码表. xxd xxd可以生成所给与文件的十六进制拷贝,也可以将编辑好的十六进制拷贝还原成二进制格式.它也可以将十六进制拷贝输出 ...
- 问题-[WIN764位系统]操作UDL驱动不全处理
http://www-01.ibm.com/support/docview.wss?uid=swg21503768 方法# 1 单击“开始——运行” 输入一个命令类似如下: C:\Win ...
- 李炎恢bootstarp_项目实战__瓢城企业(注释+源码)
源代码下载地址:http://pan.baidu.com/s/1gfI9Pj9 /********************************* pc界面设备页面***************** ...
- ZBar只扫描二维码/条形码
You can add these codes for ImageScanner scanner.setConfig(0, Config.ENABLE, 0); //Disable all the S ...
- 【剑指Offer学习】【面试题14 :调整数组顺序使奇数位于偶数前面】
题目:输入一个整数数组,实现一个函数来调整该数组中数字的顺序.使得全部奇数位于数组的前半部分.全部偶数位予数组的后半部分. 这个题目要求把奇数放在数组的前半部分, 偶数放在数组的后半部分,因此全部的奇 ...
- Redis集群服务器-高可用调研随笔[转]
今天改了一天的Bug,本想下午开始专研Redis命令集,结果也泡汤了.只能在下班的路上考虑下Redis集群服务器的高可用方案.随笔而已,尚未成型,仅作记录. 当然,我说的可能比较片面,欢迎拍砖.斧正. ...
- ffprobe使用具体解释
夹 1. 语法 2. 描写叙述 3. 选项 3.1 流指示符 3.2 通用选项 3.3 音视频选项 3.4 主选项 4. 写入器 4.1 默认值 4.2 compact, csv 4.3 flat 4 ...
- springMVC工作原理图