【原创】运维基础之Zabbix(1)简介、安装、使用
zabbix 4

官方:https://www.zabbix.com/
一 简介
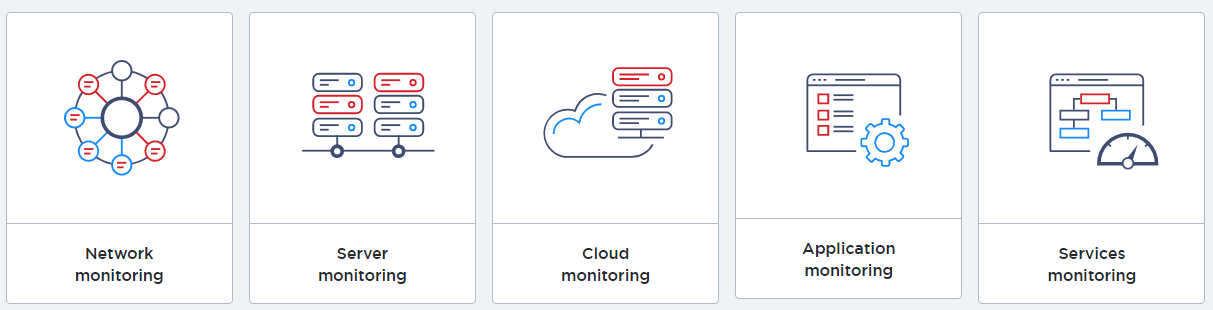
Monitor anything
Solutions for any kind of IT infrastructure, services, applications, resources
监控一切
Enterprise-ready
Mature, enterprise-level platform to monitor large-scale IT environments
成熟的企业级监控平台
Zabbix is an enterprise-class open source distributed monitoring solution.
zabbix是一个开源的分布式的企业级监控方案;
Zabbix is software that monitors numerous parameters of a network and the health and integrity of servers. Zabbix uses a flexible notification mechanism that allows users to configure e-mail based alerts for virtually any event. This allows a fast reaction to server problems. Zabbix offers excellent reporting and data visualisation features based on the stored data. This makes Zabbix ideal for capacity planning.
Zabbix supports both polling and trapping. All Zabbix reports and statistics, as well as configuration parameters, are accessed through a web-based frontend. A web-based frontend ensures that the status of your network and the health of your servers can be assessed from any location. Properly configured, Zabbix can play an important role in monitoring IT infrastructure. This is equally true for small organisations with a few servers and for large companies with a multitude of servers.
角色
1 Server (zabbix-server)
Zabbix server is the central component to which agents report availability and integrity information and statistics. The server is the central repository in which all configuration, statistical and operational data are stored.
2 Agent (zabbix-agent)
Zabbix agents are deployed on monitoring targets to actively monitor local resources and applications and report the gathered data to Zabbix server.
3 Database storage (mysql)
All configuration information as well as the data gathered by Zabbix is stored in a database.
4 Web interface (httpd)
For an easy access to Zabbix from anywhere and from any platform, the web-based interface is provided. The interface is part of Zabbix server, and usually (but not necessarily) runs on the same physical machine as the one running the server.
5 Proxy(可选)
Zabbix proxy can collect performance and availability data on behalf of Zabbix server. A proxy is an optional part of Zabbix deployment; however, it may be very beneficial to distribute the load of a single Zabbix server.
二 安装
1 yum安装
# rpm -Uvh https://repo.zabbix.com/zabbix/4.0/rhel/7/x86_64/zabbix-release-4.0-1.el7.noarch.rpm
agent安装
# yum install zabbix-agentserver安装
# yum install zabbix-server-mysql zabbix-web-mysql zabbix-agent
2 初始化db
mysql> create database zabbix character set utf8 collate utf8_bin;
mysql> grant all privileges on zabbix.* to zabbix@'%' identified by 'password';# zcat /usr/share/doc/zabbix-server-mysql*/create.sql.gz | mysql -h$ip -uzabbix -p zabbix
3 启动server
# vi /etc/zabbix/zabbix_server.conf
DBHost=$ip
DBPassword=password# vi /etc/httpd/conf.d/zabbix.conf
php_value date.timezone Asia/Shanghai# systemctl restart zabbix-server httpd
# systemctl enable zabbix-server httpd
4 启动agent
# vi /etc/zabbix/zabbix_agentd.conf
Server=$server_ip
ServerActive=$server_ip# systemctl restart zabbix-agent
# systemctl enable zabbix-agent
参考:https://www.zabbix.com/download?zabbix=4.0&os_distribution=centos&os_version=7&db=mysql
三 使用
访问 http://$server_ip/zabbix 进入设置向导

设置db

设置完成之后
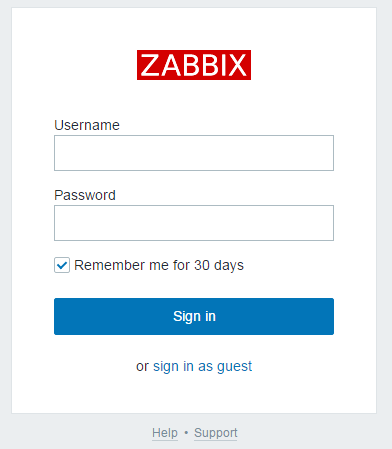
默认用户密码:Admin/zabbix
ps:如果登录之后发现zabbix server is not running,10051端口也没有绑定,极有可能是是连接db不通;
参考:https://www.zabbix.com/documentation/4.0/manual/installation/install#installing_frontend
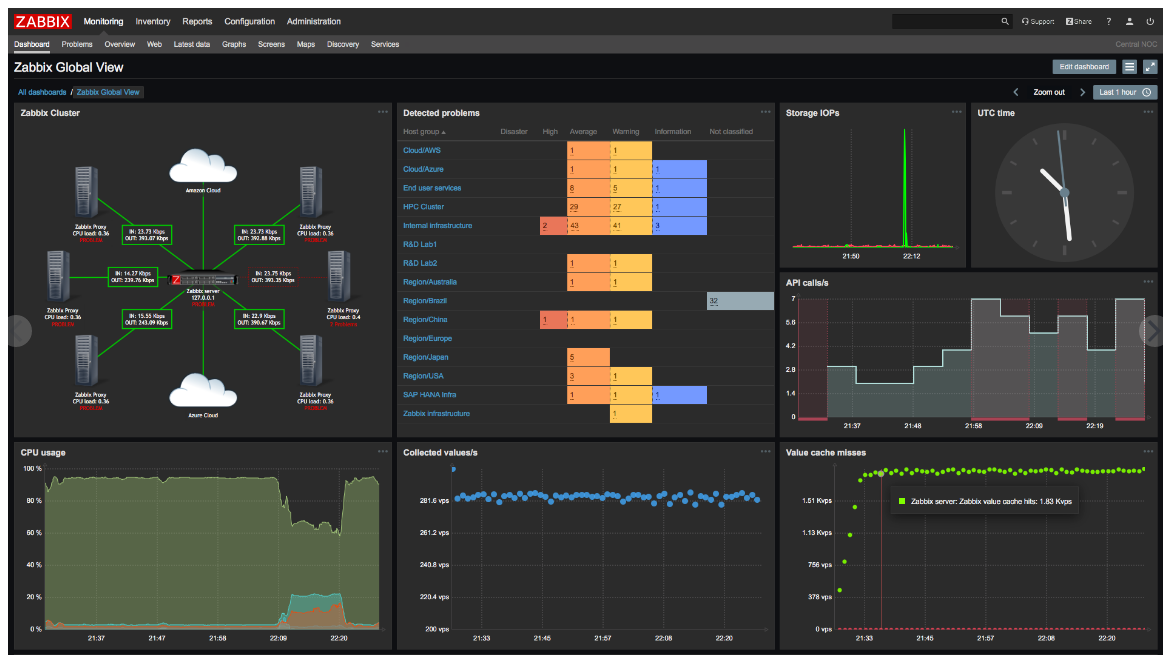
添加host,设置template之后,就可以看到效果了

In addition it is important to take a step back and have a look at the overall data flow within Zabbix. In order to create an item that gathers data you must first create a host. Moving to the other end of the Zabbix spectrum you must first have an item to create a trigger. You must have a trigger to create an action. Thus if you want to receive an alert that your CPU load it too high on Server X you must first create a host entry for Server X followed by an item for monitoring its CPU, then a trigger which activates if the CPU is too high, followed by an action which sends you an email. While that may seem like a lot of steps, with the use of templating it really isn't. However, due to this design it is possible to create a very flexible setup.
使用帮助:https://www.zabbix.com/documentation/4.0/manual/quickstart
关于java gateway
It is required to install Java gateway only if you want to monitor JMX applications. Java gateway is lightweight and does not require a database.
【原创】运维基础之Zabbix(1)简介、安装、使用的更多相关文章
- 【Apache运维基础(1)】Apache的安装与使用
安装 yum -y install httpd httpd-devel # 在Ubuntu里面叫做Apache2,输入localhost能打开就算成功了 额...当然专业的运维还是老老实实的去编译吧; ...
- 监控和安全运维 1.8 zabbix服务端安装
1. Zabbix简介基于web的开源软件,开源监控系统状态也可以监控网络设备.和nagios不同的是zabbix会把获取的数据保存在数据库中,所以zabbix需要有数据库支持 Zabbix还可以自动 ...
- 【原创】运维基础之yum离线环境安装软件
首先查看系统版本号,然后根据版本号从 CentOS-7-x86_64-DVD-1708.iso 和 CentOS-7-x86_64-Everything-1708.iso 根据需要选择一个下载,我这里 ...
- 运维监控之zabbix(yum安装)
简介 zabbix是一个基于WEB界面的提供分布式系统监视以及网络监视功能的企业级的开源解决方案. zabbix能监视各种网络参数,保证服务器系统的安全运营:并提供灵活的通知机制以让系统管理员快速定位 ...
- 运维监控-使用Zabbix Server 创建 Actions
运维监控-使用Zabbix Server 创建 Actions 作者:尹正杰 版权声明:原创作品,谢绝转载!否则将追究法律责任. zabbix的action默认是关闭的,因此我们想使用它就得先启用哟. ...
- 运维监控-使用Zabbix Server 创建触发器Triggers
运维监控-使用Zabbix Server 创建触发器Triggers 作者:尹正杰 版权声明:原创作品,谢绝转载!否则将追究法律责任. 1>.点击相应主机的触发器 2>.点击创建触发器 ...
- 运维监控-使用Zabbix Server 添加自定义 item
运维监控-使用Zabbix Server 监控自定义 item 作者:尹正杰 版权声明:原创作品,谢绝转载!否则将追究法律责任. 本篇博客就直接开门见山如何使用Zabbix Server 监控自定义 ...
- linux运维基础知识
linux运维基础知识大全 一,序言 每一个微不足道的知识,也是未来的铺垫.每一份工作的薪资职位,也是曾经努力的结果. 二,服务器 1,运维人员工作职责: 1)保证数据不丢失:2)保证服务器24小时运 ...
- linux——运维基础,与常用命令
1 运维概述 1 什么是运维 服务器的运行维护 2 名词 IDC(互联网数据中心) 3 监控软件 zabbix(用的最多), nagios, cactti 4 常用的linux操作系统 1 CentO ...
随机推荐
- Python的GIL机制与多线程编程
GIL 全称global interpreter lock 全局解释锁 gil使得python同一个时刻只有一个线程在一个cpu上执行字节码,并且无法将多个线程映射到多个cpu上,即不能发挥多个cpu ...
- Kubernetes — 从0到1:搭建一个完整的Kubernetes集群
准备工作 首先,准备机器.最直接的办法,自然是到公有云上申请几个虚拟机.当然,如果条件允许的话,拿几台本地的物理服务器来组集群是最好不过了.这些机器只要满足如下几个条件即可: 满足安装 Docker ...
- ZabbixServer安装
Zabbix服务端安装主要分二种一直yum在线安装,一种离线安装,在线安装只需简单命令自己便可安装离线安装得自定义路径等等...比较繁琐不过便于文件管理.这里简单配置一下在线安装. https://w ...
- python 基本数据类型以及运算符操作
一.基本数据类型 为何要区分类型? 数据类型的值是变量值得类型,变量值之所以区分类型,是因为变量的值 用来记录事物的状态,而事物的状态有不同的种类,对应着,也必须用不 用类型去区分它们. 1.数字类型 ...
- 18.flannel的配置
Kubernetes网络通信: (1) 容器间通信:同一个Pod内的多个容器间的通信, lo (2) Pod通信:Pod IP <--> Pod IP (3) Pod与Service通信: ...
- 【数学建模】MATLAB语法
一.向量.矩阵的表示和使用 format long %小数很多format short %默认4位小数format rat %显示最近的分数format short e %指数格式的数 尾数多少 e ...
- MySQL报错: SQLSTATE[HY000]: General error: 1030 Got error 28 from storage engine
执行命令:df -h [root@iZ25z6qcmrhZ ~]# df -hFilesystem Size Used Avail Use% Mounted on/dev/xvda1 40G 38G ...
- Python future使用
Python的每个新版本都会增加一些新的功能,或者对原来的功能作一些改动.有些改动是不兼容旧版本的,也就是在当前版本运行正常的代码,到下一个版本运行就可能不正常了. 从Python 2.7到Pytho ...
- mpvue——API请求封装(小程序原生)
前言 能用,但不是最好的方法,最好的还是fly,因为为了以后多平台的考虑,最好使用fly.js,做之前先关闭校验合法域名,因为我没在后台进行配置 后台进行配置合法域名,按着官方给的配置就OK了,这里就 ...
- POJChallengeRound2 Tree 【数学期望】
题目分析: 我们令$G(x)$表示前$x$个点的平均深度,$F(x)$表示第$x$个点的期望深度. 有$F(x) = G(x-1)+1$,$G(x) = G(x-1)+\frac{1}{x}$ 所以答 ...