python-matplotlib-2
figure的使用
x = np.linspace(-1, 1, 50)

y1 = 2 * x + 1

#figure 1

plt.figure()

plt.plot(x, y1)

# figure 2

y2 = x**2

plt.figure()

plt.plot(x, y2)

# figure 3,指定figure的编号并指定figure的大小, 指定线的颜色, 宽度和类型

y2 = x**2

plt.figure(num = 5, figsize = (4, 4))

plt.plot(x, y1)

plt.plot(x, y2, color = 'red', linewidth = 1.0, linestyle = '--')

plt.show()
设置x/y坐标轴刻度
# 设置x轴的取值范围为:-1到2

plt.xlim(-1, 2)

# 设置y轴的取值范围为:-1到3

plt.ylim(-1, 3)
# 设置y刻度:用文字来显示刻度

plt.yticks([-2, -1.8, -1, 1.22, 3],

  ['really bad', 'bad', 'normal', 'good', 'really good'])
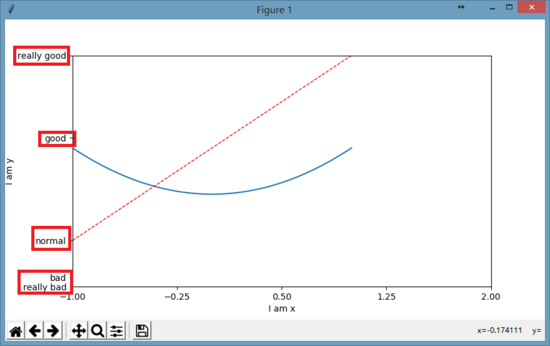
#用正则文本方式来显示字体,同时还用\alpha来转义显示数学中的alpha字母

plt.yticks([-2, -1.8, -1, 1.22, 3],

  [r'$really\ bad$', r'$bad\alpha$', 'normal', r'$good$', 'really good'])

刻度设置
以xticks为例:
matplotlib.pyplot.xticks(*args, **kwargs)
获取或者设置当前刻度位置和文本的 x-limits:
# return locs, labels where locs is an array of tick locations and

# labels is an array of tick labels.

locs, labels = xticks()

# set the locations of the xticks

xticks( arange(6) )

# set the locations and labels of the xticks

xticks( arange(5), ('Tom', 'Dick', 'Harry', 'Sally', 'Sue') )
关键字 args ,如果有其他的参数则是 Text 属性。例如,旋转长的文本标注。
xticks( arange(12), calendar.month_name[1:13], rotation=17 )
Axis containers
matplotlib.axis.Axis对象负责刻度线、格网线、刻度标注和坐标轴标注的绘制工作。你可以设置y轴的左右刻度或者x轴的上下刻度。 Axis 也存储了用于自动调整,移动和放缩的数据和视觉间隔;同时Locator和Formatter对象控制着刻度的位置以及以怎样的字符串呈现。
每一个 Axis 对象包含一个 label 属性以及主刻度和小刻度的列表。刻度是 XTick和 YTick对象,其包含着实际线和文本元素,分别代表刻度和注释。因为刻度是根据需要动态创建的,你应该通过获取方法get_major_ticks()和 get_minor_ticks()以获取主刻度和小刻度的列表。尽管刻度包含了所有的元素,并且将会在下面代码中涵盖,Axis 方法包含了获取方法以返回刻度线、刻度标注和刻度位置等等:
In [285]: axis = ax.xaxis

In [286]: axis.get_ticklocs()

Out[286]: array([ 0.,  1.,  2.,  3.,  4.,  5.,  6.,  7.,  8.,  9.])

In [287]: axis.get_ticklabels()

Out[287]: 10 Text major ticklabel objects>

# note there are twice as many ticklines as labels because by

#  default there are tick lines at the top and bottom but only tick

#  labels below the xaxis; this can be customized

In [288]: axis.get_ticklines()

Out[288]: 20 Line2D ticklines objects>

# by default you get the major ticks back

In [291]: axis.get_ticklines()

Out[291]: 20 Line2D ticklines objects>

# but you can also ask for the minor ticks

In [292]: axis.get_ticklines(minor=True)

Out[292]: 0 Line2D ticklines objects>
Tick locating and formatting
该模块包括许多类以支持完整的刻度位置和格式的配置。尽管 locators 与主刻度或小刻度没有关系,他们经由 Axis 类使用来支持主刻度和小刻度位置和格式设置。一般情况下,刻度位置和格式均已提供,通常也是最常用的形式。
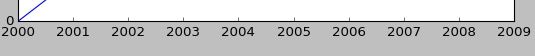
默认格式
当x轴数据绘制在一个大间隔的一个小的集中区域时,默认的格式将会生效。为了减少刻度标注重叠的可能性,刻度被标注在固定间隔之间的空白区域。比如:
ax.plot(np.arange(2000, 2010), range(10))
表现形式如下:

刻度仅标注了 0-9 以及一个间隔 +2e3 。如果不希望这种形式,可以关闭默认格式设置中的间隔标注的使用。
ax.get_xaxis().get_major_formatter().set_useOffset(False)
设置 rcParam axes.formatter.useoffset=False 以在全局上关闭,或者设置不同的格式。
刻度位置
Locator 类是所有刻度 Locators 的基类。 locators 负责根据数据的范围自动调整视觉间隔,以及刻度位置的选择。 MultipleLocator 是一种有用的半自动的刻度 Locator。 你可以通过基类进行初始化设置等等。
Locator 子类定义如下:
| NullLocator | No ticks |
|---|---|
| FixedLocator | Tick locations are fixed |
| IndexLocator | locator for index plots (e.g., where x = range(len(y))) |
| LinearLocator | evenly spaced ticks from min to max |
| LogLocator | logarithmically ticks from min to max |
| SymmetricalLogLocator | locator for use with with the symlog norm, works like the LogLocator for the part outside of the threshold and add 0 if inside the limits |
| MultipleLocator | ticks and range are a multiple of base;either integer or float |
| OldAutoLocator | choose a MultipleLocator and dyamically reassign it for intelligent ticking during navigation |
| MaxNLocator | finds up to a max number of ticks at nice locations |
| AutoLocator | MaxNLocator with simple defaults. This is the default tick locator for most plotting. |
| AutoMinorLocator | locator for minor ticks when the axis is linear and the major ticks are uniformly spaced. It subdivides the major tick interval into a specified number of minor intervals, defaulting to 4 or 5 depending on the major interval. |
你可以继承 Locator 定义自己的 locator。 你必须重写 ___call__ 方法,该方法返回位置的序列,你可能也想重写 autoscale 方法以根据数据的范围设置视觉间隔。
如果你想重写默认的locator,使用上面或常用的locator任何一个, 将其传给 x 或 y axis 对象。相关的方法如下:
ax.xaxis.set_major_locator( xmajorLocator )

ax.xaxis.set_minor_locator( xminorLocator )

ax.yaxis.set_major_locator( ymajorLocator )

ax.yaxis.set_minor_locator( yminorLocator )
刻度格式
刻度格式由 Formatter 继承来的类控制。 formatter仅仅作用于单个刻度值并且返回轴的字符串。
相关的子类请参考官方文档。
同样也可以通过重写 __all__ 方法来继承 Formatter 基类以设定自己的 formatter。
为了控制主刻度或小刻度标注的格式,使用下面任一方法:
ax.xaxis.set_major_formatter( xmajorFormatter )

ax.xaxis.set_minor_formatter( xminorFormatter )

ax.yaxis.set_major_formatter( ymajorFormatter )

ax.yaxis.set_minor_formatter( yminorFormatter )
设置刻度标注
原型举例:
set_xticklabels(labels, fontdict=None, minor=False, **kwargs)
综合举例(1)如下:
设置指定位置的标注更改为其他的标注:
plt.xticks([-np.pi, -np.pi/2, 0, np.pi/2, np.pi],

          [r'$-\pi$', r'$-\pi/2$', r'$0$', r'$+\pi/2$', r'$+\pi$'])

plt.yticks([-1, 0, +1],

          [r'$-1$', r'$0$', r'$+1$'])
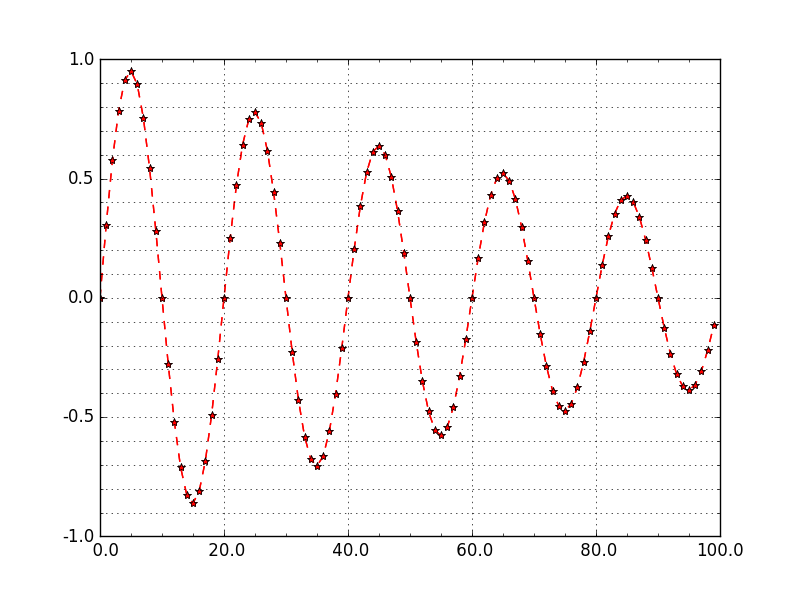
综合举例(2)如下:
设置坐标轴主刻度和次刻度。
#!/usr/bin/env python

#-*- coding: utf-8 -*-

#---------------------------------------------------

#演示MatPlotLib中设置坐标轴主刻度标签和次刻度标签.

#对于次刻度显示,如果要使用默认设置只要matplotlib.pyplot.minorticks_on()

#---------------------------------------------------

import numpy as np

import matplotlib.pyplot as plt

from matplotlib.ticker import MultipleLocator, FormatStrFormatter

#---------------------------------------------------

xmajorLocator   = MultipleLocator(20) #将x主刻度标签设置为20的倍数

xmajorFormatter = FormatStrFormatter('%5.1f') #设置x轴标签文本的格式

xminorLocator   = MultipleLocator(5) #将x轴次刻度标签设置为5的倍数

ymajorLocator   = MultipleLocator(0.5) #将y轴主刻度标签设置为0.5的倍数

ymajorFormatter = FormatStrFormatter('%1.1f') #设置y轴标签文本的格式

yminorLocator   = MultipleLocator(0.1) #将此y轴次刻度标签设置为0.1的倍数

t = np.arange(0.0, 100.0, 1)

s = np.sin(0.1*np.pi*t)*np.exp(-t*0.01)

ax = plt.subplot(111) #注意:一般都在ax中设置,不再plot中设置

plt.plot(t,s,'--r*')

#设置主刻度标签的位置,标签文本的格式

ax.xaxis.set_major_locator(xmajorLocator)

ax.xaxis.set_major_formatter(xmajorFormatter)

ax.yaxis.set_major_locator(ymajorLocator)

ax.yaxis.set_major_formatter(ymajorFormatter)

#显示次刻度标签的位置,没有标签文本

ax.xaxis.set_minor_locator(xminorLocator)

ax.yaxis.set_minor_locator(yminorLocator)

ax.xaxis.grid(True, which='major') #x坐标轴的网格使用主刻度

ax.yaxis.grid(True, which='minor') #y坐标轴的网格使用次刻度

plt.show()

##########################################################
图像形式如下:
存储图片
matplotlib.use('Agg')  #重要

from matplotlib.pyplot import plot,savefig

x=np.linspace(-4,4,30)

y=np.sin(x);

plot(x,y,'--*b')

savefig('D:/MyFig.jpg')
坐标轴设置
#设置坐标轴名称

plt.xlabel("")

plt.ylabel("")

#设置坐标轴刻度

plt.xticks()

plt.yticks()

#设置坐标轴上下限

plt.xlim(1,2)

plt.ylim(1,2)

#在图中画横竖线

plt.vlines(0,1,2,colors="r")#垂直线,从(0,1)到(0,2)

plt.hlines(4,1,2,colors="r")#水平线,从(1,4)到(2,4)
python-matplotlib-2的更多相关文章
- python matplotlib 中文显示参数设置
python matplotlib 中文显示参数设置 方法一:每次编写代码时进行参数设置 #coding:utf-8import matplotlib.pyplot as pltplt.rcParam ...
- python matplotlib plot 数据中的中文无法正常显示的解决办法
转发自:http://blog.csdn.net/laoyaotask/article/details/22117745?utm_source=tuicool python matplotlib pl ...
- python matplotlib画图产生的Type 3 fonts字体没有嵌入问题
ScholarOne's 对python matplotlib画图产生的Type 3 fonts字体不兼容,更改措施: 在程序中添加如下语句 import matplotlib matplotlib. ...
- 使用Python matplotlib做动态曲线
今天看到“Python实时监控CPU使用率”的教程: https://www.w3cschool.cn/python3/python3-ja3d2z2g.html 自己也学习如何使用Python ma ...
- python matplotlib 中文显示乱码设置
python matplotlib 中文显示乱码设置 原因:是matplotlib库中没有中文字体.1 解决方案:1.进入C:\Anaconda64\Lib\site-packages\matplot ...
- Python - matplotlib 数据可视化
在许多实际问题中,经常要对给出的数据进行可视化,便于观察. 今天专门针对Python中的数据可视化模块--matplotlib这块内容系统的整理,方便查找使用. 本文来自于对<利用python进 ...
- 转:使用 python Matplotlib 库 绘图 及 相关问题
使用 python Matplotlib 库绘图 转:http://blog.csdn.net/daniel_ustc/article/details/9714163 Matplotlib ...
- python+matplotlib 绘制等高线
python+matplotlib 绘制等高线 步骤有七: 有一个m*n维的矩阵(data),其元素的值代表高度 构造两个向量:x(1*n)和y(1*m).这两个向量用来构造网格坐标矩阵(网格坐标矩阵 ...
- 安装python Matplotlib 库
转:使用 python Matplotlib 库 绘图 及 相关问题 使用 python Matplotlib 库绘图 转:http://blog.csdn.net/daniel_ustc ...
- python matplotlib.pyplot 散点图详解(1)
python matplotlib.pyplot散点图详解(1) 一.创建散点图 可以用scatter函数创建散点图 并使用show函数显示散点图 代码如下: import matplotlib.py ...
随机推荐
- 【Zabbix】分布式监控系统Zabbix【一】
一.Zabbix功能及特性简介 Zabbix可以获取cpu,内存,网卡,磁盘,日志等信息 1.Zabbix数据收集方式: a.Agent客户端(Agent客户端支持多平台部署) b.如果是无法安装客户 ...
- yii2-cache组件第三个参数Dependency $dependency的作用浅析
用法如下: $cache->set($key, $result, Configs::instance()->cacheDuration, new TagDependency([ 'tags ...
- hadoop-2.7.3安装kafka_2.11-2.1.0
软件下载: http://mirrors.shu.edu.cn/apache/kafka/2.1.0/kafka_2.11-2.1.0.tgz 把下载好的包kafka_2.11-2.1.0.tgz 上 ...
- Vue的三个点es6知识,扩展运算符
Vue中的三个点在不同情境下的意思 操作数组 //里面放自己定义的方法 methods: { /** * 把数组中的元素孤立起来 */ iClick() { let iArray = ['1', '2 ...
- Delphi ClearCommError函数
- 如何使用ProcessOn制作思维导图
新建一张思维导图之后你是不是有点茫然? 不是因为脑海里没思路,而是不知道怎么把脑海里的思路呈现出来?看到一个孤零零的中心主题和看起来有些简单的页面一时间有点无所适从? 很多人觉得思维导图好看但学起来难 ...
- CAN学习方法(知乎)
作者:心机之花链接:https://www.zhihu.com/question/26776219/answer/244433861来源:知乎著作权归作者所有.商业转载请联系作者获得授权,非商业转载请 ...
- python 时间对应计算
import re import time def parse_time(date): if re.match('刚刚', date): date = time.strftime('%Y-%m-%d ...
- php正则表达式提取数字,字符串中提取数字
<?php $str = "请注意:有谁知道30901.5号路怎么走?这个因为我买了100块的烧饼和7901的钥匙了,那个对了,我再拿个30000"; $pattern = ...
- vector引用参数
#include<iostream> #include<vector> using namespace std; //定义一个计算数字的函数,返回计算后的vector numb ...