SSAS 聚合设计提升CUBE的查询性能(转载)
Problem
What exactly are SQL Server Analysis Services (SSAS) Aggregations and how exactly can I review and use them?
Solution
Aggregations in SSAS offer a wonderful opportunity to improve query performance and calculation times by "pre aggregating" sets of data. These aggregations allow a cube query to ask for a specific value or set of values for a specific group of dimension attributes (a set), and have the calculation already completed before the query was even asked. The aggregation and related query could ask for a single value or actually cover a whole set of values to be returned. Without the aggregations, the query would return results much slower and with more CPU and memory intensity as the query must complete the aggregation calculations at run time, which of course takes significantly longer than if the data points are already summarized to the desired level of the query. Of course it is a trade off between creating a large number of aggregations which speed up query performance versus increase processing time and memory needed to process the cube.
Establishing Aggregations
There are three distinct methods of defining aggregations currently available to cube designers.
The first method utilizes the Aggregation Design wizard to create a group of aggregations by comparing the amount of space required to store and process the aggregation vs. the time it would take to query for the same values. Siddharth Mehta completed an excellent tip on using the Aggregation Design wizard, which is available at: http://www.mssqltips.com/sqlservertip/2439/optimize-a-sql-server-analysis-services-measure-group-partition-for-performance/. This method is a good start; however it treats all possible combinations of aggregations as equally possible, so some aggregations may get created, but never be used.
The second method, called Usage Based Optimization, uses the SSAS Query log which must be turned on and then is used as a basis to establish the aggregations. This method addresses the problem with the Aggregation Design wizard by recording every n number of queries from SSAS. This recording is controlled by the Log \ Query Log properties and is set at the server level as shown in the below illustration. The tip, http://www.mssqltips.com/sqlservertip/2876/improve-sql-server-analysis-services-performance-with-the-usage-based-optimization-wizard/, written by Daniel Calbimonte provides a superb review of this topic. We could record every query, but that method has the potential to generate a very large table with many queries (which could impact performance).

So if we have these two methods of creating aggregations why do we need a third method?
The third method allows us to actually create aggregations based on the intended use of the SSAS database and at the desired level of detail or summation. In essence, this method allows us to decide exactly what aggregations need to be created at any desired attribute or hierarchy level and combination of attributes. Often, I compare the Aggregation Design wizard and the Query Log to the Database Tuning Adviser (DTA) in regular SQL Server. They both provide good starter advice to assist with creating high performing and responsive queries. However, you will often need to move beyond this introductory level of detail as your Cube increases in size, use, and complexity.
The first step in the process is to review your existing aggregates. We will again use the AdventureWorks DW SSAS database to review the existing aggregations and create new aggregations from scratch. This database is available for download for free, on CodePlex at: http://msftdbprodsamples.codeplex.com/releases/view/55330. Once you have the SQL Server and OLAP AdventureWorks databases installed, you will start SQL Server Data Tools (SSDT); SSDT is the new name for Business Intelligence Development Studio in SQL Server 2012.
We can now review the data aggregations that were previously created and then move to creating some new aggregations. In order to see the existing aggregations, you need to open the AdventrureWorks Cube and then click on the aggregation tab, as seen in the next screen print.

Before we move on, let us discuss a few concepts shown in the above screen print. First, on the left side, you see all your measure groups. In the above instance, the Internet Sales measure group has 1 Aggregation Design. In its simplest form an Aggregation Design is like a container or folder for the embedded aggregations. These aggregation designs can be tied to one or more partitions, but to only one measure group. For the above example, the Internet Sales aggregation design is tied to the Internet Sales partition and contains 41 individual aggregations. If no aggregations have been defined then the aggregation design says "Unassigned Aggregation Design" as illustrated next.

Although it is not readily apparent, two views aggregation views are available and each enables different options and settings. The default view is the standard view and is displayed next. You will notice the first two buttons are not grayed and are available to utilize. These buttons invoke the Aggregation Design wizard and Usage Based Optimization wizard. The standard view is invoked by clicking on the 4th button from the left.

The advanced view is implemented by clicking on the 5th button from the left (with the sigma symbol), and is shown below. You notice how the Aggregation Design wizard button and Usage Based Optimization wizard button both dim when you move to the advanced view, but the New Aggregation button, to the right of the standard view is available. The standard view definitely does not provide any details above the specific aggregation details, so we must move to the advanced view to see these details.

On the advanced view, as shown below, we need to select the measure group name, the Aggregation Design name, the sorting we would like to see and finally what range of aggregations we would like to display (steps 1 to 4). As the number of aggregations increases, the range field helps to manage the list and keep you from scrolling forever. You will also notice in the below screen print, that we actually get to see what dimension attributes make up each aggregate; one aggregate is setup for the Promotion Category while another if setup for the Discount Percent.

As an example, say after analyzing our usage patterns, we decide we need to add an aggregation by Product and Fiscal Year as those items will make up a common query for the Internet Sales measure group. To complete this task, you can right mouse click in aggregation detail area and select New Aggregation.

The new aggregation becomes A0 while the remaining aggregations "move" one column to the right (note the numbering is zero based). Now to create the aggregation, we simply click on the check box next to the dimension attributes which should be included in the aggregation and as shown below. Finally to complete the process, click on the save button.

SSAS also provides "caution warning messages" in the status row. This warning stems from the fact that within the Ship Date dimension, a hierarchy relationship already exists between the Date field and the Fiscal Year field, and thus creating an aggregation with both these items would be redundant. Also notice how next to each attribute the number of attribute values is listed which gives you an indication of the aggregation size.

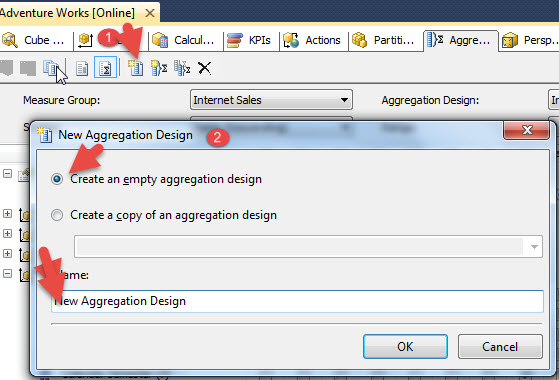
We can also create a new Aggregation Design by clicking on the New Aggregation Design button, step 1 in the below screen print. Then we define whether we want to copy an existing aggregation design or create a completely new one. Finally, the aggregation design needs to be named. As you can preview in the second screen print below, the new aggregation design was added to the Internet Sales measure group.

Conclusion
Just like with SQL Server indexes, there are several layers of design available for setting up aggregations in SSAS. You can use the Aggregation Design wizard and Usage Based Optimization wizard to setup aggregations in just a few steps. However, SSAS also provides a method of reviewing and even adding individual aggregation designs (aggregation groups) and individual aggregations. In order to create new aggregations, you must switch to the advanced view within the cube aggregation tab. Once on the Advanced view, individual dimension attributes can be added to your own custom aggregations which are tailored to your specific SSAS cube design and usage.
Next Steps
•Check out these related resources:
Optimize a SQL Server Analysis Services Measure Group Partition for Performance
Improve SQL Server Analysis Services Performance with the Usage Based Optimization Wizard
•SSAS Aggregations and Impact on Storage - http://technet.microsoft.com/en-us/library/ms174915(v=sql.110).aspx
SSAS 聚合设计提升CUBE的查询性能(转载)的更多相关文章
- 提升50%!Presto如何提升Hudi表查询性能?
分享一篇关于使用Hudi Clustering来优化Presto查询性能的talk talk主要分为如下几个部分 演讲者背景介绍 Apache Hudi介绍 数据湖演进和用例说明 Hudi Clust ...
- 从oracle往greenplum迁移,查询性能不满足要求的定位以及调优过程
一.前言 在一次对比oracle和greenplum查询性能过程中,由于greenplum查询性能不理想,因此进行定位分析,提升greenplum的查询性能 二.环境信息 初始情况下,搭建一个小的集群 ...
- 自适应查询执行:在运行时提升Spark SQL执行性能
前言 Catalyst是Spark SQL核心优化器,早期主要基于规则的优化器RBO,后期又引入基于代价进行优化的CBO.但是在这些版本中,Spark SQL执行计划一旦确定就不会改变.由于缺乏或者不 ...
- 查询性能提升3倍!Apache Hudi 查询优化了解下?
从 Hudi 0.10.0版本开始,我们很高兴推出在数据库领域中称为 Z-Order 和 Hilbert 空间填充曲线的高级数据布局优化技术的支持. 1. 背景 Amazon EMR 团队最近发表了一 ...
- 高性能MySQL笔记 第6章 查询性能优化
6.1 为什么查询速度会慢 查询的生命周期大致可按照顺序来看:从客户端,到服务器,然后在服务器上进行解析,生成执行计划,执行,并返回结果给客户端.其中“执行”可以认为是整个生命周期中最重要的阶段. ...
- mysql笔记03 查询性能优化
查询性能优化 1. 为什么查询速度会慢? 1). 如果把查询看作是一个任务,那么它由一系列子任务组成,每个子任务都会消耗一定的时间.如果要优化查询,实际上要优化其子任务,要么消除其中一些子任务,要么减 ...
- Elasticsearch索引和查询性能调优的21条建议
Elasticsearch部署建议 1. 选择合理的硬件配置:尽可能使用 SSD Elasticsearch 最大的瓶颈往往是磁盘读写性能,尤其是随机读取性能.使用SSD(PCI-E接口SSD卡/SA ...
- 关于领域驱动设计(DDD)中聚合设计的一些思考
关于DDD的理论知识总结,可参考这篇文章. DDD社区官网上一篇关于聚合设计的几个原则的简单讨论: 文章地址:http://dddcommunity.org/library/vernon_2011/, ...
- Redis 优化查询性能
一次使用 Redis 优化查询性能的实践 应用背景 有一个应用需要上传一组ID到服务器来查询这些ID所对应的数据,数据库中存储的数据量是7千万,每次上传的ID数量一般都是几百至上千数量级别. 以前 ...
随机推荐
- 【上手centos】一、前情以及sublime_text_3安装
笔记本自大一入手,只重装过一次系统,从不曾拆机清灰过.读研之后,日常工作与学习都在实验室进行,笔记本一直在宿舍的桌子上落灰,只偶尔打开来看个电影.上周末,心血来潮,把笔记本抱到实验室拆了清灰,以前一直 ...
- php创建网站问题
网站在本地浏览的时候链接点击都提示The requested URL was not found on this server. 本地装的wamp,apache和php.ini都是好的 最后更改: 在 ...
- Selenium2学习-034-WebUI自动化实战实例-032-获取页面 body 大小
获取 body 元素大小的方法,非常简单,直接上码,敬请参阅! /** * Get body size * * @author Aaron.ffp * @version V1.0.0: autoSel ...
- Java 日志管理最佳实践
转:http://blog.jobbole.com/51155/ 日志记录是应用程序运行中必不可少的一部分.具有良好格式和完备信息的日志记录可以在程序出现问题时帮助开发人员迅速地定位错误的根源.对于开 ...
- 一行两端对齐justify-content
一.之前不了解css3的属性,更没听过flex布局 在处理表单前面的文字,两端对齐,按照我之前的前端人员,加空格处理,但是在不浏览器解析空格的宽是不一样的 上图就用空格,在不同浏览器显示的效果,有时候 ...
- 四元数(Quaternion)和旋转(转)
http://blog.csdn.net/candycat1992/article/details/41254799 四元数介绍 旋转,应该是三种坐标变换--缩放.旋转和平移,中最复杂的一种了.大家应 ...
- Linux 使用 bg 和 fg 切换任务运行状态
将Linux任务转换到后台执行 平时在运行 Linux 任务时,在任务运行时又想运行其它任务,那么可以把任务切换到后台运行. 使用 ctrl+z 可以把当前的任务转入到后台,这时任务并没有被中止,可使 ...
- PHP接口类interface的正确使用方法
对于那些初学PHP语言的人来说,对于PHP的接口类也许了解的还不是很深入,接下来我们就来具体讲述PHP接口类interface的使用方法. 如何正确运用PHP XMLReader解析XML文档 深入解 ...
- php 配置本地自定义域名
一.设置host文件 二.设置httpd.conf # Virtual hosts Include conf/extra/httpd-vhosts.conf 三.设置httpd-vhosts.conf ...
- 高级选择器querySelector和querySelectorAll
Javascript新提供的querySelector和querySelectorAll方法,是仿照CSS选择器功能编写的 querySelector 功能:该方法返回满足条件的单个元素.按照深度优先 ...