C#用GDI+解析Json文件绘制Chart
using System.Collections.Generic;

namespace Chart

{

    public class Program

    {

        static void Main(string[] args)

        {

            Chart chart = new Chart();

            ChartType chartType = ChartType.Histogram;

            string path = @"..\..\JSON.json";

            DataSource dataSource = new JsonDataSource();

            List<Composition> Compositions = dataSource.GetDataList(path);

            chart.Compositions.AddRange(Compositions);

            chart.Draw(chartType);

            chart.Save();

        }

    }

}
Program.cs
using System;
using System.Collections.Generic;
using System.Diagnostics;
using System.Drawing;
namespace Chart
{
public class Chart
{
private Bitmap bmp = new Bitmap(, );
List<Composition> composition = new List<Composition>();
public List<Composition> Compositions { get { return composition; } }
private float width; private float Width
{
get
{
int sum = ;
foreach (var composition in Compositions)
{
sum += composition.DataPoints.Count + ;
}
width = (float) / sum;
return width;
}
} public void Draw(ChartType chartType)
{
Series series; switch (chartType)
{
case ChartType.LineChart:
series = new LineSeries();
break; case ChartType.Histogram:
series = new HistogramSeries();
break; case ChartType.PieChart:
series = new PieSeries();
break; default:
throw new ArgumentOutOfRangeException("Nonexistent ChartType!");
} foreach (var comPosition in Compositions)
{
series.Legend.Add(comPosition.Name);
} Platform platform = new Windows(bmp); series.Draw(Width, platform, Compositions);
} public void Save()
{
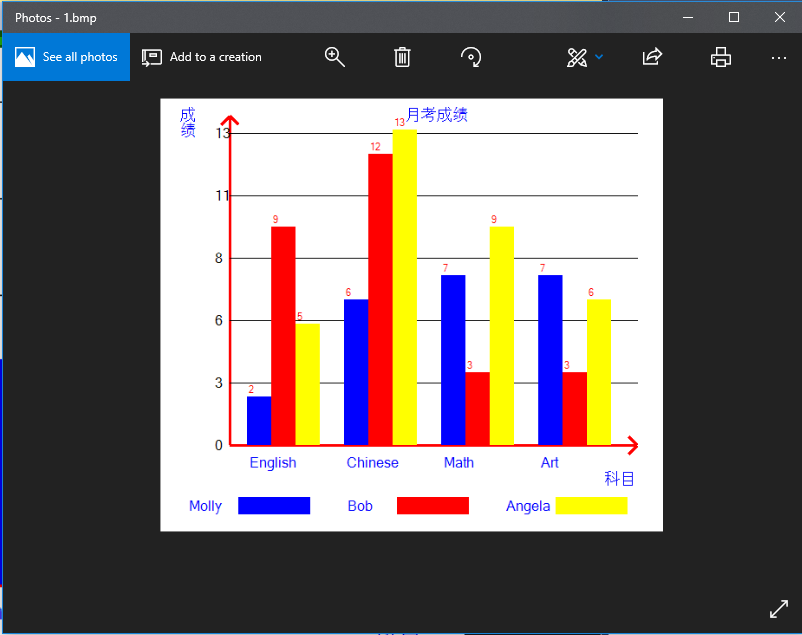
bmp.Save(@"..\..\1.bmp");
Process.Start(@"..\..\1.bmp");
}
}
}
Chart.cs
using System.Collections;

using System.Collections.Generic;

using System.Drawing;

namespace Chart

{

    public abstract class Series

    {

        ArrayList legend = new ArrayList();

        public ArrayList Legend { get { return legend; } set { } }

        protected PointF PointFormLarge;

        protected PointF PointFormSmall;

        private void DrawChart(Platform g)

        {

            g.FillRectangle(g.WBrush, , , , );

        }

        protected abstract void DrawCore(float width, Platform g, List<Composition> Compositions);

        public void Draw(float width, Platform g, List<Composition> Compositions)

        {

            PointFormLarge = new PointF(width * Compositions.Count + width, );

            PointFormSmall = new PointF(width, );

            DrawChart(g);

            DrawCore(width, g, Compositions);

        }

    }

}
Series.cs
using System.Collections.Generic;

using System.Drawing;

using System;

namespace Chart

{

    public class HistogramSeries : Series

    {

        private void DrawAxes(Platform g)

        {

            g.DrawLine(g.Rpen, new Point(, ), new Point(, ));

            g.DrawLine(g.Rpen, new Point(, ), new Point(, ));

            g.DrawLine(g.Rpen, new Point(, ), new Point(, ));

            g.DrawLine(g.Rpen, new Point(, ), new Point(, ));

            g.DrawLine(g.Rpen, new Point(, ), new Point(, ));

            g.DrawLine(g.Rpen, new Point(, ), new Point(, ));

            g.DrawString("月考成绩", g.LargeFont, g.Bbrush, new RectangleF(, , , ));

            g.DrawString("科目", g.LargeFont, g.Bbrush, new RectangleF(, , , ));

            g.DrawString("成绩", g.LargeFont, g.Bbrush, new RectangleF(, , , ));

            for (int i = ; i < ; i++)

            {

                g.DrawLine(g.BlackPen, new Point(,  +  * i), new Point(,  +  * i));

            }

        }

        private void DrawLegend(Platform g)

        {

            int LegendWidth =  / (Legend.Count - );

            int StringX = ;

            int LegendX = StringX + ;

            int k = ;

            foreach (string legend in Legend)

            {

                switch (k)

                {

                    case :

                        g.Brush = Brushes.Blue;

                        break;

                    case :

                        g.Brush = Brushes.Red;

                        break;

                    case :

                        g.Brush = Brushes.Yellow;

                        break;

                    case :

                        g.Brush = Brushes.Green;

                        break;

                }

                g.DrawString(legend, g.LargeFont, Brushes.Blue, StringX, );

                Rectangle rect = new Rectangle(LegendX, , LegendWidth *  / , );

                g.FillRectangle(g.Brush, rect);

                StringX +=  / Legend.Count;

                LegendX = StringX + ;

                k++;

            }

        }

        protected override void DrawCore(float width, Platform g, List<Composition> Compositions)

        {

            DrawAxes(g);

            DrawLegend(g);

            foreach (var datapoint in Compositions[].DataPoints)

            {

                g.DrawString(datapoint.XValue, g.LargeFont, g.Bbrush, , );

                g.TranslateTransform(PointFormLarge.X, PointFormLarge.Y);

            }

            g.ResetTransform();

            int YValueMax = ;

            foreach (var composition in Compositions)

            {

                if (YValueMax <= composition.Max)

                {

                    YValueMax = composition.Max;

                }

            }

            g.YRatioScale =  / YValueMax;

            for (int i = ; i <= ; i++)

            {

                g.DrawString(Math.Ceiling(// g.YRatioScale*(-i)).ToString(), g.LargeFont, g.BlackBrush, new RectangleF(,  +  * i, , ));

            }

            void DrawRectangle(float x, float y, float Width, float height, Composition composition)

            {

                Rectangle rect = new Rectangle((int)x, (int)y, (int)width, (int)height);

                g.FillRectangle(composition.BrushColor, rect);

            }

            int j = ;

            foreach (var composition in Compositions)

            {

                Compositions[].BrushColor = Brushes.Blue;

                Compositions[].BrushColor = Brushes.Red;

                Compositions[].BrushColor = Brushes.Yellow;

                foreach (var datapoint in composition.DataPoints)

                {

                    DrawRectangle(,  - datapoint.YValue * g.YRatioScale, width, datapoint.YValue * g.YRatioScale, composition);

                    g.DrawString(datapoint.YValue.ToString(), g.SmallFont, Brushes.Red, ,  - datapoint.YValue * g.YRatioScale - );

                    g.TranslateTransform(PointFormLarge.X, PointFormLarge.Y);

                }

                g.ResetTransform();

                for (int i = ; i < j; i++)

                {

                    g.TranslateTransform(PointFormSmall.X, PointFormSmall.Y);

                }

                j++;

            }

            g.ResetTransform();

        }

    }

}
Histogram.cs
using System.Drawing;

namespace Chart

{

    public abstract class Platform

    {

        public abstract void FillRectangle(Brush b, int x, int y, int width, int height);

        public abstract void DrawLine(Pen pen, Point pt1, Point pt2);

        public abstract void DrawString(string s, Font font, Brush brush, RectangleF layoutRectangle);

        public abstract void DrawString(string s, Font font, Brush brush, float x, float y);

        public abstract void FillRectangle(Brush brush, Rectangle rect);

        public abstract void TranslateTransform(float dx, float dy);

        public abstract void ResetTransform();

        private Brush wbrush = Brushes.White;

        private Brush bbrush = Brushes.Blue ;

        private Brush blackBrush = Brushes.Black;

        private Brush brush ;

        Pen rpen = new Pen(Color.Red, );

        Pen blackPen = new Pen(Color .Black ,);

        Font largeFont = new Font("黑体", );

        Font smallFont = new Font("黑体", );

        private float yRatioScale;

        public Brush WBrush { get => wbrush; set => wbrush = value; }

        public Pen Rpen { get => rpen; set => rpen = value; }

        public Font LargeFont { get => largeFont; set => largeFont = value; }

        public Font SmallFont { get => smallFont; set => smallFont = value; }

        public Brush Bbrush { get => bbrush; set => bbrush = value; }

        internal float YRatioScale { get => yRatioScale; set => yRatioScale = value; }

        public Brush Brush { get => brush; set => brush = value; }

        public Pen BlackPen { get => blackPen; set => blackPen = value; }

        public Brush BlackBrush { get => blackBrush; set => blackBrush = value; }

    }

}
Platform.cs
using System.Drawing;

namespace Chart

{

    public class Windows : Platform

    {

        private readonly Graphics graphics;

        public Windows(Bitmap bmp)

        {

            graphics = Graphics.FromImage(bmp);

        }

        public override void FillRectangle(Brush b, int x, int y, int width, int height)

        {

            graphics.FillRectangle(b, x, y, width, height);

        }

        public override void DrawLine(Pen pen, Point pt1, Point pt2)

        {

            graphics.DrawLine(pen, pt1, pt2);

        }

        public override void DrawString(string s, Font font, Brush brush, RectangleF layoutRectangle)

        {

            graphics.DrawString(s, font, brush, layoutRectangle);

        }

        public override void DrawString(string s, Font font, Brush brush, float x, float y)

        {

            graphics.DrawString(s, font, brush, x, y);

        }

        public override void FillRectangle(Brush brush, Rectangle rect)

        {

            graphics.FillRectangle(brush, rect);

        }

        public override void TranslateTransform(float dx, float dy)

        {

            graphics.TranslateTransform(dx, dy);

        }

        public override void ResetTransform()

        {

            graphics.ResetTransform();

        }

    }

}
Windows.cs
using System.Collections.Generic;

using System.Drawing;

namespace Chart

{

    public class Composition

    {

        private List<DataPoint> dataPoints;

        private string name;

        private Brush brushColor;

        private int max;

        public List<DataPoint> DataPoints { get => dataPoints; set => dataPoints = value; }

        public string Name { get => name; set => name = value; }

        public Brush BrushColor { get => brushColor; set => brushColor = value; }

        public int Max              //Linq中提供的计算List最大值的方法是集合中的元素即为可比较的数值类型,DataPoint不是,所以这里的方法自定义

        {

            get

            {

                foreach (var datapoint in DataPoints)

                {

                    if (datapoint.YValue >= max)

                    {

                        max = datapoint.YValue;

                    }

                }

                return max;

            }

        }

    }

}
Composition.cs
namespace Chart

{

    public class DataPoint

    {

        private string xValue;

        private int yValue;

        public int YValue { get => yValue; set => yValue = value; }

        public string XValue { get => xValue; set => xValue = value; }

    }

}
DataPoint
using System.Collections.Generic;

using System.IO;

namespace Chart

{

    public abstract class DataSource

    {

        protected abstract List<Composition> GetDataListCore(string path);

        public List<Composition> GetDataList(string path)

        {

            if (!File.Exists(path))

            {

                throw new FileNotFoundException(path);

            }

            return GetDataListCore(path);

        }

    }

}
DataSource.cs
using Newtonsoft.Json;

using System.Collections.Generic;

using System.IO;

namespace Chart

{

    public class JsonDataSource : DataSource

    {

        protected override List<Composition> GetDataListCore(string path)

        {

          return  JsonConvert.DeserializeObject<List<Composition>>(File.ReadAllText(path));

        }

    }

}
JsonDataSource.cs
[

  {

    "Name": "Molly",

    "DataPoints": [

      {

        "XValue": "English",

        "YValue":

      },

      {

        "XValue": "Chinese",

        "YValue":

      },

      {

        "XValue": "Math",

        "YValue":

      },

      {

        "XValue": "Art",

        "YValue":

      }

    ]

  },

  {

    "Name": "Bob",

    "DataPoints": [

      {

        "XValue": "English",

        "YValue":

      },

      {

        "XValue": "Math",

        "YValue":

      },

      {

        "XValue": "Art",

        "YValue":

      },

      {

        "XValue": "Chinese",

        "YValue":

      }

    ]

  },

  {

    "Name": "Angela",

    "DataPoints": [

      {

        "XValue": "English",

        "YValue":

      },

      {

        "XValue": "Math",

        "YValue":

      },

      {

        "XValue": "Art",

        "YValue":

      },

      {

        "XValue": "Chinese",

        "YValue":

      }

    ]

  }

]
JSON.json
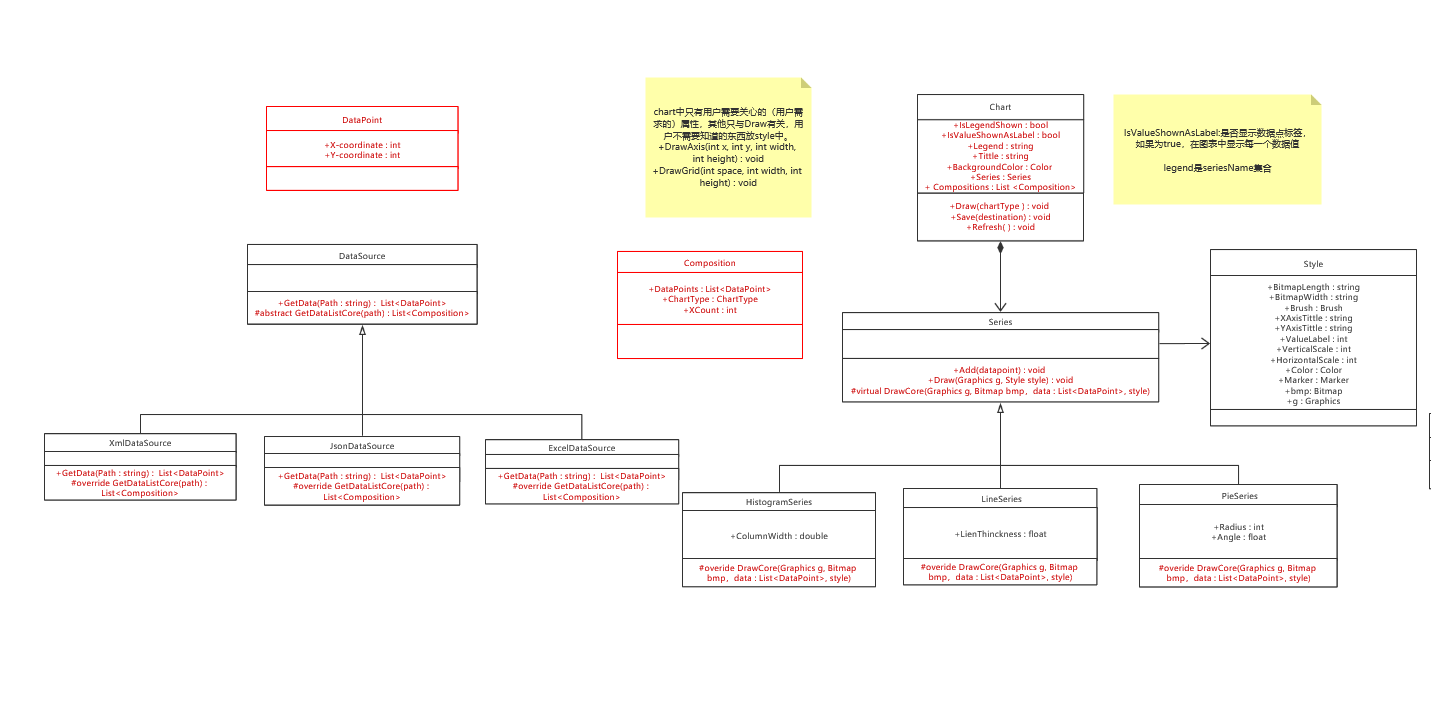
以下附上这个程序设计的UML类图
https://www.processon.com/view/link/5b4dbd93e4b00b08ad2085d7
C#用GDI+解析Json文件绘制Chart的更多相关文章
- Android--------使用gson解析json文件
##使用gson解析json文件 **json的格式有两种:** **1. {}类型,及数据用{}包含:** **2. []类型,即数据用[]包含:** 下面用个例子,简单的介绍gson如何解析jso ...
- JAVA简便解析json文件
JAVA简便解析json文件 首先放上我要解析的json文件: { "resultcode":"200", "reason":"S ...
- python脚本解析json文件
python脚本解析json文件 没写完.但是有效果.初次尝试,写的比较不简洁... 比较烦的地方在于: 1,中文编码: pSpecs.decode('raw_unicode_escape') 2,花 ...
- 使用google-gson类库解析json文件
使用google-gson类库解析json文件 使用JsonParser解析器来解析字符串和输入流,变成json对象 代码如下: public class Readjson { public stat ...
- 安卓解析JSON文件
安卓解析JSON文件 根据JOSN文件的格式,文件只有两种数据,一是对象数据,以 {}为分隔,二是数组,以[]分隔 以下介绍安卓如何解析一个JSON文件,该文件存放在assets目录下,即:asset ...
- Java解析JSON文件的方法
http://blog.sina.com.cn/s/blog_628cc2b70101dydc.html java读取文件的方法 http://www.cnblogs.com/lovebread/ar ...
- Logstash:解析 JSON 文件并导入到 Elasticsearch 中
转载自:https://elasticstack.blog.csdn.net/article/details/114383426 在今天的文章中,我们将详述如何使用 Logstash 来解析 JSON ...
- C#解析json文件的方法
C# 解析 json JSON(全称为JavaScript Object Notation) 是一种轻量级的数据交换格式.它是基于JavaScript语法标准的一个子集. JSON采用完全独立于语言的 ...
- Java解析JSON文件的方法(一)
一.首先需要在Eclipse工程中导入相关的jar包,jar包参见链接:http://yunpan.alibaba-inc.com/share/link/NdA5b6IFK 二.提供一份待解析的jso ...
随机推荐
- linux NTP配置
时间是由计算机内的石英晶体振荡电路以:NetworkTimeProtocol(NTP):通常情况下,时间同步是按以下步骤进行的::(1):NTP客 户端向NTP服务器发出一个时间请:(2):当服务器接 ...
- BZOJ4009:[HNOI2015]接水果(整体二分版)
浅谈离线分治算法:https://www.cnblogs.com/AKMer/p/10415556.html 题目传送门:https://lydsy.com/JudgeOnline/problem.p ...
- Python 修改ha配置文件
任务要求: 1.用户输入字符串 {"backend": "test.oldboy.org","record":{"server&q ...
- docker容器升级脚本
#!/bin/bash # Let's finish it like a flash # usage:sh -x update_cms_backend.sh -v 2018050401 ARGS=`g ...
- Linux应用函数 -- 字符串
1.strchr 原型 char *strchr(const char* _Str,char _Val) 头文件 string.h 功能 查找字符串_Str中首次出现字符_Val的位置 返回值 成功 ...
- git学习4 常用命令
1:更新: 更新后,更新只在Workspace中,没有到暂存区.git status可以查看当前状态. git add <file> 可以放到待提交区. git checko ...
- 腾讯Web前端开发框架JX(Javascript eXtension tools)
转自:Web前端开发-Web前端工程师 » 腾讯Web前端开发框架JX(Javascript eXtension tools) JX – Javascript eXtension tools 一个类似 ...
- 数据库:sql 多表联合更新【转】
SQL Update多表联合更新的方法 (1) sqlite 多表更新方法 update t1 set col1=t2.col1 from table1 t1 inner join table2 t2 ...
- Word中调整编号和文字的间距
鼠标放在节文字上,不用选择该级别的所有节点,直接在某一节上右键-段落-制表位-默认制表位-设置1字符或其它.完成后该级别所有节的格式都自动调整,不用一个个调整. 但是设置其它段落格式还是需要在菜单上选 ...
- ASP.NET 页面生命中的关键事件的执行顺序
表 1:ASP.NET 页面生命中的关键事件 阶段 页面事件 可覆盖的方法 页面初始化 Init 加载视图状态 LoadViewState 处理回发数据 任意实现 IPostBackDat ...