Competing in a data science contest without reading the data
Competing in a data science contest without reading the data
Machine learning competitions have become an extremely popular format for solving prediction and classification problems of all sorts. The most famous example is perhaps the Netflix prize. An even better example is Kaggle, an awesome startup that’s organized more than a hundred competitions over the past few years.
The central component of any competition is the public leaderboard. Competitors can repeatedly submit a list of predictions and see how their predictions perform on a set ofholdout labels not available to them. The leaderboard ranks all teams according to their prediction accuracy on the holdout labels. Once the competition closes all teams are scored on a final test set not used so far. The resulting ranking, called private leaderboard, determines the winner.
In this post, I will describe a method to climb the public leaderboard without even looking at the data. The algorithm is so simple and natural that an unwitting analyst might just run it. We will see that in Kaggle’s famous Heritage Health Prize competition this might have propelled a participant from rank around 150 into the top 10 on the public leaderboard without making progress on the actual problem. The Heritage Health Prize competition ran for two years and had a prize pool of 3 million dollars. Keep in mind though that the standings on the public leaderboard do not affect who gets the money.
The point of this post is to illustrate why maintaining a leaderboard that accurately reflects the true performance of each team is a difficult and deep problem. While there are decades of work on estimating the true performance of a model (or set of models) from a finite sample, the leaderboard application highlights some challenges that while fundamental have only recently seen increased attention. A follow-up post will describe arecent paper with Avrim Blum that gives an algorithm for maintaining a (provably) accurate public leaderboard.
Let me be very clear that my point is not to criticize Kaggle or anyone else organizing machine learning competitions. On the contrary, I’m amazed by how well Kaggle competitions work. In my opinion, they have contributed a tremendous amount of value to both industry and education. I also know that Kaggle has some very smart people thinking hard about how to anticipate problems with competitions.
The Kaggle leaderboard mechanism
At first sight, the Kaggle mechanism looks like the classic holdout method. Kaggle partitions the data into two sets: a training set and a holdout set. The training set is publicly available with both the individual instances and their corresponding class labels. The instances of the holdout set are publicly available as well, but the class labels are withheld. Predicting these missing class labels is the goal of the participant and a valid submission is a list of labels—one for each point in the holdout set.
Kaggle specifies a score function that maps a submission consisting of N labels to a numerical score, which we assume to be in [0,1]. Think of the score as prediction error (smaller is better). For concreteness, let’s fix it to be the misclassification rate. That is a prediction incurs loss 0 if it matches the corresponding unknown label and loss 1 if it does not match it. We divide by the number of predictions to get a score in [0,1].
Kaggle further splits its N private labels randomly into n holdout labels and N−n test labels. Typically, n=0.3N. The public leaderboard is a sorting of all teams according to their score computed only on the n holdout labels (without using the test labels), while the private leaderboard is the ranking induced by the test labels. I will let sH(y) denote the public score of a submission y, i.e., the score according to the public leaderboard. Typically, Kaggle rounds all scores to 5 or 6 digits of precision.
The cautionary tale of wacky boosting
Imagine your humble blogger in a parallel universe: I’m new to this whole machine learning craze. So, I sign up for a Kaggle competition to get some skills. Kaggle tells me that there’s an unknown set of labels y∈{0,1}N that I need to predict. Well, I know nothing about y. So here’s what I’m going to do. I try out a bunch of random vectors and keep all those that give me a slightly better than expected score. If we’re talking about misclassification rate, the expected score of a random binary vector is 0.5. So, I’m keeping all the vectors with score less than 0.5. Then I recall something about boosting. It tells me that I can boost my accuracy by aggregating all predictors into a single predictor using the majority function. Slightly more formally, here’s what I do:
Algorithm (Wacky Boosting):
- Choose y1,…,yk∈{0,1}N uniformly at random.
- Let I={i∈[k]:sH(yi)<0.5}.
- Output y^=majority{yi:i∈I}, where the majority is component-wise.
Lo and behold, this is what happens:
In this plot, n=4000 and all numbers are averaged over 5 independent repetitions.
As I’m only seeing the public score (bottom red line), I get super excited. I keep climbing the leaderboard! Who would’ve thought that this machine learning thing was so easy? So, I go write a blog post on Medium about Big Data and score a job at DeepCompeting.ly, the latest data science startup in the city. Life is pretty sweet. I pick up indoor rock climbing, sign up for wood working classes; I read Proust and books about espresso. Two months later the competition closes and Kaggle releases the final score. What an embarrassment! Wacky boosting did nothing whatsoever on the final test set. I get fired from DeepCompeting.ly days before the buyout. My spouse dumps me. The lease expires. I get evicted from my apartment in the Mission. Inevitably, I hike the Pacific Crest Trail and write a novel about it.
What just happened
Let’s understand what went wrong and how you can avoid hiking the Pacific Crest Trail. To start out with, each yi has loss around 1/2±1/n√. We’re selecting the ones that are biased below a half. This introduces a bias in the score and the conditional expected bias of each selected vector wi is roughly 1/2−c/n√ for some positive constant c>0. Put differently, each selected yi is giving us a guess about each label in the unknown holdout set H⊆[N] that’s correct with probability 1/2+Ω(1/n√). Since the public score doesn’t depend on labels outside of H, the conditioning does not affect the final test set. The labels outside of H are still unbiased. Finally, we need to argue that the majority vote “boosts” our slightly biased coin tosses into a stronger bias. More formally, we can show that y^ gives us a guess for each label in H that’s correct with probability
Hence, the public score of y satisfies
Outside of H, however, we’re just random guessing with no advantage. To summarize, wacky boosting gives us a bias of k√ standard deviations on the public score with ksubmissions.
What’s important is that the same algorithm still “works” even if we don’t get exact answers. All we need are answers that are accurate to an additive error of 1/n√. This is important since Kaggle rounds its answers to 5 digits of precision. In particular, this attack will work so long as n<1010.
Why the holdout method breaks down
The idea behind the holdout method is that the holdout data serve as a fresh sample providing an unbiased and well-concentrated estimate of the true loss of the classifier on the underlying distribution. Why then didn’t the holdout method detect that our wacky boosting algorithm was overfitting? The short answer is that the holdout method is simply not valid in the way it’s used in a competition.
One point of departure from the classic method is that the participants actually do see the data points corresponding to holdout labels which can lead to some problems. But that’s not the issue here and even if they we don’t look at the holdout data points at all, there’s a fundamental reason why the validity of the classic holdout method breaks down.
The problem is that a submission in general incorporates information about the holdout labels previously released through the leaderboard mechanism. As a result, there is a statistical dependence between the holdout data and the submission. Due to this feedback loop, the public score is in general no longer an unbiased estimate of the true score. There is no reason not to expect the submissions to eventually overfit to the holdout set.
The problem of overfitting to the holdout set is well known. Kaggle’s forums are full of anecdotal evidence reported by various competitors. The primary way Kaggle deals with this problem is by limiting the rate of re-submission and (to some extent) the bit precision of the answers. Of course, this is also the reason why the winners are determined on a separate test set.
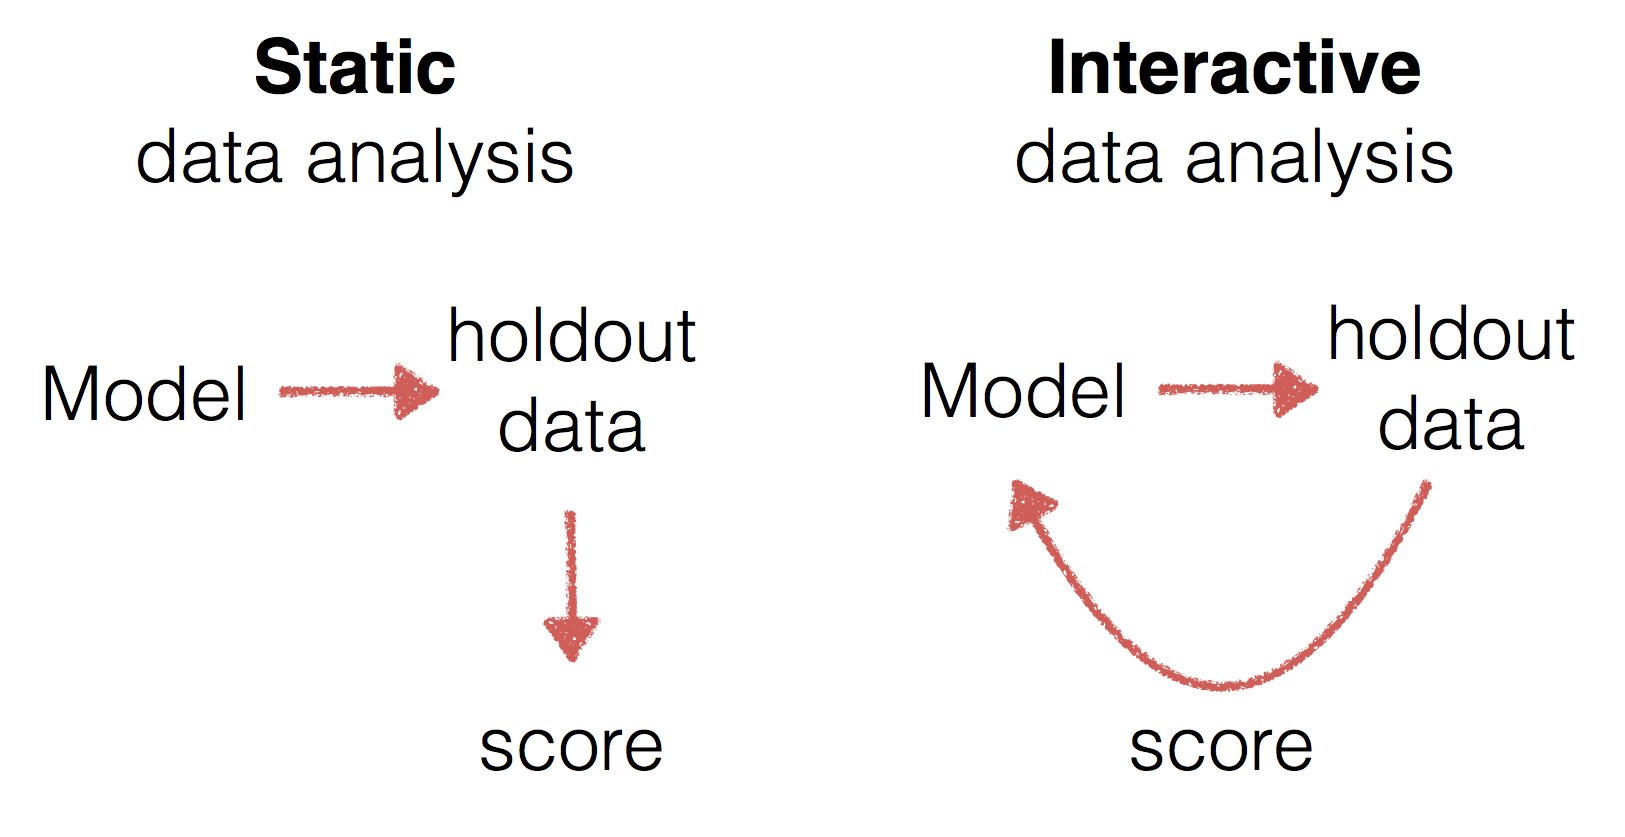
Static vs interactive data analysis
Kaggle’s liberal use of the holdout method is just one example of a widespread disconnect between the theory of static data analysis and the practice of interactive data analysis. The holdout method is a static method in that it assumes the model to be independent of the holdout data on which it is evaluated. However, machine learning competitions are interactive, because submissions generally incorporate information from the holdout set.
I contend that most real world data analysis is interactive. Unfortunately, most of the theory on model validation and statistical estimation falls into the static setting requiring independence between method and holdout data. This divide is not inherent though. Indeed, my next post deals with some useful theory for the interactive setting.
The Heritage Health Prize leaderboard
Let’s see how this could’ve been applied to an actual competition. Of course, theHeritage Health Prize competition is long over. We’re about two years too late to the party. Besides, we don’t have the solution file for that competition. Without it there’s no sure way of knowing how well this approach would’ve worked. Nevertheless, we can make some reasonable modeling of what the holdout labels might look like using information that was released by Kaggle and see how well we’d be doing against our random model.
Generalized wacky boosting
Before we can apply wacky boosting to the Heritage prize, we need to clear two obstacles. First, wacky boosting required the domain to be Boolean whereas the labels could be arbitrary positive real numbers. Second, the algorithm only gave an advantage over random guessing which might be too far from the top of the leaderboard to start out with. It turns out that both of these issues can be resolved nicely with a simple generalization of the previous algorithm. What was really happening in the algorithm is that we had two candidate solutions, the all ones vector and the all zeros vector, and we tried out random coordinate-wise combinations of these vectors. The algorithm ends up finding a coordinate wise combination of the two vectors that improves upon their mean loss, i.e., one half. This way of looking at it generalizes nicely. The resulting algorithm is just a few lines of Julia code.
# select coordinate from v1 where v is 1 and from v2 where v is 0

combine(v,v1,v2) = v1 .* v + v2 .* (1-v)

function wackyboost(v1,v2,k,score)

    m = mean([score(v1),score(v2)])

    A = rand(0:1,(length(v1),k))

    # select columns of A that give better than mean score

    a = filter(i -> score(combine(A[:,i],v1,v2)) < m,[1:k])

    # take majority vote over all selected columns

    v = float(A[:,a] * ones(length(a)) .> length(a)/2)

    return combine(v,v1,v2)

end
I worked through the fun exercise of applying this algorithm in a separate Julia notebook. Here’s one picture that came out of it. Don’t treat the numbers as definitive as they all depend on the modeling assumptions I made.
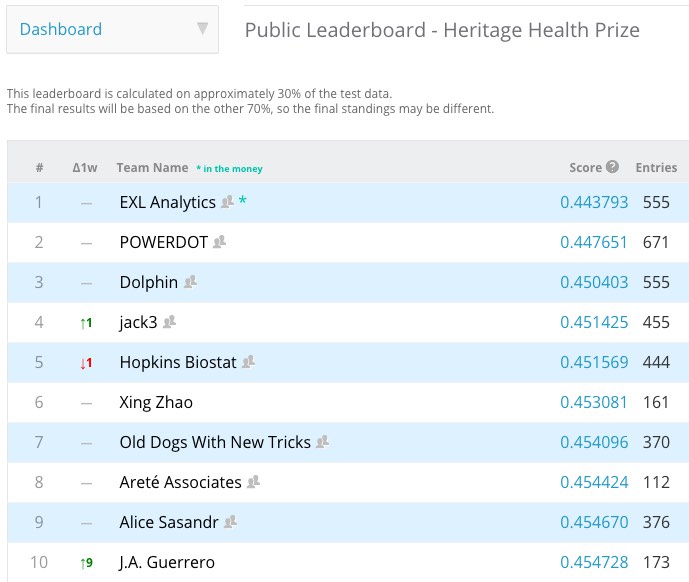
We see an improvement from 0.462311 (rank 146) to 0.451868 (rank 6).
The bottom line is: It seems to work reasonably well (under various semi-principled modeling assumptions I made). From the looks of it this might have given you an improvement from rank 150ish to 6ish within 700 submissions. Note there was a single team with 671 submissions. There’s a pretty good gap between number one on thepublic leaderboard and the rest. While possible in principle, it took me a bunch more submissions to get to the top. I should say though that I used the completely generic code from above without any optimizations specific to the competition. I didn’t even look at the data points (as I don’t have them). It’s possible that using the data and domain knowledge could improve things much further. I chose the Heritage Health prize, because it was the highest prized Kaggle competition ever (3 million dollars) and it ran for two years with a substantial number of submissions.
How robust is your benchmark?
There’s a broad lesson to be learned from this example. As computer scientists we love numerical benchmarks and rankings of all sorts. They look so objective and scientific that we easily forget how any benchmark is just a proxy for a more complex question. Every once in a while we should step back and ask: How robust is the benchmark? Do improvements in our benchmark really correspond to progress on the original problem? What I’d love to see in all empirical branches of computer science are adversarial robustness evaluations of various benchmarks. How far can we get by gaming rather than by actually making progress towards solving the problem?
Let me end on a positive note. What excites me is that the serious problems we saw in this post actually do have a fix (both in theory and in practice)! So, stay tuned for my next post.
Competing in a data science contest without reading the data的更多相关文章
- 【转】The most comprehensive Data Science learning plan for 2017
I joined Analytics Vidhya as an intern last summer. I had no clue what was in store for me. I had be ...
- 【Repost】A Practical Intro to Data Science
Are you a interested in taking a course with us? Learn about our programs or contact us at hello@zip ...
- data mining,machine learning,AI,data science,data science,business analytics
数据挖掘(data mining),机器学习(machine learning),和人工智能(AI)的区别是什么? 数据科学(data science)和商业分析(business analytics ...
- 数据挖掘(data mining),机器学习(machine learning),和人工智能(AI)的区别是什么? 数据科学(data science)和商业分析(business analytics)之间有什么关系?
本来我以为不需要解释这个问题的,到底数据挖掘(data mining),机器学习(machine learning),和人工智能(AI)有什么区别,但是前几天因为有个学弟问我,我想了想发现我竟然也回答 ...
- 51 Free Data Science Books
51 Free Data Science Books A great collection of free data science books covering a wide range of to ...
- Introducing DataFrames in Apache Spark for Large Scale Data Science(中英双语)
文章标题 Introducing DataFrames in Apache Spark for Large Scale Data Science 一个用于大规模数据科学的API——DataFrame ...
- R8:Learning paths for Data Science[continuous updating…]
Comprehensive learning path – Data Science in Python Journey from a Python noob to a Kaggler on Pyth ...
- A Complete Tutorial to Learn Data Science with Python from Scratch
A Complete Tutorial to Learn Data Science with Python from Scratch Introduction It happened few year ...
- 15 Most Read Data Science Articles in 2015. So far …
15 Most Read Data Science Articles in 2015. So far … We've compiled the latest set of "most rea ...
随机推荐
- MongoDB - Introduction to MongoDB, BSON Types
BSON is a binary serialization format used to store documents and make remote procedure calls in Mon ...
- Nginx - Rewrite Module
Initially, the purpose of this module (as the name suggests) is to perform URL rewriting. This mecha ...
- Warrior!之家与Warrior!博客网站发布
这个网站从大一下学期就开始做,断断续续,一开始感觉无从下手,做了一个草稿便停止了.最近再拿回来,感觉并没有什么难度,便把它做完了,采用ajax页内跳转,对几个搜索引擎都有seo,目前谷歌搜索“Warr ...
- Asp.Net生命周期
最近回顾了一些新知识,在网上搜索了一下生命周期的相关知识:在这里与大家一起分享一下: Asp.net是微软.Net战略的一个组成部分.它相对以前的Asp有了很大的发展,引入了许多的新机制.本文就Asp ...
- UEditor上传图片等附件都出现红叉
我的环境: vs2010+netframework3.5+ueditor1_3_5-utf8-net 问题:UEditor上传图片等附件都出现红叉 尝试了网络上各种方法都不对, 后来只能自己看下ima ...
- jQuery动态添加元素并绑定事件
写网页的时候常常需要根据实际情况添加新的元素,然后这些新元素还需要绑定已有的事件,如:有一ul,点击其中某 li,根据其 id 或 value 等获取新的数据列表,并新建 ul 显示,新 ul 中的 ...
- KMeans聚类算法Hadoop实现
Assistance.java 辅助类,功能详见注释 package KMeans; import org.apache.hadoop.conf.Configuration; import org. ...
- linux find 反转 查找没有被找到的结果
在linux下,有时候需要找一些文件,还有时候这些文件格式不够统一和规范,但是需要排除的那些文件却格式统一,就可以使用find命令的反转功能 一般用find查找文件的命令是: find . -name ...
- 51nod1256乘法逆元
1256 乘法逆元 基准时间限制:1 秒 空间限制:131072 KB 分值: 0 难度:基础题 收藏 关注给出2个数M和N(M < N),且M与N互质,找出一个数K满足0 < K < ...
- java 中的匿名内部类
转自http://www.cnblogs.com/nerxious/archive/2013/01/25/2876489.html 匿名内部类也就是没有名字的内部类 正因为没有名字,所以匿名内部类只能 ...