
使用heap profiler进行内存占用分析
最近在项目中用到了google的heap profiler工具来分析内存占用,效果非常显著,因此在这里写一篇博客记录一下使用过程中遇到的一些问题。
heap profiler依赖于tcmalloc,所以先要在本机安装tcmalloc,安装过程非常的简单。然后开始使用tcmalloc进行编译自己写的程序。
- 生成堆栈快照
先写一段申请大量内存的代码:
heap_profiler.cpp
   #include <iostream>

   #include <unistd.h>

   int* create(unsigned int size)

   {

       return new int[size];

   }

   int main()

  {

      int count = ;

      int* array[count];

      unsigned int size =  * ;

      for (int i = ; i < count; ++i) {

          sleep();

          array[i] = create( * size);

          int* b = new int[ * size];

      }

      for (int i = ; i < count; ++i) {

          delete[] array[i];

      }

  }
接着进行编译:
$ g++ heap_profiler.cpp -ltcmalloc -g -o main
然后执行如下命令:
$ HEAPPROFILE=test ./main

Starting tracking the heap

Dumping heap profile to test..heap ( MB currently in use)

Dumping heap profile to test..heap ( MB currently in use)

Dumping heap profile to test..heap ( MB currently in use)

Dumping heap profile to test..heap ( MB currently in use)

Dumping heap profile to test..heap (Exiting,  MB in use)

$ ls

heap_profiler.cpp  main  test..heap  test..heap  test..heap  test..heap  test..heap
可以看到,这里生成了几个.heap文件,并且知道程序退出时,还有80M的内存在未释放。使用pprof命令即可对这些文件进行分析。
这里需要特别注意一点,笔者之前因为项目本身用的tcmalloc是采用静态链接方式,即如下所示,编译时,静态链接了static_lib下的libtcmalloc.a:
$ ls -lh

total .0K

-rw-rw-r--  minglee minglee   Dec  : heap_profiler.cpp

drwxrwxr-x  minglee minglee .0K Dec  : static_lib

$ ls -lh static_lib/

total 5.7M

-rw-rw-r--  minglee minglee 5.6M Dec  : libtcmalloc.a

$ g++ heap_profiler.cpp -ltcmalloc -g -o main -Lstatic_lib/ -lpthread

static_lib//libtcmalloc.a(stacktrace.o): In function `GetStackTraceWithContext_libunwind(void**, int, int, void const*)':

/home/minglee/install_packet/gperftools-2.7/src/stacktrace_libunwind-inl.h:: undefined reference to `_Ux86_64_getcontext'

/home/minglee/install_packet/gperftools-2.7/src/stacktrace_libunwind-inl.h:: undefined reference to `_ULx86_64_init_local'

/home/minglee/install_packet/gperftools-2.7/src/stacktrace_libunwind-inl.h:: undefined reference to `_ULx86_64_step'

/home/minglee/install_packet/gperftools-2.7/src/stacktrace_libunwind-inl.h:: undefined reference to `_ULx86_64_step'

/home/minglee/install_packet/gperftools-2.7/src/stacktrace_libunwind-inl.h:: undefined reference to `_ULx86_64_get_reg'

static_lib//libtcmalloc.a(stacktrace.o): In function `GetStackTrace_libunwind(void**, int, int)':

/home/minglee/install_packet/gperftools-2.7/src/stacktrace_libunwind-inl.h:: undefined reference to `_Ux86_64_getcontext'

/home/minglee/install_packet/gperftools-2.7/src/stacktrace_libunwind-inl.h:: undefined reference to `_ULx86_64_init_local'

/home/minglee/install_packet/gperftools-2.7/src/stacktrace_libunwind-inl.h:: undefined reference to `_ULx86_64_step'

/home/minglee/install_packet/gperftools-2.7/src/stacktrace_libunwind-inl.h:: undefined reference to `_ULx86_64_step'

/home/minglee/install_packet/gperftools-2.7/src/stacktrace_libunwind-inl.h:: undefined reference to `_ULx86_64_get_reg'

static_lib//libtcmalloc.a(stacktrace.o): In function `GetStackFramesWithContext_libunwind(void**, int*, int, int, void const*)':

/home/minglee/install_packet/gperftools-2.7/src/stacktrace_libunwind-inl.h:: undefined reference to `_Ux86_64_getcontext'

/home/minglee/install_packet/gperftools-2.7/src/stacktrace_libunwind-inl.h:: undefined reference to `_ULx86_64_init_local'

/home/minglee/install_packet/gperftools-2.7/src/stacktrace_libunwind-inl.h:: undefined reference to `_ULx86_64_step'

/home/minglee/install_packet/gperftools-2.7/src/stacktrace_libunwind-inl.h:: undefined reference to `_ULx86_64_get_reg'

/home/minglee/install_packet/gperftools-2.7/src/stacktrace_libunwind-inl.h:: undefined reference to `_ULx86_64_step'

/home/minglee/install_packet/gperftools-2.7/src/stacktrace_libunwind-inl.h:: undefined reference to `_ULx86_64_get_reg'

/home/minglee/install_packet/gperftools-2.7/src/stacktrace_libunwind-inl.h:: undefined reference to `_ULx86_64_get_reg'

static_lib//libtcmalloc.a(stacktrace.o): In function `GetStackFrames_libunwind(void**, int*, int, int)':

/home/minglee/install_packet/gperftools-2.7/src/stacktrace_libunwind-inl.h:: undefined reference to `_Ux86_64_getcontext'

/home/minglee/install_packet/gperftools-2.7/src/stacktrace_libunwind-inl.h:: undefined reference to `_ULx86_64_init_local'

/home/minglee/install_packet/gperftools-2.7/src/stacktrace_libunwind-inl.h:: undefined reference to `_ULx86_64_step'

/home/minglee/install_packet/gperftools-2.7/src/stacktrace_libunwind-inl.h:: undefined reference to `_ULx86_64_get_reg'

/home/minglee/install_packet/gperftools-2.7/src/stacktrace_libunwind-inl.h:: undefined reference to `_ULx86_64_step'

/home/minglee/install_packet/gperftools-2.7/src/stacktrace_libunwind-inl.h:: undefined reference to `_ULx86_64_get_reg'

/home/minglee/install_packet/gperftools-2.7/src/stacktrace_libunwind-inl.h:: undefined reference to `_ULx86_64_get_reg'

collect2: error: ld returned  exit status

$ g++ heap_profiler.cpp -ltcmalloc -g -o main -Lstatic_lib/ -lpthread -lunwind

$ HEAPPROFILE=test ./main

$
导致执行的时候没有任何的反应,也不会出现 “Starting tracking the heap” 提示,更不会生成 .heap 文件。所以切记使用heap_profiler的时候需要使用动态链接,如果不想使用动态链接,也可以通过加代码的方式去生成.heap文件:
   #include <iostream>

   #include <unistd.h>

   #include <gperftools/heap-profiler.h>

   int* create(unsigned int size)

   {

       return new int[size];

   }

  int main()

  {

      HeapProfilerStart("test");

      int count = ;

      int* array[count];

      unsigned int size =  *  * ;

      for (int i = ; i < count; ++i) {

          sleep();

          array[i] = create(size);

          int* b = new int[2 * size];

      }

      for (int i = ; i < count; ++i) {

          delete[] array[i];

      }

      HeapProfilerStop();

  }
注意 第12行 和 第27行 增加的两个函数,HeapProfilerStart() 和 HeapProfilerStop()(头文件在<gperftools/heap-profiler.h>中),分别用来开启和关闭堆栈分析器,HeapProfilerStart() 需要一个参数,这个参数就是.heap文件(也就是堆栈快照)的前缀。这个前缀也可以通过环境变量 HEAPPROFILE 来设置。这也编译出来的代码,直接执行,也可以生产.heap文件:
$ g++ heap_profiler.cpp -ltcmalloc -g -o main -Lstatic_lib/ -lpthread -lunwind

$ ./main

Starting tracking the heap

Dumping heap profile to test..heap ( MB currently in use)

Dumping heap profile to test..heap ( MB currently in use)

Dumping heap profile to test..heap ( MB currently in use)

Dumping heap profile to test..heap ( MB currently in use)
可以看到,使用动态编译的方式libtcmalloc的方式来使用heap profiler能显示出更多的信息,比如程序退出时是否有未释放的内存。以下的分析阶段都是采用动态编译的方式进行。
- 使用pprof命令进行分析:
$ HEAPPROFILE=test ./main

Starting tracking the heap

Dumping heap profile to test..heap ( MB currently in use)

Dumping heap profile to test..heap ( MB currently in use)

Dumping heap profile to test..heap ( MB currently in use)

Dumping heap profile to test..heap ( MB currently in use)

Dumping heap profile to test..heap (Exiting,  MB in use)

$ pprof --text main test..heap

Using local file main.

Using local file test..heap.

Total: 480.0 MB

   400.0  83.3%  83.3%    400.0  83.3% create

    80.0  16.7% 100.0%    480.0 100.0% main

     0.0   0.0% 100.0%    480.0 100.0% __libc_start_main
可以很清晰的看到内存分配的函数以及分配的内存总量。各列含义的解读:
- 第一列包含直接占用的内存
- 第四列包含自身和所有被调用的函数占用的内存
- 第二列和第五列仅仅是第一列和第四列数字的百分比表示
- 第三列是第二列从第一行到当前行的累加值。(比如:二行三列= 一行二列 + 二行二列; 三行三列 = 一行二列 + 二行二列 + 三行二列)
另外还可以加上--stack选项(与--text同时使用):
$ pprof --text --stack main test..heap

Using local file main.

Using local file test..heap.

Total: 480.0 MB

Stacks:

 (00000000004009aa) /home/minglee/workspace/test_code/heap_profiler/heap_profiler.cpp::main

         (00007f9644cb3c04) ??::__libc_start_main

 (00000000004008b8) /home/minglee/workspace/test_code/heap_profiler/heap_profiler.cpp::create

         (000000000040096d) /home/minglee/workspace/test_code/heap_profiler/heap_profiler.cpp::main

         (00007f9644cb3c04) ??::__libc_start_main

Leak of  bytes in  objects allocated from:

    @ 004008b8 unknown

    @ 000000000040096d main /home/minglee/workspace/test_code/heap_profiler/heap_profiler.cpp:

    @ 00007f9644cb3c04 __libc_start_main ??:

Leak of  bytes in  objects allocated from:

    @ 004009aa unknown

    @ 00007f9644cb3c04 __libc_start_main ??:

   400.0  83.3%  83.3%    400.0  83.3% create

    80.0  16.7% 100.0%    480.0 100.0% main

     0.0   0.0% 100.0%    480.0 100.0% __libc_start_main
--text的选项,在查看简单的程序时还是不错的,但是面对复杂的程序时,就显得心有余力不足了。这个时候可以使用--gv选项:
$ pprof --gv main test..heap

Using local file main.

Using local file test..heap.

Dropping nodes with <= 2.4 MB; edges with <= 0.5 abs(MB)

sh: dot: command not found
这里报错是因为--gv选项需要安装 graphviz 和 gv:
$ sudo yum install graphviz gv
安装完之后如果报出如下错误:
$ pprof --gv main test..heap

Using local file main.

Using local file test..heap.

Dropping nodes with <= 2.4 MB; edges with <= 0.5 abs(MB)

gv: Unable to open the display.
说明无法打开显示器,也就是说,--gv选项,需要在带图形界面的系统上使用。转到图形界面系统上做分析,可以得到下图:
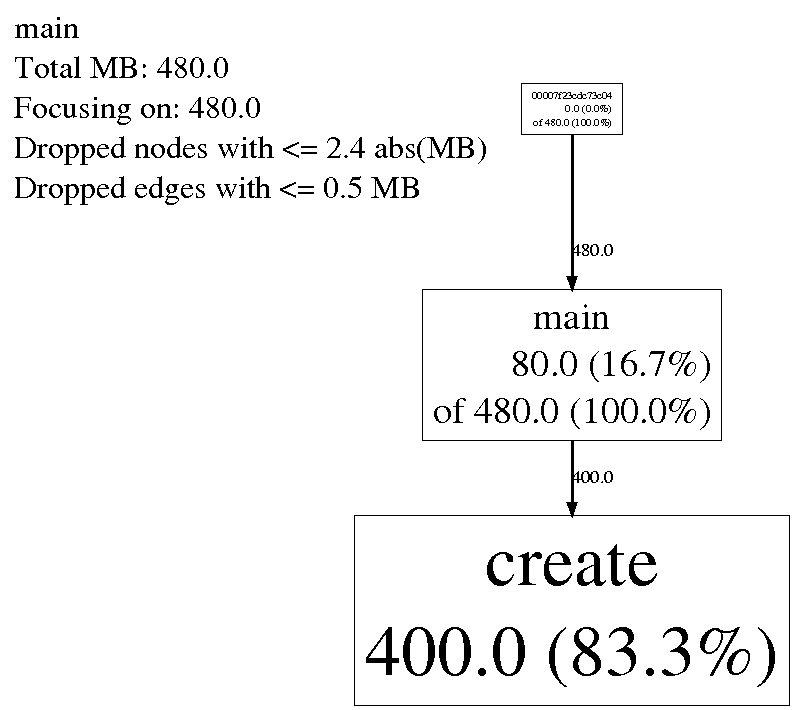
可以看到main函数占用了80M内存,占所有占用内存的16.7%,main直接或间接占用了内存480M,占所有未释放内存的100%,下面的create函数占用内存400M,占所有未释放内存的83.3%。显示的结果非常清晰明了,能够清晰的定位到问题。
此外,为了生成明确的堆栈,编译优化建议不要开,O0就好,最好再加上编译选项 -fno-omit-frame-pointer 这样能更好的显示出完整堆栈,定位起问题来会更加的轻松。
使用heap profiler进行内存占用分析的更多相关文章
- Unity3D–Texture图片空间和内存占用分析(转载)
原地址:http://www.unity蛮牛.com/home.php?mod=space&uid=1801&do=blog&id=756 Texture图片空间和内存占用分析 ...
- Unity3D–Texture图片空间和内存占用分析
Texture图片空间和内存占用分析.由于U3D并没有很好的诠释对于图片的处理方式,所以很多人一直对于图集的大小和内存的占用情况都不了解.在此对于U3D的图片问题做一个实际数据的分析.此前的项目都会存 ...
- PHP查询MySQL大量数据的内存占用分析
这篇文章主要是从原理, 手册和源码分析在PHP中查询MySQL返回大量结果时, 内存占用的问题, 同时对使用MySQL C API也有涉及. 昨天, 有同事在PHP讨论群里提到, 他做的一个项目由于M ...
- 性能分析 | Linux 内存占用分析
这篇博客主要介绍 linux 环境下,查看内存占用的两种方式:使用 ps,top等命令:查看/proc/[pid]/下的文件.文章简要介绍了命令的使用方法与一些参数意义,同时对/proc/[pid]/ ...
- WPF 属性系统 依赖属性之内存占用分析
关于WPF的属性系统园子内有不少这方面的文章.里面大都提到了WPF依赖属性的在内存方面的优化.但是里面大都一笔带过.那么WPF到底是怎么样节约内存的.我们通过WPF属性和普通的CLR属性对比来看一下W ...
- linux内存占用分析
概述 想必在linux上写过程序的同学都有分析进程占用多少内存的经历,或者被问到这样的问题——你的程序在运行时占用了多少内存(物理内存)?通常我们可以通过top命令查看进程占用了多少内存.这里我们可以 ...
- Spark BlockManager的通信及内存占用分析(源码阅读九)
之前阅读也有总结过Block的RPC服务是通过NettyBlockRpcServer提供打开,即下载Block文件的功能.然后在启动jbo的时候由Driver上的BlockManagerMaster对 ...
- 项目中Map端内存占用的分析
最近在项目中开展重构活动,对Map端内存尽量要省一些,当前的系统中Map端内存最高占用大概3G左右(设置成2G时会导致Java Heap OOM).虽然个人觉得占用不算多,但是显然这样的结果想要试 ...
- 【经验】使用Profiler工具分析内存占用情况
Unity3D为我们提供了一个强大的性能分析工具Profiler.今天我们就使用Profiler来具体分析一下官方样例AngryBots的内存使用信息数据. 首先打开Profiler选择Memory选 ...
随机推荐
- JavaScript中字符串截取函数slice()、substring()、substr()
在js中字符截取函数有常用的三个slice().substring().substr()了,下面我来给大家介绍slice().substring().substr()函数在字符截取时的一些用法与区别吧 ...
- CentOS常用基础命令汇总
1.关机 (系统的关机.重启以及登出 ) 的命令 shutdown -h now 关闭系统(1) init 0 关闭系统(2) telinit 0 关闭系统(3) shutdown -h hours: ...
- LG4475 巧克力王国
题意 巧克力王国里的巧克力都是由牛奶和可可做成的.但是并不是每一块巧克力都受王国人民的欢迎,因为大家都不喜欢过于甜的巧克力. 对于每一块巧克力,我们设 x 和 y 为其牛奶和可可的含量.由于每个人对于 ...
- MySQL中地理位置数据扩展geometry的使用心得
最近学习了些MySQL geometry数据存储和计算,在这里记录下. 1. 环境 geometry推荐在5.6版本以上使用,尽管大部分功能在5.5已经可用,除了距离计算函数st_distance等新 ...
- Bootstrap树控件(Tree控件组件)使用经验分享
前言:很多时候我们在项目中需要用到树,有些树仅仅是展示层级关系,有些树是为了展示和编辑层级关系,还有些树是为了选中项然后其他地方调用选中项.不管怎么样,树控件都是很多项目里面不可或缺的组件之一.今天, ...
- bzoj 3671 [Noi2014]随机数生成器——贪心(时间复杂度分配)
题目:https://www.lydsy.com/JudgeOnline/problem.php?id=3671 设 x 为一个点的行号, y 为一个点的列号:原本想着判断一个点能不能选就是看选了的点 ...
- 3.Python连接数据库PyMySQL
1.安装PyMySQL,输入命令:pip3 install PyMySQL 2.使用Navicat,创建数据库:TESTDB,表:EMPLOYEE,字段:FIRST_NAME,LAST_NAME,AG ...
- jdk1.8新特性应用之Collection
之前说了jdk1.8几个新特性,现在看下实战怎么玩,直接看代码: public List<MSG_ConMediaInfo> getConMediaInfoList(String live ...
- Sublime + python2.7 + opencv (轻量级开发环境)
工具: 1. Python2.7,安装完成 2. 相应版本的cv2.pyd,放入到…\Python27\Lib\site-packages\下 3. 下载Sublime Text 3,破解它,网上搜个 ...
- 2、Hive UDF编程实例
Hive的UDF包括3种:UDF(User-Defined Function).UDAF(User-Defined Aggregate Function)和UDTF(User-Defined Tabl ...