
Telegraf和Grafana监控多平台上的SQL Server
问题
SQL Server在很多企业中部署在多个平台上(Windows,Linux和Container),需要一种能支持多平台的解决方案用于收集和展示相关的监控指标。
我选择企业中比较流行的监控展示工具Grafana和监控指标收集工具Telegraf进行实现。这也是为了方便与企业中已经在存在监控平台进行整合和对接。
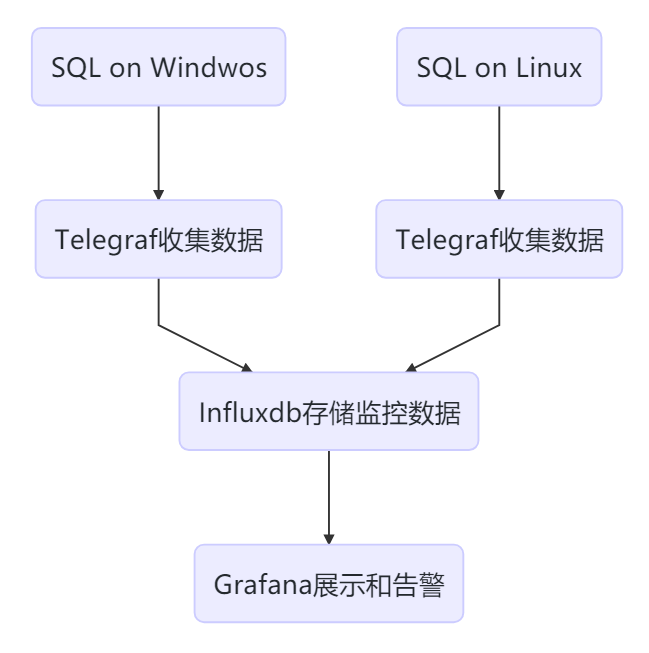
如上图所示,Telegraf部署在SQL所在host,收集数据发送给时序数据库Influxdb存储,然后Grafana用于展示数据。
解决方案
安装和配置InfluxDB
我将InfluxDB和Grafana安装在同一台CentOS主机上,生产环境中最好是分开。
# 下载1.8的stable version后进行安装

wget https://dl.influxdata.com/influxdb/releases/influxdb-1.8.0.x86_64.rpm

chmod 755 influxdb-1.8.0.x86_64.rpm

yum localinstall influxdb-1.8.0.x86_64.rpm

# 启动并设置自启动

systemctl start influxdb

systemctl enable influxdb

# 8086用于客户端的HTTP连接,8088用于CLI调用RPC进行备份和还原操作

firewall-cmd --zone=public --add-port=8086/tcp --permanent

firewall-cmd --zone=public --add-port=8088/tcp --permanent

firewall-cmd --reload

# 连接到influxdb并创建用户

fluxdb

> CREATE USER admin WITH PASSWORD '<password>' WITH ALL PRIVILEGES

# 启用http用户验证,修改influxdb.conf中http section中auth-enabled = true

vim /etc/influxdb/influxdb.conf

systemctl restart influxdb

# 创建用于存储监控数据的数据库,保存6个月的数据

influx -username 'admin' -password '<password>'

> CREATE DATABASE telegraf

> CREATE RETENTION POLICY telegraf_6m ON telegraf DURATION 180d REPLICATION 1 DEFAULT

> SHOW DATABASES
安装和配置Grafana
# 下载并安装Grafana

wget https://dl.grafana.com/oss/release/grafana-7.0.1-1.x86_64.rpm

chmod 775 grafana-7.0.1-1.x86_64.rpm

yum localinstall grafana-7.0.1-1.x86_64.rpm

# 设置自启动

systemctl start grafana-server.service

systemctl enable grafana-server.service

# 允许Grafana默认的端口3000

firewall-cmd --zone=public --add-port=3000/tcp --permanent

firewall-cmd --reload
然后在Browser中访问http://:3000,第一次访问时默登录认账号和密码都为admin,登录后会提示修改密码。
在客户端主机安装和配置Telegraf
所谓客户端,就是SQL所在主机
Telegraf连接到SQL,需要一个login,具有 VIEW SERVER STATE and VIEW ANY DEFINITION的权限,所以在每个被监控的实例上都需要创建之。
USE master;

GO

CREATE LOGIN [telegraf] WITH PASSWORD = N'1qaz@WSX';

GO

GRANT VIEW SERVER STATE TO [telegraf];

GO

GRANT VIEW ANY DEFINITION TO [telegraf];

GO
Telegraf on Linux
wget https://dl.influxdata.com/telegraf/releases/telegraf-1.14.3-1.x86_64.rpm

sudo yum localinstall telegraf-1.14.3-1.x86_64.rpm
安装完成后,先要修改Telegraf的配置文件,再启动。在配置文件中主要配置两个部分:inputs和outputs。 inputs表示监控数据从哪里来,outputs表示监控要发送到哪里去。
打开/etc/telegraf/telegraf.conf,找到[[outputs.influxdb]]部分,所有配置项默认都被注释了。我们需要删除注释并配置一些项。主要是Influxdb的地址,用户名、密码和数据库名等。
[[outputs.influxdb]]

  ## The full HTTP or UDP URL for your InfluxDB instance.

  ##

  ## Multiple URLs can be specified for a single cluster, only ONE of the

  ## urls will be written to each interval.

  # urls = ["unix:///var/run/influxdb.sock"]

  # urls = ["udp://127.0.0.1:8089"]

  urls = ["http://172.17.2.4:8086"]

  ## The target database for metrics; will be created as needed.

  ## For UDP url endpoint database needs to be configured on server side.

  database = "telegraf"

  ## The value of this tag will be used to determine the database.  If this

  ## tag is not set the 'database' option is used as the default.

  # database_tag = ""

  ## If true, the 'database_tag' will not be included in the written metric.

  # exclude_database_tag = false

  ## If true, no CREATE DATABASE queries will be sent.  Set to true when using

  ## Telegraf with a user without permissions to create databases or when the

  ## database already exists.

  skip_database_creation = true

  ## Name of existing retention policy to write to.  Empty string writes to

  ## the default retention policy.  Only takes effect when using HTTP.

  retention_policy = ""

  ## The value of this tag will be used to determine the retention policy.  If this

  ## tag is not set the 'retention_policy' option is used as the default.

  # retention_policy_tag = ""

  ## If true, the 'retention_policy_tag' will not be included in the written metric.

  # exclude_retention_policy_tag = false

  ## Write consistency (clusters only), can be: "any", "one", "quorum", "all".

  ## Only takes effect when using HTTP.

  write_consistency = "any"

  ## Timeout for HTTP messages.

  timeout = "5s"

  ## HTTP Basic Auth

  username = "admin"

  password = "<password>"
- 找到[[inputs.sqlserver]]部分,取消相关配置项的注释,servers部分连接到本地实例。
Telegraf默认的Plugin中包括了对SQL Server的实现, 这个Plugin还包括了对Azure SQL PaaS的实现
# # Read metrics from Microsoft SQL Server

 [[inputs.sqlserver]]

#   ## Specify instances to monitor with a list of connection strings.

#   ## All connection parameters are optional.

#   ## By default, the host is localhost, listening on default port, TCP 1433.

#   ##   for Windows, the user is the currently running AD user (SSO).

#   ##   See https://github.com/denisenkom/go-mssqldb for detailed connection

#   ##   parameters, in particular, tls connections can be created like so:

#   ##   "encrypt=true;certificate=<cert>;hostNameInCertificate=<SqlServer host fqdn>"

        servers = [

                        "Server=localhost;Port=1433;User Id=telegraf;Password=<yourPassword>;app name=telegraf;log=1;"

                ]

#

#   ## Optional parameter, setting this to 2 will use a new version

#   ## of the collection queries that break compatibility with the original

#   ## dashboards.

        query_version = 2

#

#   ## If you are using AzureDB, setting this to true will gather resource utilization metrics

#   # azuredb = false

#

#   ## Possible queries:

#   ## - PerformanceCounters

#   ## - WaitStatsCategorized

#   ## - DatabaseIO

#   ## - DatabaseProperties

#   ## - CPUHistory

#   ## - DatabaseSize

#   ## - DatabaseStats

#   ## - MemoryClerk

#   ## - VolumeSpace

#   ## - PerformanceMetrics

#   ## - Schedulers

#   ## - AzureDBResourceStats

#   ## - AzureDBResourceGovernance

#   ## - SqlRequests

#   ## - ServerProperties

#   ## A list of queries to include. If not specified, all the above listed queries are used.

#   # include_query = []

#

#   ## A list of queries to explicitly ignore.

#   exclude_query = [ 'Schedulers' , 'SqlRequests']
启动Telegraf之后,可以看到时已经加载的inputs和收集间隔
[root@SQL19N1 log]# systemctl status telegraf

● telegraf.service - The plugin-driven server agent for reporting metrics into InfluxDB

   Loaded: loaded (/usr/lib/systemd/system/telegraf.service; enabled; vendor preset: disabled)

   Active: active (running) since Tue 2020-05-26 14:19:07 UTC; 19min ago

     Docs: https://github.com/influxdata/telegraf

 Main PID: 12359 (telegraf)

   CGroup: /system.slice/telegraf.service

           └─12359 /usr/bin/telegraf -config /etc/telegraf/telegraf.conf -config-directory /etc/telegraf/telegraf.d

May 26 14:19:07 SQL19N1 systemd[1]: Started The plugin-driven server agent for reporting metrics into InfluxDB.

May 26 14:19:07 SQL19N1 telegraf[12359]: 2020-05-26T14:19:07Z I! Starting Telegraf 1.14.3

May 26 14:19:07 SQL19N1 telegraf[12359]: 2020-05-26T14:19:07Z I! Loaded inputs: system cpu disk diskio kernel mem processes swap sqlserver

May 26 14:19:07 SQL19N1 telegraf[12359]: 2020-05-26T14:19:07Z I! Loaded aggregators:

May 26 14:19:07 SQL19N1 telegraf[12359]: 2020-05-26T14:19:07Z I! Loaded processors:

May 26 14:19:07 SQL19N1 telegraf[12359]: 2020-05-26T14:19:07Z I! Loaded outputs: influxdb

May 26 14:19:07 SQL19N1 telegraf[12359]: 2020-05-26T14:19:07Z I! Tags enabled: host=SQL19N1

May 26 14:19:07 SQL19N1 telegraf[12359]: 2020-05-26T14:19:07Z I! [agent] Config: Interval:20s, Quiet:false, Hostname:"SQL19N1", Flush Interval:10s
Telegraf on Windows
以管理员身份执行如下PowerShell命令
# 下载软件

wget https://dl.influxdata.com/telegraf/releases/telegraf-1.14.3_windows_amd64.zip ·

    -OutFile "c:\temp\telegraf-1.14.3_windows_amd64.zip"

# 解压缩到C:\Program Files\Telegraf

Expand-Archive "c:\temp\telegraf-1.14.3_windows_amd64.zip", "C:\Program Files"

# 将telegraf安装为windows服务

C:\"Program Files"\Telegraf\telegraf.exe --service install
修改telegraf.conf中outputs.influxdb和添加inputs.sqlserver部分,这些内容和在Linux上的配置一样,就不赘述了。
conf修改完成后,可以先测试一下telegraf是否能正常启动,没问题的话就启动telegraf服务。
# 测试

C:\"Program Files"\Telegraf\telegraf.exe --config C:\"Program Files"\Telegraf\telegraf.conf --test

# 启动服务

C:\"Program Files"\Telegraf\telegraf.exe --service start
配置Grafana的数据源和Dashboard
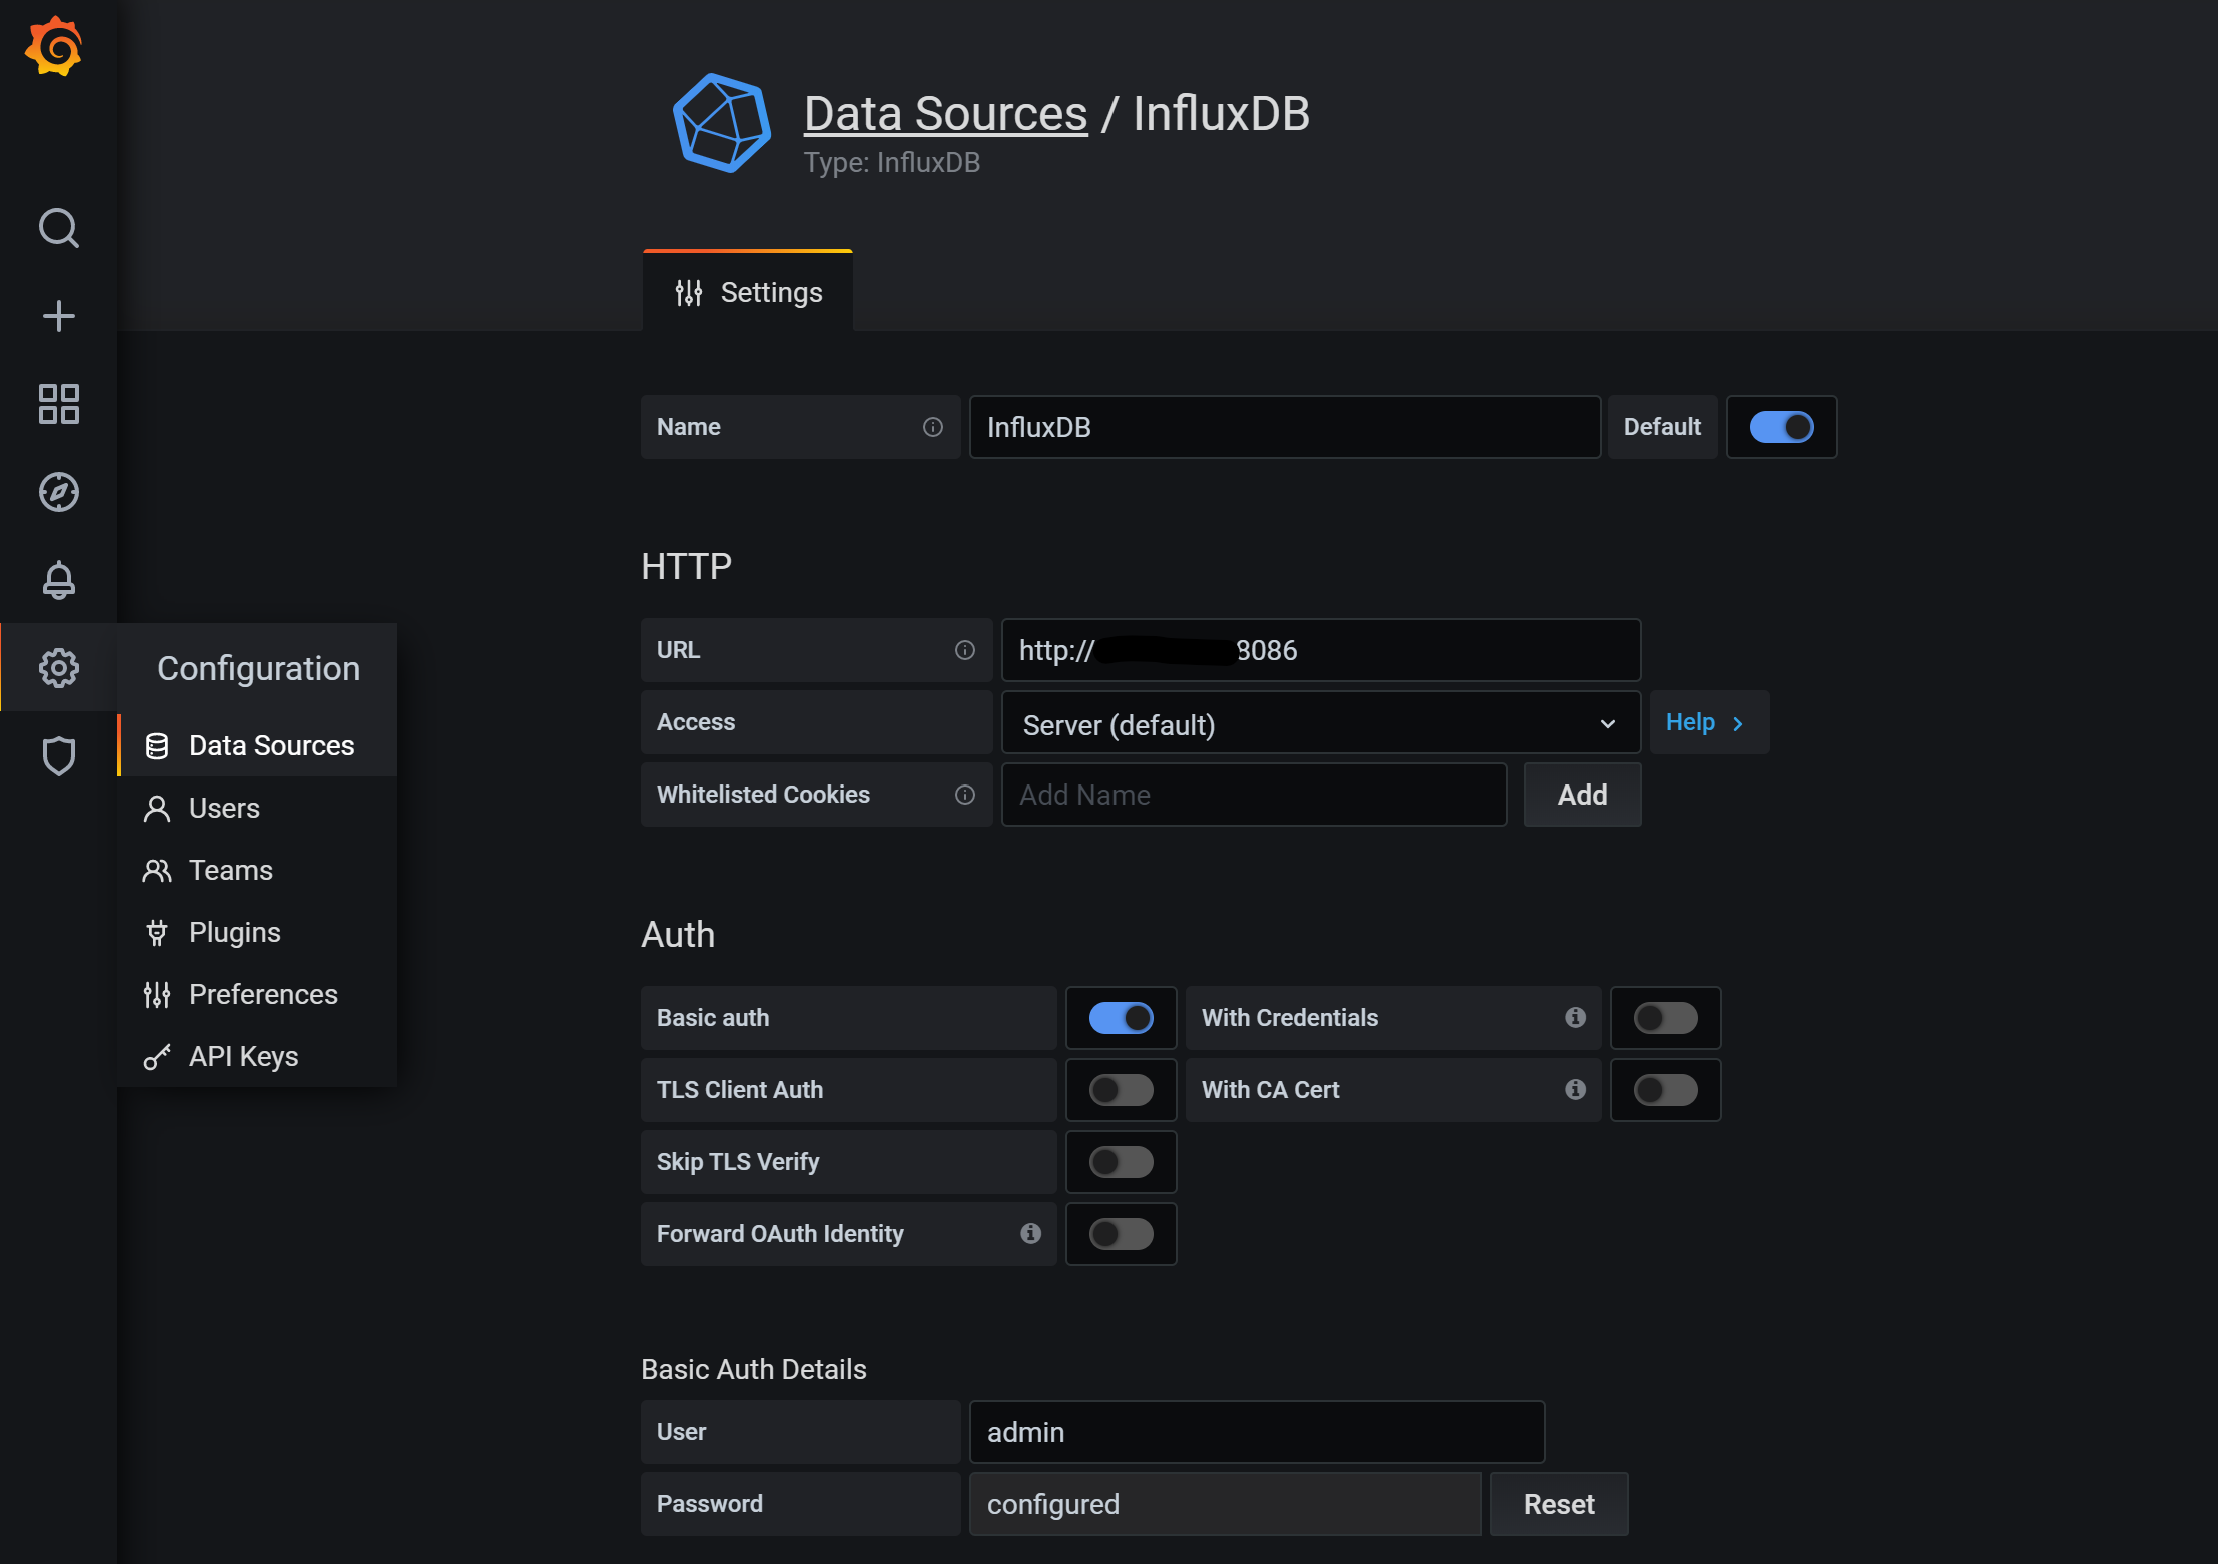
登录Grafana后,在左侧的Configuration->Data Source中配置InfluxDB数据源,填写地址、账号、密码并设置为默认数据源,如下图
Dashboard,可以自己创建,也可以在采用公开社区的(感谢热心无私的大佬们)。这里,我采用SQL Servers by Jonathan Rioux。这个Dashboard中使用的Piechart不是Grafana预置的,所以还需要安装:
# Grafana所在Host安装,重启服务生效

grafana-cli plugins install grafana-piechart-panel

systemctl restart grafana-server.service
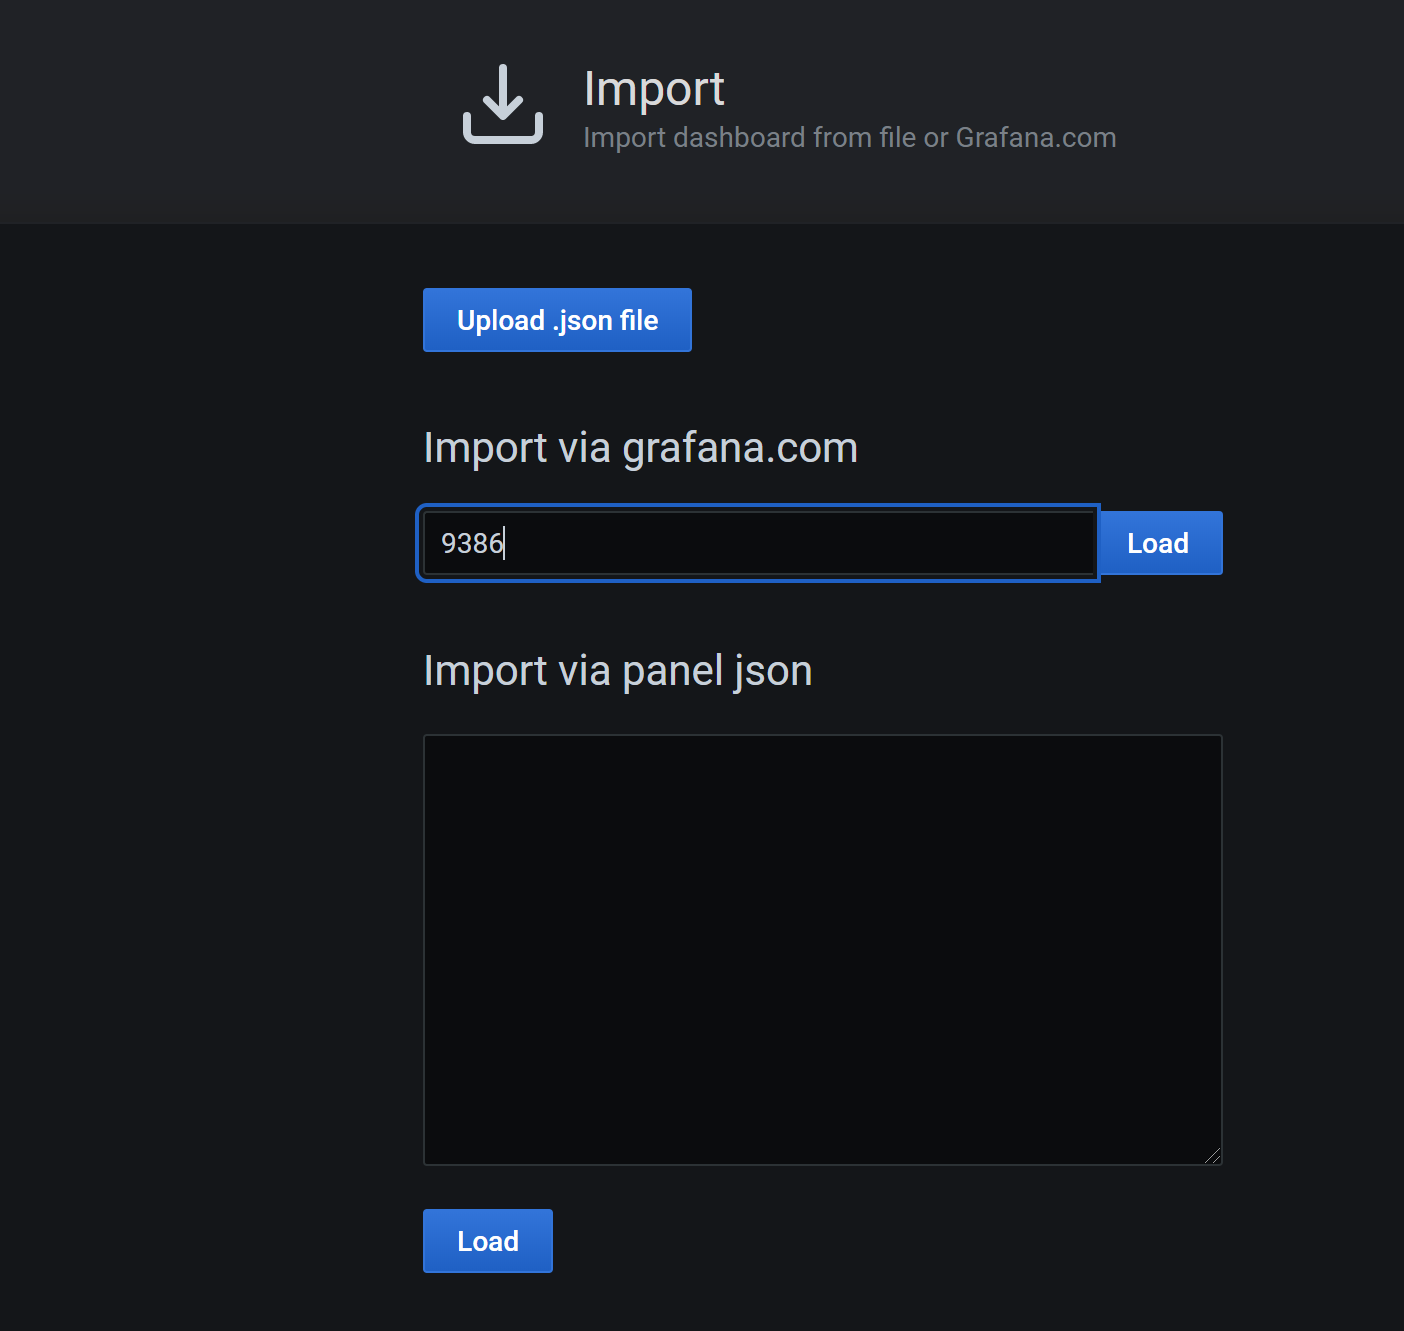
然后在Grafana界面,选择左侧的Dashboard->Import->填入Dashboard ID->Import,如下图:
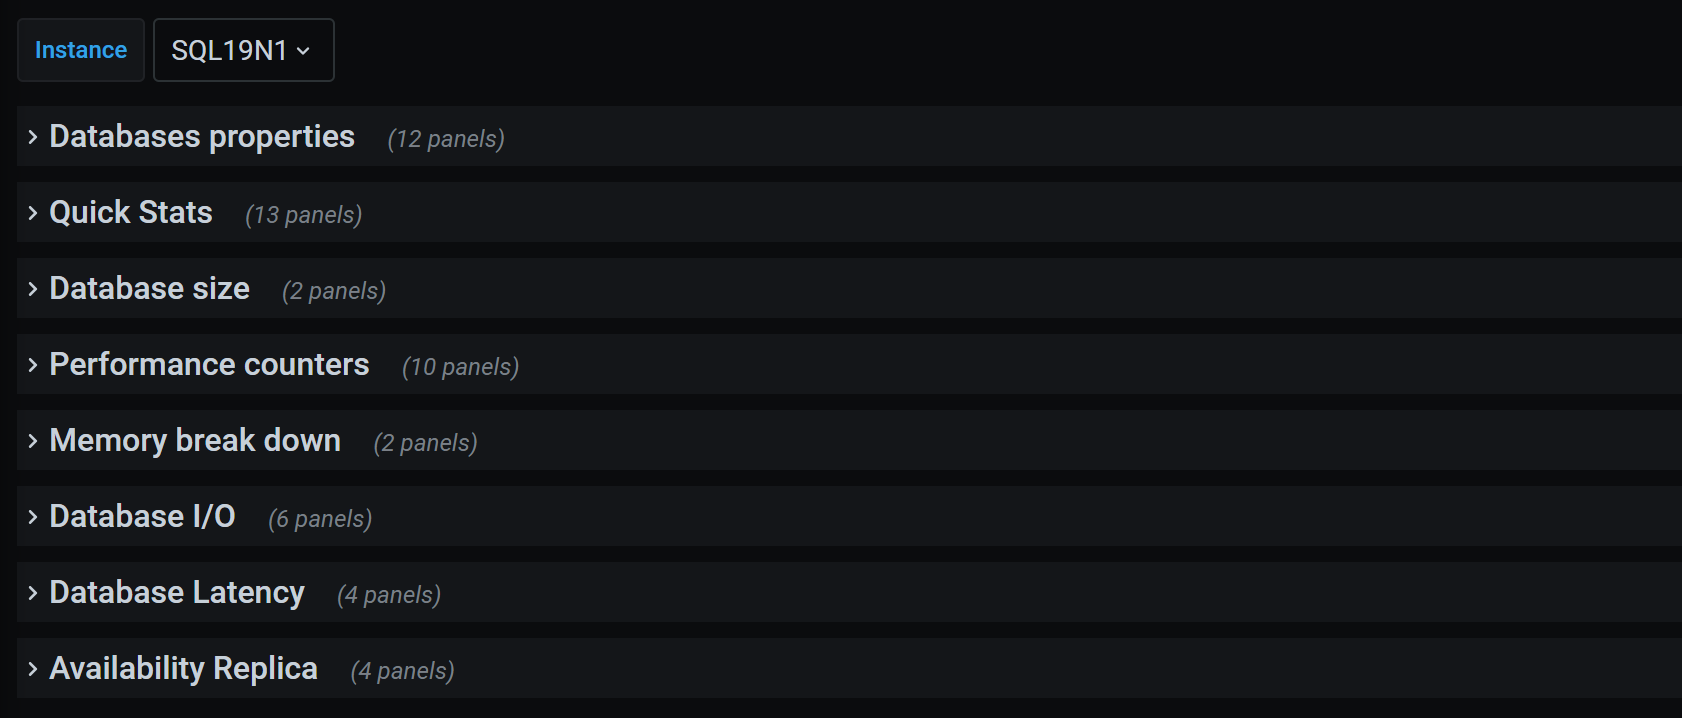
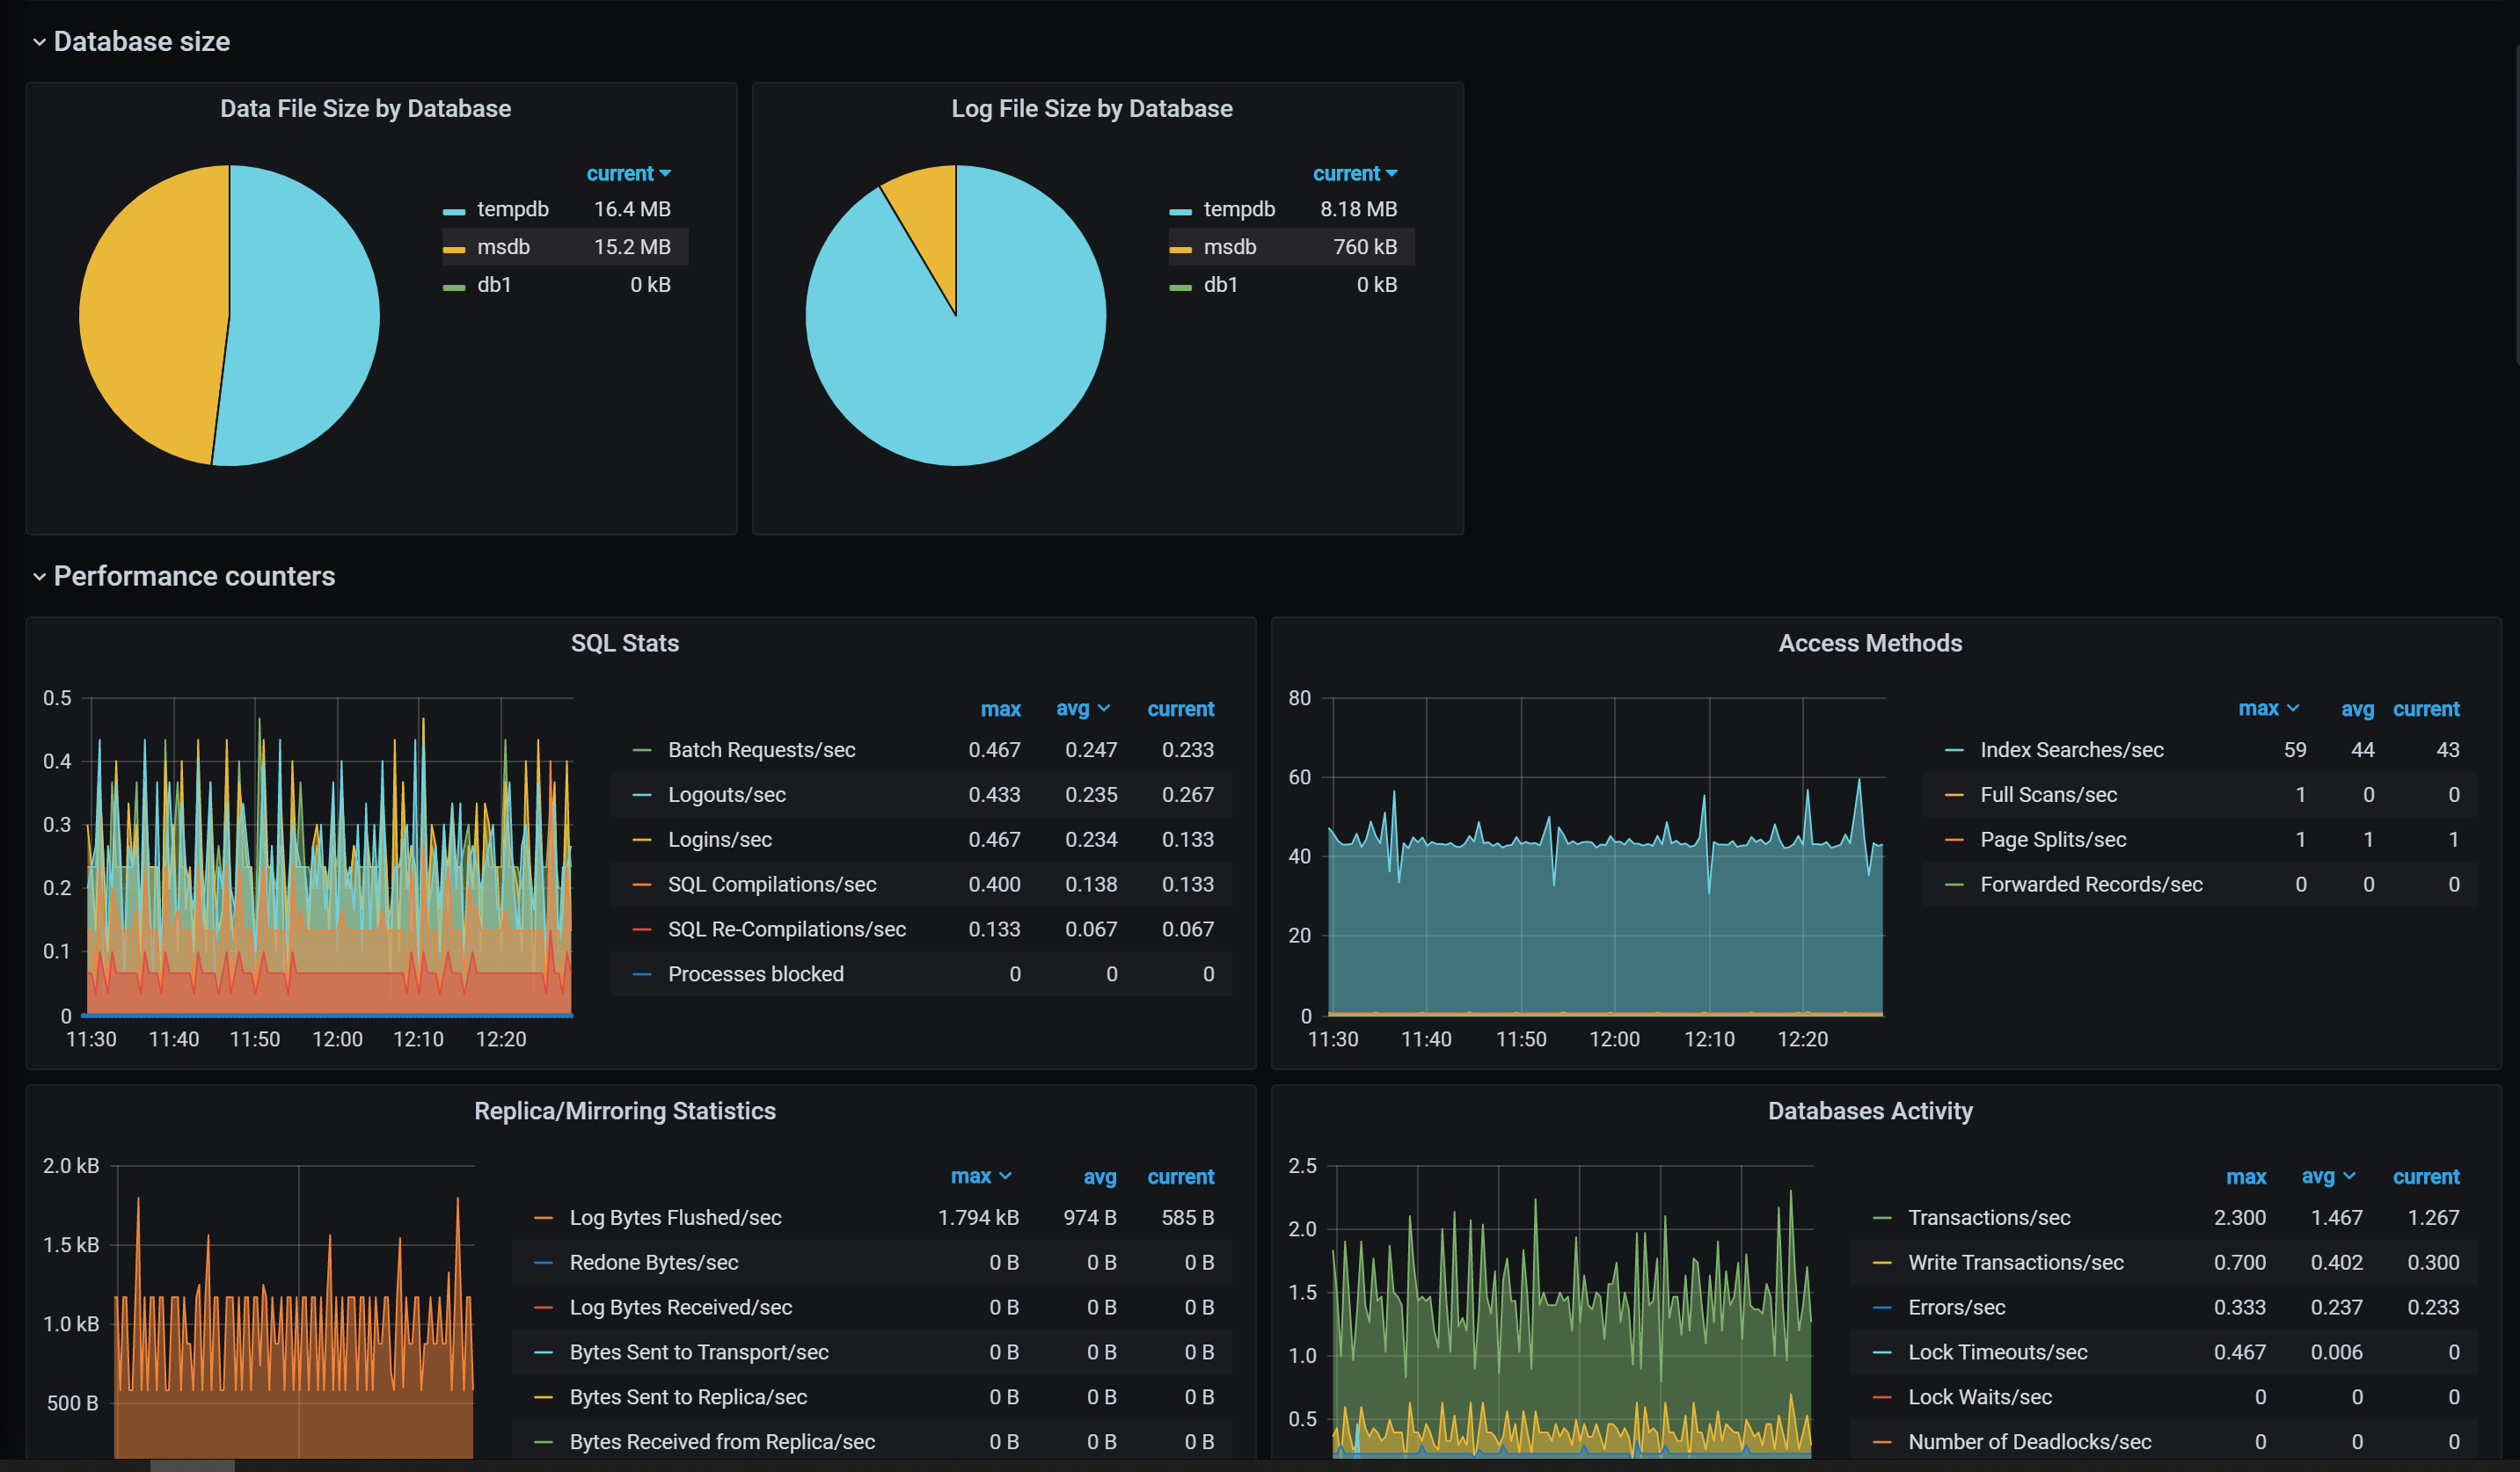
配置完成后的,可以看这个Dashboard提供的信息还比较丰富的,您也可以根据自己的需要修改和添加相关内容.

总结
实际情况中,自带的数据收集和报表不能完全满足业务需求,自定义的数据收集和自定义的Dashboard,也是非常容易实现的,下次再写
如果已经在使用Zabbix了,Grafana可以直接对接到Zabbix的数据输出。
Telegraf能非常好的支持Cloud环境,下次说说对Azure SQL PaaS的监控
本文内容仅代表个人观点,与任何公司和组织无关
Telegraf和Grafana监控多平台上的SQL Server的更多相关文章
- Telegraf和Grafana监控多平台上的SQL Server-自定义监控数据收集
问题 在上一篇文章中,我们使用Telegraf自带的Plugin配置好了的监控,但是自带的Plugin并不能完全覆盖我们想要的监控指标,就需要收集额外的自定义的监控数据,实现的方法有: 开发自己的Te ...
- 使用Telegraf + Influxdb + Grafana 监控SQLserver服务器的运行状况
使用Telegraf + Influxdb + Grafana 监控SQLserver服务器的运行状况 前言 本文在Debian9下采用Docker的方式安装Telegraf + Influxdb + ...
- SQL Server自动化运维系列——监控磁盘剩余空间及SQL Server错误日志(Power Shell)
需求描述 在我们的生产环境中,大部分情况下需要有自己的运维体制,包括自己健康状态的检测等.如果发生异常,需要提前预警的,通知形式一般为发邮件告知. 在所有的自检流程中最基础的一个就是磁盘剩余空间检测. ...
- SQL Server自动化运维系列 - 监控磁盘剩余空间及SQL Server错误日志(Power Shell)
需求描述 在我们的生产环境中,大部分情况下需要有自己的运维体制,包括自己健康状态的检测等.如果发生异常,需要提前预警的,通知形式一般为发邮件告知. 在所有的自检流程中最基础的一个就是磁盘剩余空间检测. ...
- SQL Server 自动化运维系列 - 监控磁盘剩余空间及SQL Server错误日志(Power Shell)
需求描述 在我们的生产环境中,大部分情况下需要有自己的运维体制,包括自己健康状态的检测等.如果发生异常,需要提前预警的,通知形式一般为发邮件告知. 在所有的自检流程中最基础的一个就是磁盘剩余空间检测. ...
- 搭建 Telegraf + InfluxDB + Grafana 监控遇到几个小问题
1:如果同一台服务器上安装有多个MongoDB实例,telegraf.conf 中关于 MongoDB 如何配置?配置数据在[INPUT PLUGINS的[[inputs.mongodb]]]部分. ...
- SQL Server 监控系列(文章索引)
一.前言(Introduction) SQL Server监控在很多时候可以帮助我们了解数据库做了些什么,比如谁谁在什么时候修改了表结构,谁谁在删除了某个对象,当这些事情发生了,老板在后面追着说这是谁 ...
- SQL Server自动化运维系列——监控跑批Job运行状态(Power Shell)
需求描述 在我们的生产环境中,大部分情况下需要有自己的运维体制,包括自己健康状态的检测等.如果发生异常,需要提前预警的,通知形式一般为发邮件告知. 在上一篇文章中已经分析了SQL SERVER中关于邮 ...
- SQL Server 监控 使用sp_trace_create
监控前言 上一节我们提到了MSSQL的基于SQL Event的监控,但是有些时候我们需要更加详细.适用于调优排错的监控.SQL Server内部运行的可见性是的查询调整.优化和综合排查成为可能!这一节 ...
随机推荐
- High Card Low Card G(田忌赛马进阶!!)
传送门 \(首先一定要明确一个观点,不然会完全没有思路\) \(\bullet\)\(由于前半段大的更优,后半段小的更优.\) \(\bullet\)\(所以,\)Bessie\(一定会在前(n/2) ...
- 网络流最小割 H - Internship I - Friendship
我觉得这两个最小割都还比较难. 第一个题目大意是给你一个网络,这个网络是由城市和中转站组成,终点是0,给你每一条边的流量, 问,从城市到终点最大流流完之后,是否可以增加一条路上的一条边的容量,使得最大 ...
- Golang 实现 Redis(5): 用跳表实现SortedSet
本文是使用 golang 实现 redis 系列的第五篇, 将介绍如何使用跳表实现有序集合(SortedSet)的相关功能. 跳表(skiplist) 是 Redis 中 SortedSet 数据结构 ...
- 实用,小物体检测的有监督特征级超分辨方法 | ICCV 2019
论文提出新的特征级超分辨方法用于提升检测网络的小物体检测性能,该方法适用于带ROI池化的目标检测算法.在VOC和COCO上的小物体检测最大有5~6%mAP提升,在Tsinghua-Tencent 10 ...
- CTR预估模型演变及学习笔记
[说在前面]本人博客新手一枚,象牙塔的老白,职业场的小白.以下内容仅为个人见解,欢迎批评指正,不喜勿喷![握手][握手] [再啰嗦一下]如果你对智能推荐感兴趣,欢迎先浏览我的另一篇随笔:智能推荐算法演 ...
- 【Scala】什么是隐式转换?它又能用来干嘛?该怎么用
文章目录 定义 隐式参数 隐式转换 隐式值:给方法提供参数 隐式视图 将Int和Double类型转换为String 狗狗学技能(使用别的类中的方法) 使用规则 定义 隐式参数 隐式参数指在函数或者方法 ...
- 【poj 3261】Milk Patterns 后缀数组
Milk Patterns 题意 给出n个数字,以及一个k,求至少出现k次的最长子序列的长度 思路 和poj 1743思路差不多,二分长度,把后缀分成若干组,每组任意后缀公共前缀都>=当前二分的 ...
- CF#637 C. Nastya and Strange Generator
C. Nastya and Strange Generator 题意 有一个随机全排列生成器,给出你一个全排列,让判断是否可以通过这个生成器产生. 生成器工作方式: 第i步为数字i寻找位置pos. 首 ...
- 业务系统请求zabbix图表性能调优
性能调优实践 性能调优实践 背景 问题分析 后端优化排查 前端优化排查 后端长响应排查 zabbix server 优化 总结 背景 用 vue.js 的框架 ant-design vue pro 实 ...
- TP5整合的阿里云短信接口
现阶段,短信的应用主要就是用来验证下手机号是不是正常的手机号.只要涉及到用户手机号的问题的时候,都会做短信验证码来验证下改手机号是否是正常手机号.接下来就是操作步骤. 首先要在阿里云账号上开通短信功能 ...