OpenGL——折线图柱状图饼图绘制
折线图绘制代码:
#include<iostream>

//旧版本 固定管线

#include<Windows.h>

#include <GL/glut.h>

//新版本 可编程管线

/*#define GLEW_STATIC

#include <GL/glew.h>

#include<GLFW\glfw3.h>

*/

using namespace std;

GLsizei winWidth = , winHeight = ;

GLint xRaster = , yRaster = ;

GLubyte label[] = { 'J','a','n', 'F','e','b', 'M','a','r', 'A','p','r',

                        'M','a','y', 'J','u','n', 'J','u','l', 'A','u','g',

                        'S','e','p', 'O','c','t', 'N','o','v', 'D','e','c' };

GLint dataValue[] = { ,,,,,,,,,,, };

void init()

{

    //窗口背景为白色

    glClearColor(, , , );

    glMatrixMode(GL_PROJECTION);

    gluOrtho2D(0.0, 610.0, 0.0, 500.0);

}

void lineGraph()

{

    GLint month, k;

    GLint x = ;

    glClear(GL_COLOR_BUFFER_BIT);

    //蓝色

    glColor3f(0.0, 0.0, 1.0);

    glBegin(GL_LINE_STRIP);   //画出折线段

    for (k = ; k < ; k++) {

        glVertex2i(x + k * , dataValue[k]);

    }

    glEnd();

    //红色

    glColor3f(1.0, 0.0, 0.0);     //标注各点

    for (k = ; k < ; k++) {

        glRasterPos2i(xRaster + k * , dataValue[k] - );

        glutBitmapCharacter(GLUT_BITMAP_9_BY_15, '*');

    }

    //黑色

    glColor3f(0.0, 0.0, 0.0);      //横坐标说明

    xRaster = ;

    for (month = ; month < ; month++) {

        glRasterPos2i(xRaster, yRaster);

        for (k =  * month;k <  * month + ;k++) {

            glutBitmapCharacter(GLUT_BITMAP_HELVETICA_12, label[k]);

            xRaster += ;

        }

    }

    glFlush();

}

void winReshapeFcn(GLint newWidth, GLint newHeight)

{

    glMatrixMode(GL_PROJECTION);

    glLoadIdentity();

    gluOrtho2D(, GLdouble(newWidth), , GLdouble(newHeight));

    glClear(GL_COLOR_BUFFER_BIT);

}

int main(int argc, char* argv[])

{

    //对GLUT进行初始化,并处理所有的命令行参数

    glutInit(&argc, argv);

    //指定使用RGBA模式还是颜色索引模式,还可指定使用单缓冲还是双缓冲窗口

    glutInitDisplayMode(GLUT_RGB | GLUT_SINGLE);

    //指定了窗口左上角在屏幕上的位置

    glutInitWindowPosition(, );

    //制定了窗口大小(以像素为单位)

    glutInitWindowSize(winWidth, winHeight);

    //创建支持opengl渲染的窗口,在调用glutMainLoop函数前,窗口没有显示

    glutCreateWindow("折线图");

    init();

    //显示回调函数

    //每当GLUT确定一个窗口的内容需要重新显示时,通过glutDisplayFunc()注册的那个回调函数就会被执行

    glutDisplayFunc(lineGraph);

    glutReshapeFunc(winReshapeFcn);

    //启动程序,所有窗口这时显示

    glutMainLoop();

    system("pause");

    return ;

}
运行结果:

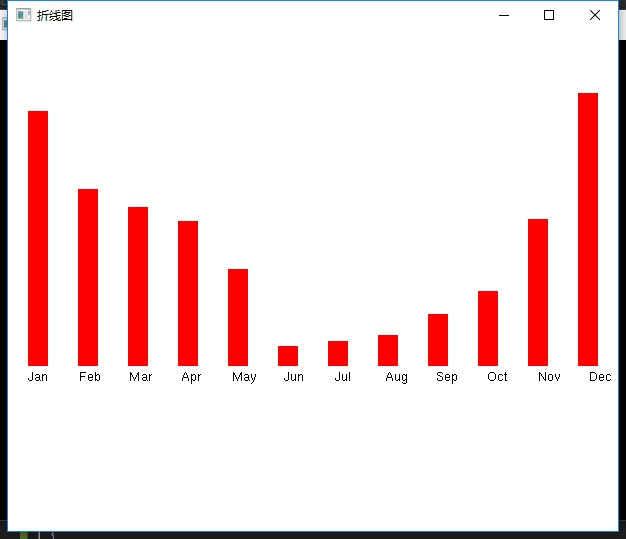
柱状图代码:
void barChart()

{

    GLint month, k;

    glClear(GL_COLOR_BUFFER_BIT);

    //红色

    glColor3f(1.0, 0.0, 0.0);

    for (k = ; k < ; k++) {

        glRecti( + k * , ,  + k * , dataValue[k]);

    }

    //黑色

    glColor3f(0.0, 0.0, 0.0);      //横坐标说明

    xRaster = ;

    for (month = ; month < ; month++) {

        glRasterPos2i(xRaster, yRaster);

        for (k =  * month;k <  * month + ;k++) {

            glutBitmapCharacter(GLUT_BITMAP_HELVETICA_12, label[k]);

            xRaster += ;

        }

    }

    glFlush();

}
运行结果:
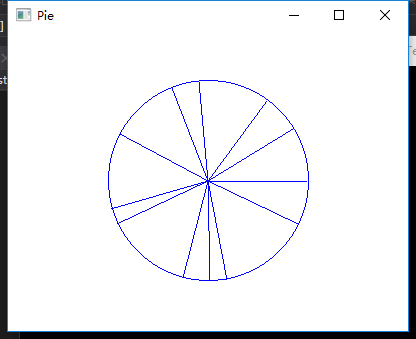
饼图代码:
#include<iostream>

#include <math.h>

//旧版本 固定管线

#include<Windows.h>

#include <GL/glut.h>

//新版本 可编程管线

/*#define GLEW_STATIC

#include <GL/glew.h>

#include<GLFW\glfw3.h>

*/

using namespace std;

const GLdouble twoPi = 6.283185;

class scrPt {

public:

    scrPt() {

        x = y = ;

    }

    GLint x, y;

    void setCoords(GLint xCoordValue, GLint yCorrdValue) {

        x = xCoordValue;

        y = yCorrdValue;

    }

    GLint getx() const {

        return x;

    }

    GLint gety() const {

        return y;

    }

    void incrementx() {

        x++;

    }

    void incrementy() {

        y--;

    }

};

GLsizei winWidth = , winHeight = ;

void init()

{

    //窗口背景为白色

    glClearColor(, , , );

    glMatrixMode(GL_PROJECTION);

    gluOrtho2D(0.0, 200.0, 0.0, 150.0);

}

void setPixel(GLint xCoord, GLint yCoord)

{

    glBegin(GL_POINTS);

    glVertex2i(xCoord, yCoord);

    glEnd();

}

void circlePlotPoints(GLint xc, GLint yc, scrPt circPt)

{

    setPixel(xc + circPt.getx(), yc + circPt.gety());

    setPixel(xc - circPt.getx(), yc + circPt.gety());

    setPixel(xc + circPt.getx(), yc - circPt.gety());

    setPixel(xc - circPt.getx(), yc - circPt.gety());

    setPixel(xc + circPt.gety(), yc + circPt.getx());

    setPixel(xc - circPt.gety(), yc + circPt.getx());

    setPixel(xc + circPt.gety(), yc - circPt.getx());

    setPixel(xc - circPt.gety(), yc - circPt.getx());

}

//中心画圆算法

void circleMidpoint(GLint xc, GLint yc, GLint radius)

{

    scrPt circPt;

    GLint p =  - radius;//中点参数初值

    circPt.setCoords(, radius);

    circlePlotPoints(xc, yc, circPt);

    while (circPt.getx() < circPt.gety()) {

        circPt.incrementx();

        if (p < )

            p +=  * circPt.getx() + ;

        else {

            circPt.incrementy();

            p +=  * (circPt.getx() - circPt.gety()) + ;

        }

        circlePlotPoints(xc, yc, circPt);

    }

}

void pieChart()

{

    scrPt circCtr, piePt;

    GLint radius = winWidth / ;

    GLdouble sliceAngle, previousSliceAngle = 0.0;

    GLint k, nSlices = ;

    GLfloat dataValues[] = { 10.0,7.0,13.0,5.0,13.0,14.0,

                            3.0,16.0,5.0,3.0,17.0,8.0 };

    GLfloat dataSum = 0.0;

    circCtr.x = winWidth / ;

    circCtr.y = winHeight / ;

    circleMidpoint(circCtr.x,circCtr.y, radius);

    for (k = ;k < nSlices;k++) {

        dataSum += dataValues[k];

    }

    for (k = ; k < ; k++) {

        sliceAngle = twoPi * dataValues[k] / dataSum + previousSliceAngle;

        piePt.x = circCtr.x + radius * cos(sliceAngle);

        piePt.y = circCtr.y + radius * sin(sliceAngle);

        glBegin(GL_LINES);

        glVertex2i(circCtr.x, circCtr.y);

        glVertex2i(piePt.x, piePt.y);

        glEnd();

        previousSliceAngle = sliceAngle;

    }

}

void displayFcn()

{

    glClear(GL_COLOR_BUFFER_BIT);

    glColor3f(0.0, 0.0, 1.0);

    pieChart();

    glFlush();

}

void winReshapeFcn(GLint newWidth, GLint newHeight)

{

    glMatrixMode(GL_PROJECTION);

    glLoadIdentity();

    gluOrtho2D(0.0, GLdouble(newWidth), 0.0, GLdouble(newHeight));

    glClear(GL_COLOR_BUFFER_BIT);

    winWidth = newWidth;

    winHeight = newHeight;

}

int main(int argc, char* argv[])

{

    //对GLUT进行初始化,并处理所有的命令行参数

    glutInit(&argc, argv);

    //指定使用RGBA模式还是颜色索引模式,还可指定使用单缓冲还是双缓冲窗口

    glutInitDisplayMode(GLUT_RGB | GLUT_SINGLE);

    //指定了窗口左上角在屏幕上的位置

    glutInitWindowPosition(, );

    //制定了窗口大小(以像素为单位)

    glutInitWindowSize(winWidth, winHeight);

    //创建支持opengl渲染的窗口,在调用glutMainLoop函数前,窗口没有显示

    glutCreateWindow("Pie");

    init();

    //显示回调函数

    //每当GLUT确定一个窗口的内容需要重新显示时,通过glutDisplayFunc()注册的那个回调函数就会被执行

    glutDisplayFunc(displayFcn);

    glutReshapeFunc(winReshapeFcn);

    //启动程序,所有窗口这时显示

    glutMainLoop();

    system("pause");

    return ;

}
运行结果:
OpenGL——折线图柱状图饼图绘制的更多相关文章
- 百度推出的echarts,制表折线图柱状图饼图等的超级工具(转)
一.简介: 1.绘制数据图表,有了它,想要网页上绘制个折线图.柱状图,从此easy. 2.使用这个百度的echarts.js插件,是通过把图片绘制在canvas上在显示在页面上. 官网对echarts ...
- G2 基本使用 折线图 柱状图 饼图 基本配置
G2的基本使用 1.浏览器引入 <!-- 引入在线资源 --> <script src="https://gw.alipayobjects.com/os/lib/antv ...
- JavaScript数据可视化编程学习(一)Flotr2,包含简单的,柱状图,折线图,饼图,散点图
一.基础柱状图 二.基础的折线图 三.基础的饼图 四.基础的散点图 一.基础柱状图 如果你还没有想好你的数据用什么类型的图表来展示你的数据,你应该首先考虑是否可以做成柱状图.柱状图可以表示数据的变化过 ...
- 安卓图表引擎AChartEngine(三) - 示例源码折线图、饼图和柱状图
折线图: package org.achartengine.chartdemo.demo.chart; import java.util.ArrayList; import java.util.Lis ...
- HighCharts之2D柱状图、折线图和饼图的组合图
HighCharts之2D柱状图.折线图和饼图的组合图 1.实例源码 ColumnLinePie.html: <!DOCTYPE html> <html> <head&g ...
- 利用pandas读取Excel表格,用matplotlib.pyplot绘制直方图、折线图、饼图
利用pandas读取Excel表格,用matplotlib.pyplot绘制直方图.折线图.饼图 数据: 折线图代码: import pandas as pdimport matplotlib. ...
- 数据可视化(Echart) :柱状图、折线图、饼图等六种基本图表的特点及适用场合
数据可视化(Echart) 柱状图.折线图.饼图等六种基本图表的特点及适用场合 参考网址 效果图 源码 <!DOCTYPE html> <html> <head> ...
- v-charts 绘制柱状图、条形图、水球图、雷达图、折线图+柱状图,附官网地址
v-charts 官网地址:https://v-charts.js.org/#/ 柱状图: <template> <ve-histogram :data="chartDat ...
- ChartControl 折线图 柱状图
添加折线图(柱状图) 拖动ChartControl到Form上 在Series Collection中添加Line(或Bar) DevExpress.XtraCharts.Series series1 ...
随机推荐
- 矩阵乘法code
VOJ1067 我们可以用上面的方法二分求出任何一个线性递推式的第n项,其对应矩阵的构造方法为:在右上角的(n-1)*(n-1)的小矩阵中的主对角线上填1,矩阵第n行填对应的系数,其它地方都填0.例如 ...
- 一步一步开发sniffer(Winpcap+MFC)(五)莫道无人能识君,其实我懂你的心——解析数据包(转)
前文已经讲过,解析数据包主要通过analyze_frame()这个函数实现的,实际上并非这个函数完成了所有的功能,其实从名字就可以看出,它只是完成了对“帧”的解析,也就是链路层数据的解析,还有anal ...
- jdbctemplate 获取数据表结构的方法&注意事项
方法一 直接查询: SqlRowSet srcSqlRowSet = srcJdbcTemplate.queryForRowSet("SELECT * FROM tablename LIMI ...
- Android 里的数据储存
数据持久化 关于数据储存,这个话题已经被反复讨论过很多次了,我是不建议把网络存储这种方式纳入到数据储存的范围的,因为这个和Android没多少关系,因此就有如下的分类: 本地储存(也称之为数据持久化, ...
- MySql之删除操作
一:删除特定行 DELETE FROM 表名 WHERE 条件: 二:删除所有行 TRUNCATE TABLE 表名; //删除重建一张表
- 1分钟试用PowerShell 5.0新功能PowerShellGet安装Script Browser和Script Analyzer
微软PowerShell 产品组上周发布了PowerShell 5.0 PowerShellGet功能.有了它,IT 人员可以方便地搜索,安装,更新PowerShell Module.在这篇博客中,我 ...
- array2json() - Convert PHP arrays to JSON
array2json is a PHP function that will convert the array given as its argument into a JSON string. T ...
- killall 、kill 、pkill 命令详解 【转】
之前常用地kill 命令就是 kill -9 XXid;kill -15 XXid;pkill 进程名: 今天发现killall也有适用场景,killall命令对杀死进程组(一个进程中有多线程的情况) ...
- Golang select
Golang下select的功能和Linux IO复用中的select, poll, epoll相似,是监听 channel 操作,当 channel 操作发生时,触发相应的动作. package m ...
- nginx与apache的参考配置
nginx与apache是两大最主流的服务器,功能强大,但配置起来也比较麻烦,对于初学者来讲可能有些地方并不完全清楚其作用,这里搜集了一些配置的作用及其使用方法.其中nginx提供了推荐配置,而apa ...