
[D3] 13. Cleaner D3 code with selection.call()
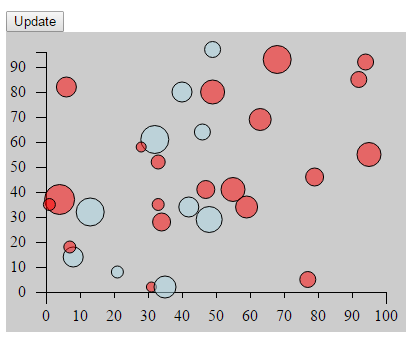
selection.call() method in D3 can aid in code organization and flexibility by eliminating the need to use chained method calls for every operation.
<!DOCTYPE html>

<html>

<head lang="en">

    <meta charset="UTF-8">

    <title></title>

    <script src="../bower_components/underscore/underscore-min.js"></script>

    <script src="../ventor/d3.min.js"></script>

    <style type="text/css">

        body {

            padding-top: 50px;

            padding-left: 100px;

        }

        #chartArea {

            width: 400px;

            height: 300px;

            background-color: #CCC;

        }

        .bar {

            display: inline-block;

            width: 20px;

            height: 75px; /* Gets overriden by D3-assigned height below */

            margin-right: 2px;

            /* fill: teal; *//* SVG doesn't have background prop, use fill instead*/

            z-index: 99;

        }

        .bubble, .center {

            display: inline-block;

            fill: purple;

            fill-opacity: 0.5;

            stroke: black;

            stroke-weight: 1px;;

            z-index: 15;

        }

        .center {

            z-index: 10;

        }

        .active {

            fill: magenta;

            fill-opacity: 0.5;

            stroke-width: 3px;

        }

        .axis path, .axis line {

            fill: none;

            stroke: #000;

            stroke-width: 1px;

            shape-rendering: crispEdges;

        }

    </style>

</head>

<body>

<button onclick="update()">Update</button>

<section id="chartArea"></section>

<script>

    function planTrasition(selection, duration, color){

        selection

                .transition()

                .duration(duration)

                .style('fill', color)

                .attr('cx', function(each_data, index) {

                    return xScale(each_data.x);

                })

                .attr('cy', function(each_data) {

                    return yScale(each_data.y);

                })

                .attr('r', function(each_data, i) {

                    return each_data.r;

                });

    }

    function stepTransition(selection) {

        selection.transition()

                .duration(600)

                .style('fill', "lightblue")

                .attr('cx', function(each_data, index) {

                    return xScale(each_data.x);

                })

                .transition()

                .duration(600)

                .attr('cy', function(each_data) {

                    return yScale(each_data.y);

                })

                .transition()

                .duration(600)

                .attr('r', function(each_data, i) {

                    return each_data.r;

                });

    }

    function newData(d){

        d.x = Math.round(Math.random() * 100);

        d.y = Math.round(Math.random() * 100);

        d.r = Math.round(5 + Math.random() * 10);

    }

    function update(){

        //Only the data which x < 50 will get update

        svg.selectAll('circle')

                .filter(function(d) {

                    return d.x < 50;

                })

                .each( newData)

                .call(stepTransition);

        svg.selectAll('circle')

                .filter(function(d) {

                    return d.x >= 50;

                })

                .each( newData)

                .call(planTrasition, 2000, "red");

    }

    var dataset = _.map(_.range(30), function(num) {

                return {

                    x: Math.round(Math.random() * 100),

                    y: Math.round(Math.random() * 100),

                    r: Math.round(5 + Math.random() * 10)

                };

            }), //reandom generate 15 data from 1 to 50

            margin = {top: 20, right: 20, bottom: 40, left: 40},

            w = 400 - margin.left - margin.right,

            h = 300 - margin.top - margin.bottom;

    var svg = d3.select('#chartArea').append('svg')

            .attr('width', w + margin.left + margin.right)

            .attr('height', h + margin.top + margin.bottom)

            .append('g') //The last step is to add a G element which is a graphics container in SBG.

            .attr('transform', 'translate(' + margin.left + ', ' + margin.top + ')'); //Then offset that graphic element by our left and top margins.

    var yScale = d3.scale.linear()

            .domain([0, d3.max(dataset, function(d) {

                return d.y; //tell the max function just need to care about y prop

            })])

            .range([h, 0]);

    var yAxis = d3.svg.axis()

            .scale(yScale)

            .orient('left')

            .ticks(10)

            .innerTickSize(10)

            .outerTickSize(10)

            .tickPadding(10);

    svg.append('g')

            .attr('class', 'y axis')

            .attr('transform', 'translate(0,0)')

            .call(yAxis);

    var xScale = d3.scale.linear()

            .domain([0, 100])

            .range([0, w]);

    var xAxis = d3.svg.axis()

            .scale(xScale)

            .orient('bottom')

            .ticks(10)

            .innerTickSize(6)

            .outerTickSize(12)

            .tickPadding(12);

    svg.append('g')

            .attr('class', 'x axis')

            .attr('transform', 'translate(0, ' + h + ')')

            .call(xAxis);

    svg.selectAll('circle')

            .data(dataset)

            .enter()

            .append('circle')// svg doesn't have div, use rect instead

            .attr('class', "bubble")

            .attr('cx', function(each_data, index) {

                return xScale(each_data.x);

            })

            .attr('cy', function(each_data) {

                return yScale(each_data.y);

            })

            .attr('r', function(each_data, i) {

                return each_data.r;

            })

            .on('mouseover', function() {

                d3.select(this).classed('active', true)

            })

            .on('mouseleave', function() {

                d3.select(this).classed('active', false)

            })

            .on('mousedown', function(d) {

                var p_cx = d.x, p_cy = d.y, p_r = d.r;

                d3.select(this).transition().duration(500).attr('r', d.r * 1.5);

                svg.append('circle')

                        .attr('class', "center")

                        .attr('cx', function() {

                            return xScale(p_cx);

                        })

                        .attr('cy', function() {

                            return yScale(p_cy);

                        })

                        .attr('r', function() {

                            return p_r / 4;

                        })

                        .style('fill', 'red');

            })

            .on('mouseup', function(d) {

                d3.select(this).transition().duration(250).delay(100).attr('r', d.r)

            });

</script>

</body>

</html>
[D3] 13. Cleaner D3 code with selection.call()的更多相关文章
- D3笔记01——D3简介与安装
1 D3简介 发布于2011年,全称Data-Driven Documents,直译为“数据驱动的文档”. 简单概括为一句话:D3是一个Javascript的函数库,是用来做数据可视化的.文档指DOM ...
- d3.js:数据可视化利器之 selection:选择集
选择集/selection 选择集/selection是d3中的核心对象,用来封装一组从当前HTML文档中选中的元素: d3提供了两个方法用来创建selection对象: select(selecto ...
- A better way to learn D3 js - iLearning D3.js
iLearning D3.js Basic is an iPad app to learn and code with D3. In 1.1 version, new tutorial is prov ...
- [D3] 11. Basic D3 chart interactivity on(), select(this), classed(class, trueorfalse)
<!DOCTYPE html> <html> <head lang="en"> <meta charset="UTF-8&quo ...
- [D3] Creating a D3 Force Layout in React
Learn how to leverage d3's layout module to create a Force Layout inside of React. We'll take a look ...
- D3中selection之使用
1. 极为重要的reference: [1] How selections works. http://bost.ocks.org/mike/selection/ [2] Nested selecti ...
- D3中动画(transition函数)的使用
关于transition的几个基本点: 1. transition()是针对与每个DOM element的,每个DOM element的transition并不会影响其他DOM element的tra ...
- 精通D3.js学习笔记(1)基础的函数
买了本吕大师的d3可视化.最近来学习一下,做个笔记. 1.选择元素 select(第一元素) 和selectAll(全部的元素) 类似css的选择器.也可以是dom选中的. var i ...
- 使用JavaScript和D3.js实现数据可视化
欢迎大家前往腾讯云+社区,获取更多腾讯海量技术实践干货哦~ 本文由独木桥先生发表于云+社区专栏 介绍 D3.js是一个JavaScript库.它的全称是Data-Driven Documents(数据 ...
随机推荐
- nexus3添加第三方jar
最近在看maven的打包及管理,然後就看到nexus,自己在安裝的時候就下載了最新版的nexus-3.2.0-01-win64,按照文档部署后启动,浏览.之前一致使用的是2.0的,所以还是需要导出点点 ...
- hdu 1824
也是一道2-sat的入门题: 不过题目描述的不清楚,看了别人的题解才知道题意: 和上面的那题差不多,一个模板: 代码: #include<cstdio> #include<stack ...
- keybd_event函数用法
转自不用winio,直接达到驱动级模拟键盘效果的keybd_event函数用法 键盘模拟技术是在编写游戏外挂时经常使用的技术.但是由于很多游戏采用了directinput的方式,使得发送的一般键盘消息 ...
- Cocos2d-x win7下 android环境搭建
原地址:http://blog.csdn.net/xingboss3/article/details/8267512/ 综合了以下三篇 http://www.cnblogs.com/lhming/ar ...
- mysql connect
def connect(_host, _user, _passwd, _db, _charset, _port): conn = MySQLdb.connect(host=_host, user=_u ...
- php 文件上传 以及保存在本地的乱码问题处理
要知道两点: ①浏览器传到PHP程序中是UTF-8编码 ②PHP程序保存上传的文件,要转换成GBK编码才保存在本地中,否则如果直接使用浏览器传过来的文件名保存在本地,会出现文件名乱码. <?ph ...
- Fibonacci数列对任何数取模都是一个周期数列
题目是要求出斐波那契数列n项对一个正整数取模,那么可以把斐波那契数列取模后得到的数列周期求出来. 比如下面一个题目:求出f[n]的后4位,先求出数列对10000取模的周期,然后再查找即可. #incl ...
- ArrayList集合排序
using System;using System.Collections;using System.Collections.Generic;using System.Text; namespace ...
- ASP.NET之JSONHelper操作
转自:http://www.cnblogs.com/PEPE/archive/2012/02/13/Pepe_Yu.html 之前说到了Ext.Net中GridPanel行取值的问题(Ext.Net开 ...
- Unix环境高级编程
1. windows下编辑的程序怎么上传到linux下执行? //Service vsftpd status查看linux ftp服务是否开启: Linuxi ip:192.168.40.128 打 ...