Zabbix--04 自定义模版、web监控
一、自定义模版
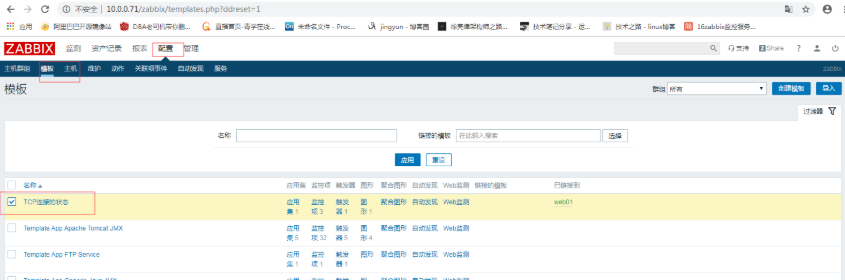
1.创建模版
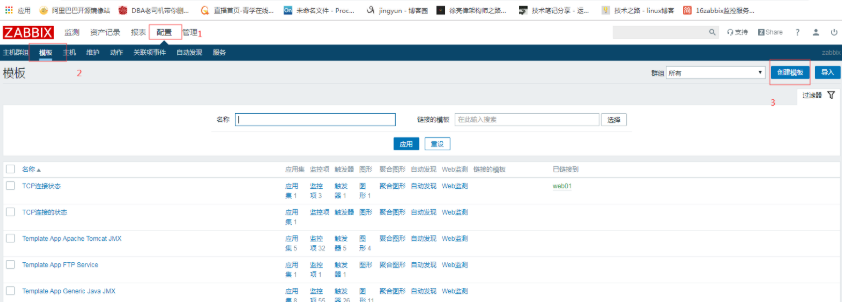
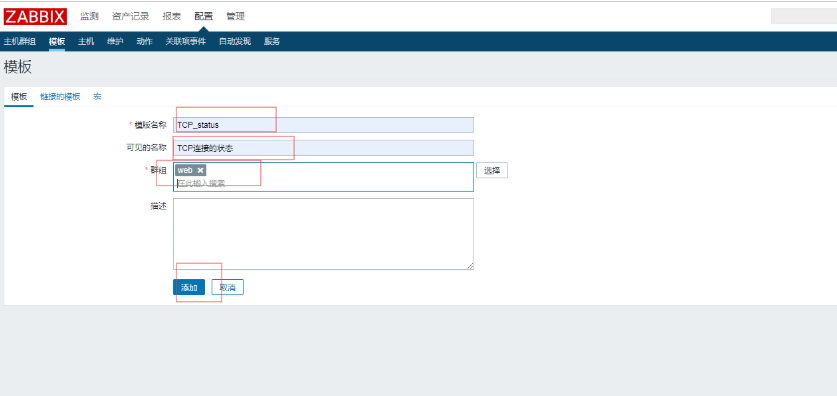
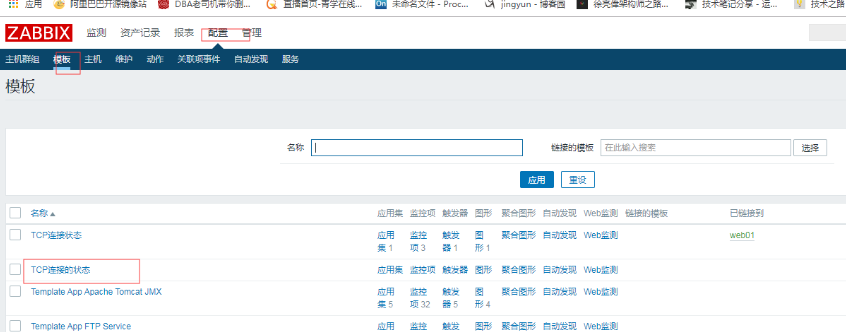
1.1克隆出三台

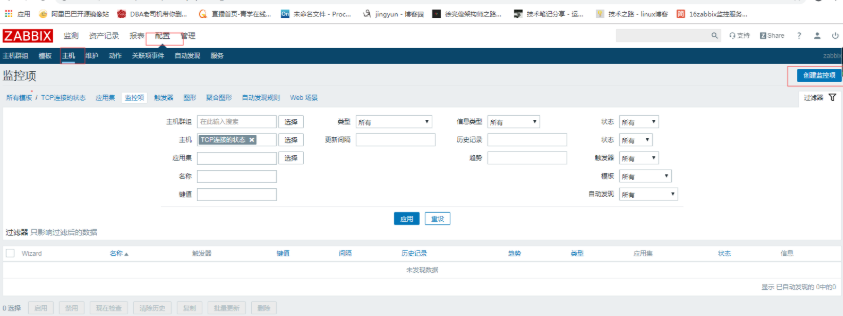
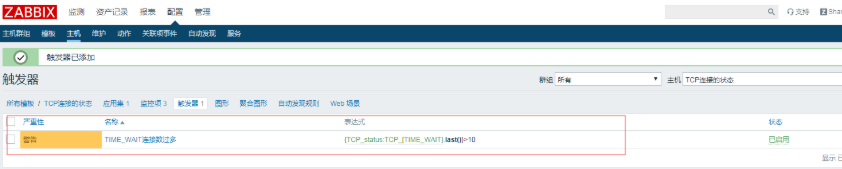
1.2直接创建好触发器
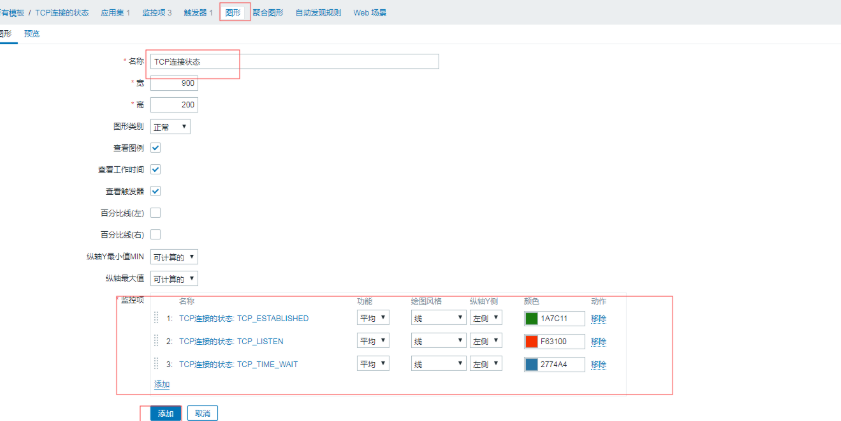
1.3创建图形
模版创建好,再次创建主机就可直接选择用
修改模版,可全部生效
例如:把时间修改成30天


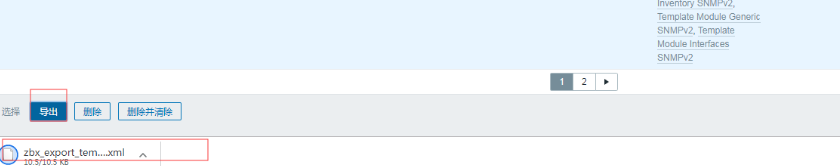
2.导出模版
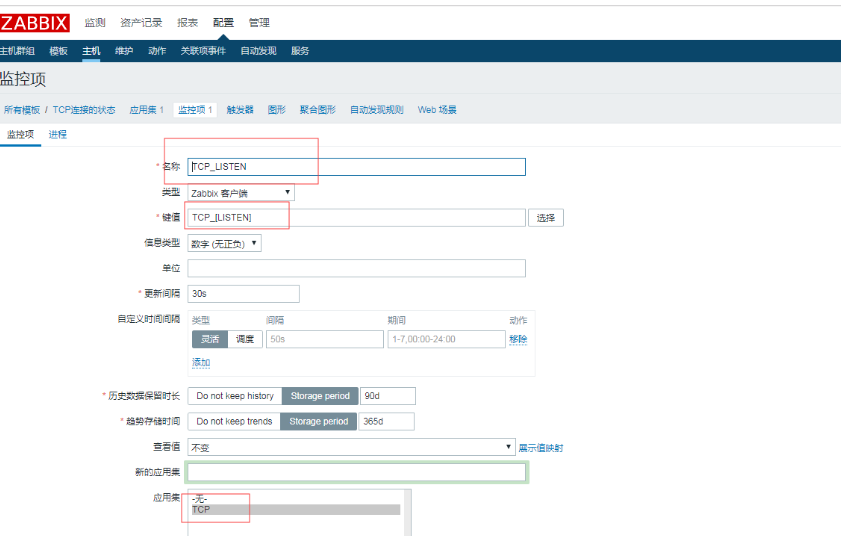
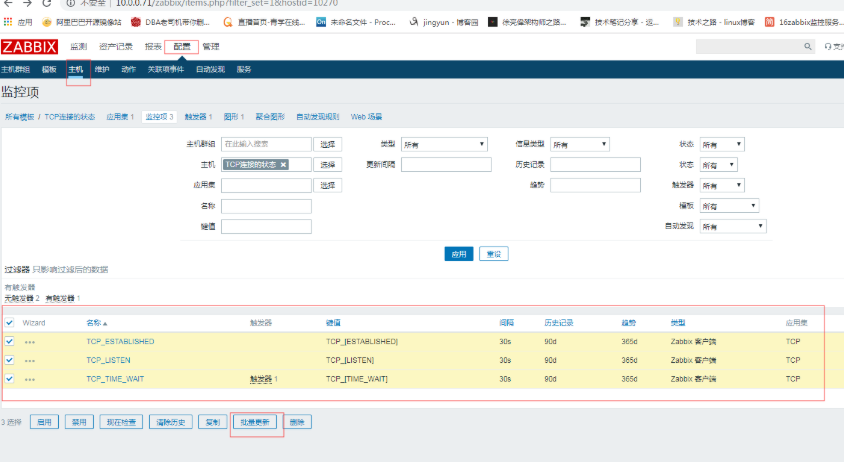
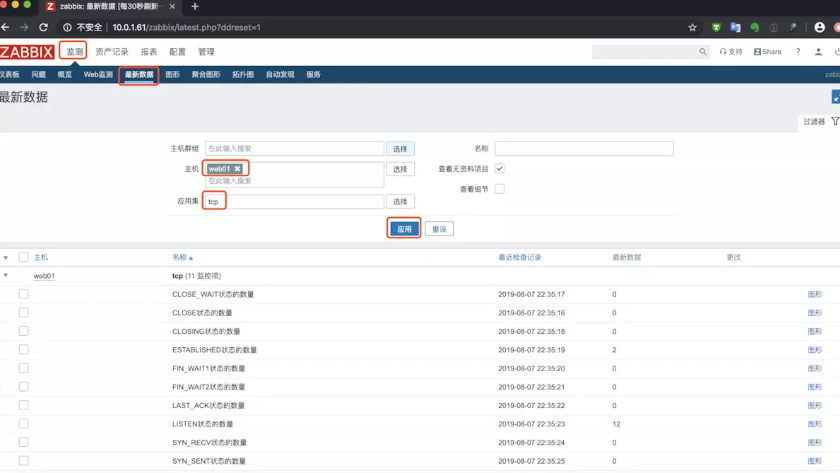
3.监控TCP11种状态
编写zabbix配置文件
[root@web01 /etc/zabbix/zabbix_agentd.d]# cat zbx_tcp.conf

UserParameter=ESTABLISHED,netstat -ant|grep  -c 'ESTABLISHED'

UserParameter=SYN_SENT,netstat -ant|grep  -c 'SYN_SENT'

UserParameter=SYN_RECV,netstat -ant|grep  -c 'SYN_RECV'

UserParameter=FIN_WAIT1,netstat -ant|grep  -c 'FIN_WAIT1'

UserParameter=FIN_WAIT2,netstat -ant|grep  -c 'FIN_WAIT2'

UserParameter=TIME_WAIT,netstat -ant|grep  -c 'TIME_WAIT'

UserParameter=CLOSE,netstat -ant|grep  -c 'CLOSE'

UserParameter=CLOSE_WAIT,netstat -ant|grep  -c 'CLOSE_WAIT'

UserParameter=LAST_ACK,netstat -ant|grep  -c 'LAST_ACK'

UserParameter=LISTEN,netstat -ant|grep  -c 'LISTEN'

UserParameter=CLOSING,netstat -ant|grep  -c 'CLOSING'
3.2.重启zabbix-agent
[root@web01 ~]# systemctl restart zabbix-agent.service
3.3.测试监控项
使用zabbix-get命令测试
[root@m01 ~]# yum install zabbix-get.x86_64 -y

[root@m01 ~]# zabbix_get -s 10.0.1.7 -k ESTABLISHED

2

[root@m01 ~]# zabbix_get -s 10.0.1.7 -k LISTEN

12
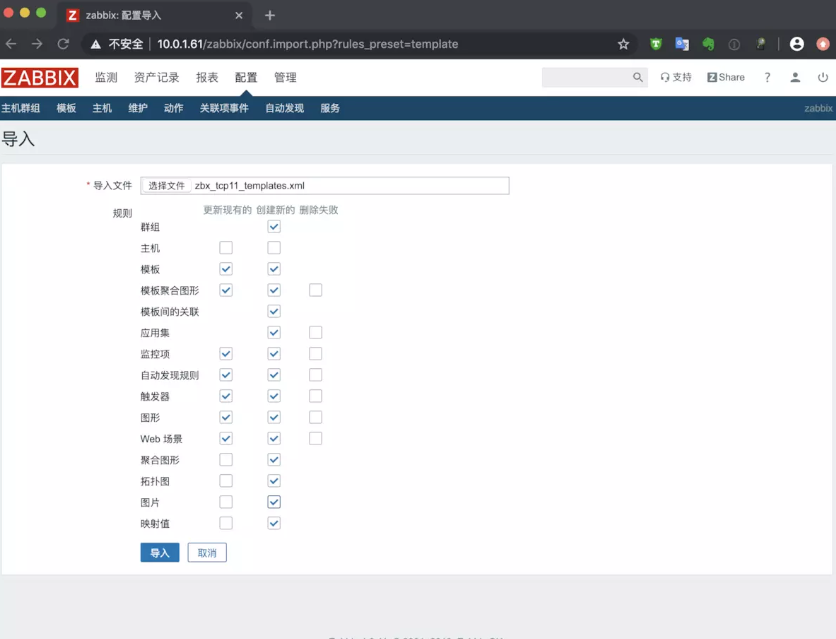
4.导入模版文件
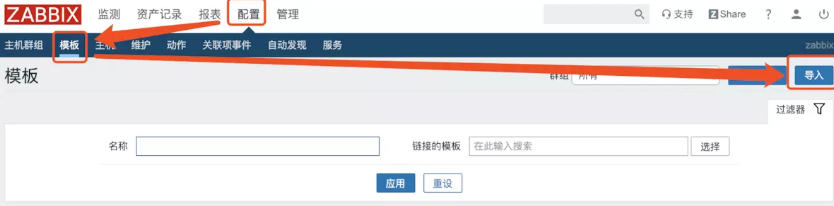
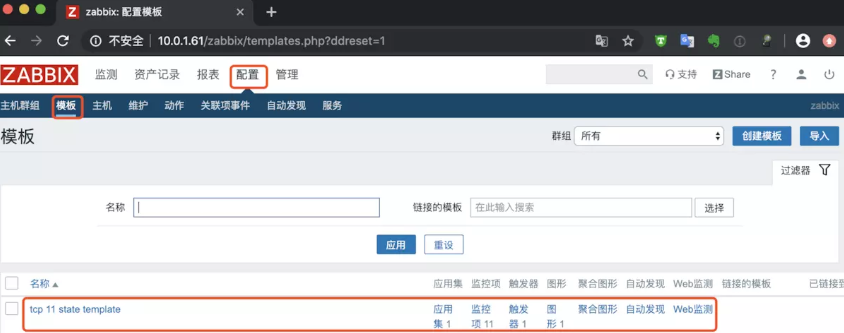
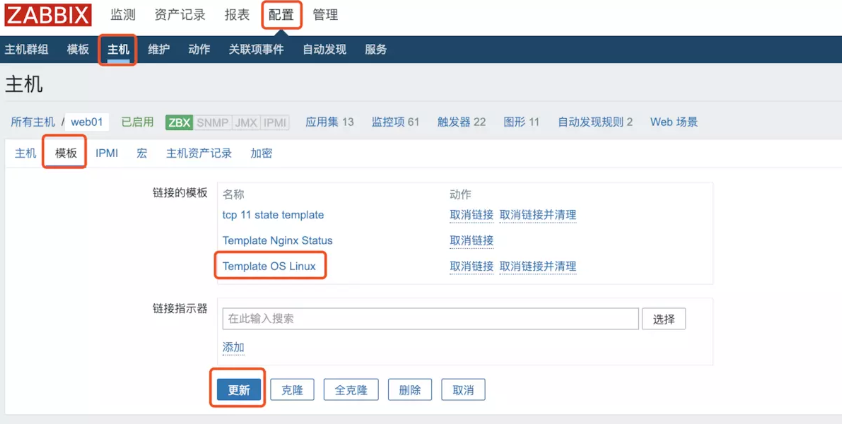
5.主机关联模版文件


6.查看最新数据
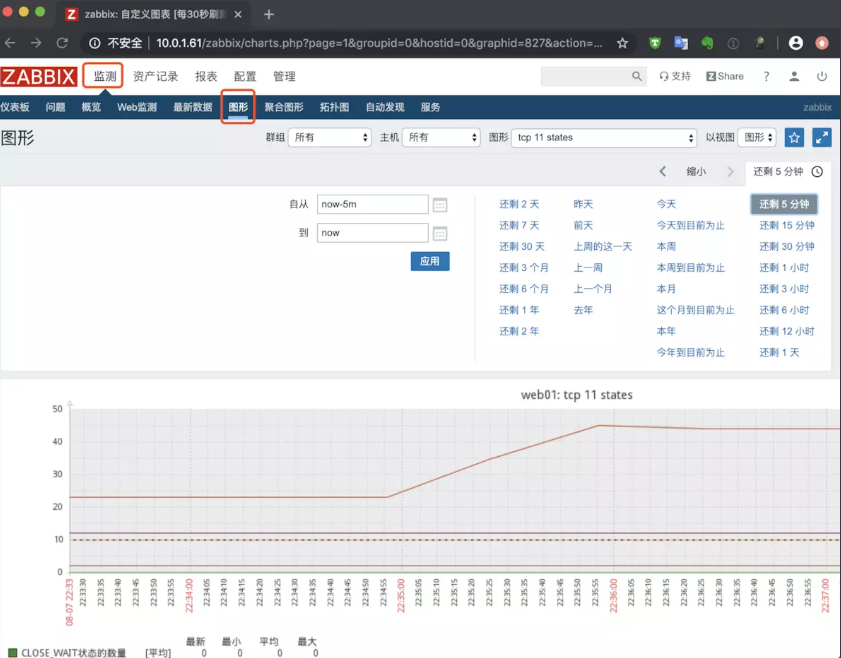
7.查看图形
二、自定义模版监控nginx状态
1.开启监控页面并访问测试
[root@web01 ~]# cat /etc/nginx/conf.d/status.conf

server {

   listen 80;

   server_name localhost;

   location /nginx_status {

       stub_status on;

       access_log off;

   }

}

[root@web01 ~]# curl 127.0.0.1/nginx_status/

Active connections: 1

server accepts handled requests

 6 6 6

Reading: 0 Writing: 1 Waiting: 0
2.准备nginx监控状态脚本
[root@web01 /etc/zabbix/zabbix_agentd.d]# cat nginx_monitor.sh

#!/bin/bash

NGINX_COMMAND=$1

CACHEFILE="/tmp/nginx_status.txt"

CMD="/usr/bin/curl http://127.0.0.1/nginx_status/"

if [ ! -f $CACHEFILE  ];then

   $CMD >$CACHEFILE 2>/dev/null

fi

# Check and run the script

TIMEFLM=`stat -c %Y $CACHEFILE`

TIMENOW=`date +%s`

if [ `expr $TIMENOW - $TIMEFLM` -gt 60 ]; then

    rm -f $CACHEFILE

fi

if [ ! -f $CACHEFILE  ];then

   $CMD >$CACHEFILE 2>/dev/null

fi

nginx_active(){

         grep 'Active' $CACHEFILE| awk '{print $NF}'

         exit 0;

}

nginx_reading(){

         grep 'Reading' $CACHEFILE| awk '{print $2}'

         exit 0;

}

nginx_writing(){

         grep 'Writing' $CACHEFILE | awk '{print $4}'

         exit 0;

}

nginx_waiting(){

         grep 'Waiting' $CACHEFILE| awk '{print $6}'

         exit 0;

}

nginx_accepts(){

         awk NR==3 $CACHEFILE| awk '{print $1}'

         exit 0;

}

nginx_handled(){

         awk NR==3 $CACHEFILE| awk '{print $2}'

         exit 0;

}

nginx_requests(){

         awk NR==3 $CACHEFILE| awk '{print $3}'

         exit 0;

}

case $NGINX_COMMAND in

    active)

        nginx_active;

        ;;

    reading)

        nginx_reading;

        ;;

    writing)

        nginx_writing;

        ;;

    waiting)

        nginx_waiting;

        ;;

    accepts)

        nginx_accepts;

        ;;

    handled)

        nginx_handled;

        ;;

    requests)

        nginx_requests;

        ;;

    *)

echo 'Invalid credentials';

exit 2;

esac
3.编写zabbix监控配置文件
[root@web01 ~]# cat /etc/zabbix/zabbix_agentd.d/nginx_status.conf

UserParameter=nginx_status[*],/bin/bash /etc/zabbix/zabbix_agentd.d/nginx_monitor.sh $1

[root@web01 ~]# systemctl restart zabbix-agent.service
4.使用zabbix_get取值
[root@m01 ~]# zabbix_get -s 10.0.1.7 -k nginx_status[accepts]

7
5.导入模版

6.链接模版
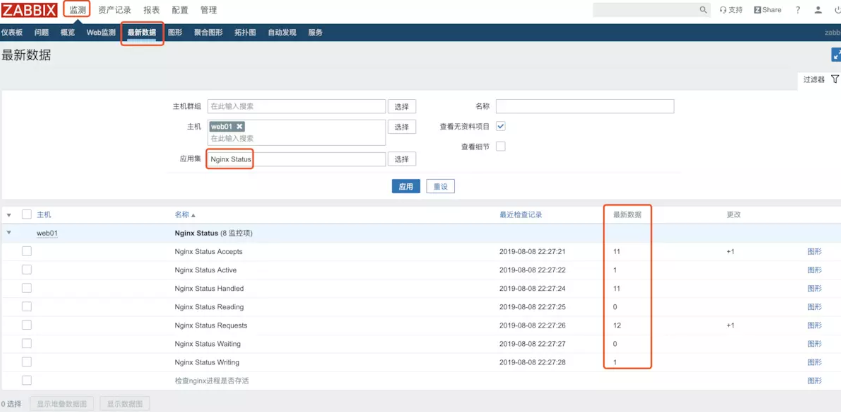
7.查看数据
三、自定义模版监控php状态
1.开启监控页面
[root@web01 ~]# tail -1 /etc/php-fpm.d/www.conf

pm.status_path = /php_status

[root@web01 ~]# cat /etc/nginx/conf.d/status.conf

server {

   listen 80;

   server_name localhost;

   location /nginx_status {

       stub_status on;

       access_log off;

   }

   location /php_status {

       fastcgi_pass 127.0.0.1:9000;

       fastcgi_index index.php;

       fastcgi_param SCRIPT_FILENAME html$fastcgi_script_name;

       include fastcgi_params;

   }

}

[root@web01 ~]# nginx -t

nginx: the configuration file /etc/nginx/nginx.conf syntax is ok

nginx: configuration file /etc/nginx/nginx.conf test is successful

[root@web01 ~]# systemctl restart nginx.service php-fpm.service
2.访问测试
[root@web01 ~]# curl 127.0.0.1/php_status

pool:                 www

process manager:      dynamic

start time:           08/Aug/2019:22:31:27 +0800

start since:          37

accepted conn:        1

listen queue:         0

max listen queue:     0

listen queue len:     128

idle processes:       4

active processes:     1

total processes:      5

max active processes: 1

max children reached: 0

slow requests:        0
3.准备访问脚本
[root@web01 ~]# cat /etc/zabbix/zabbix_agentd.d/fpm.sh

#!/bin/bash

##################################

# Zabbix monitoring script

#

# php-fpm:

#  - anything available via FPM status page

#

##################################

# Contact:

#  vincent.viallet@gmail.com

##################################

# ChangeLog:

#  20100922     VV      initial creation

##################################

# Zabbix requested parameter

ZBX_REQ_DATA="$1"

ZBX_REQ_DATA_URL="$2"

# Nginx defaults

NGINX_STATUS_DEFAULT_URL="http://localhost/fpm/status"

WGET_BIN="/usr/bin/wget"

#

# Error handling:

#  - need to be displayable in Zabbix (avoid NOT_SUPPORTED)

#  - items need to be of type "float" (allow negative + float)

#

ERROR_NO_ACCESS_FILE="-0.91"

ERROR_NO_ACCESS="-0.92"

ERROR_WRONG_PARAM="-0.93"

ERROR_DATA="-0.94" # either can not connect /   bad host / bad port

# Handle host and port if non-default

if [ ! -z "$ZBX_REQ_DATA_URL" ]; then

  URL="$ZBX_REQ_DATA_URL"

else

  URL="$NGINX_STATUS_DEFAULT_URL"

fi

# save the nginx stats in a variable for future parsing

NGINX_STATS=$($WGET_BIN -q $URL -O - 2>/dev/null)

# error during retrieve

if [ $? -ne 0 -o -z "$NGINX_STATS" ]; then

  echo $ERROR_DATA

  exit 1

fi

#

# Extract data from nginx stats

#

#RESULT=$(echo "$NGINX_STATS" | awk 'print $0;match($0, "^'"$ZBX_REQ_DATA"':[[:space:]]+(.*)", a) { print a[1] }')

#RESULT=$(echo "$NGINX_STATS" | grep "$ZBX_REQ_DATA" | awk -F : '{print $2}')

RESULT=$(echo "$NGINX_STATS" | awk -F : "{if(\$1==\"$ZBX_REQ_DATA\") print \$2}")

if [ $? -ne 0 -o -z "$RESULT" ]; then

    echo $ERROR_WRONG_PARAM

    exit 1

fi

echo $RESULT

exit 0

[root@web01 ~]# bash /etc/zabbix/zabbix_agentd.d/fpm.sh "total processes" http://127.0.0.1/php_status

5
4.准备zabbix配置文件
[root@web01 ~]# cat /etc/zabbix/zabbix_agentd.d/fpm.conf

UserParameter=php-fpm[*],/etc/zabbix/zabbix_agentd.d/fpm.sh "$1" "$2"

[root@web01 ~]# systemctl restart zabbix-agent.service
4.使用zabbix_get取值
[root@m01 ~]# zabbix_get -s 10.0.1.7 -k php-fpm["total processes",http://127.0.0.1/php_status]

5
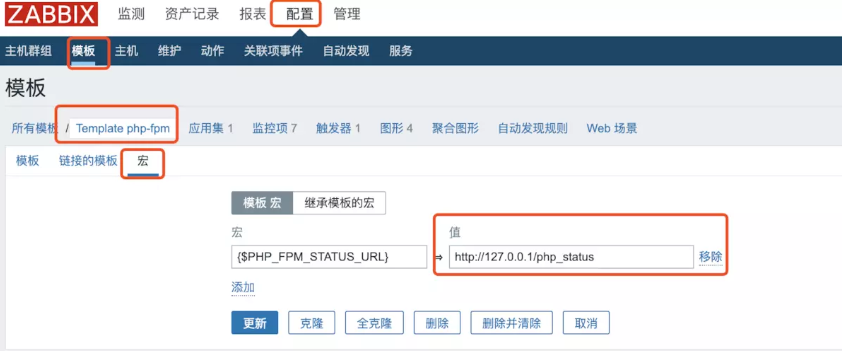
5.导入模版
导入之后需要修改一下模版里的宏配置
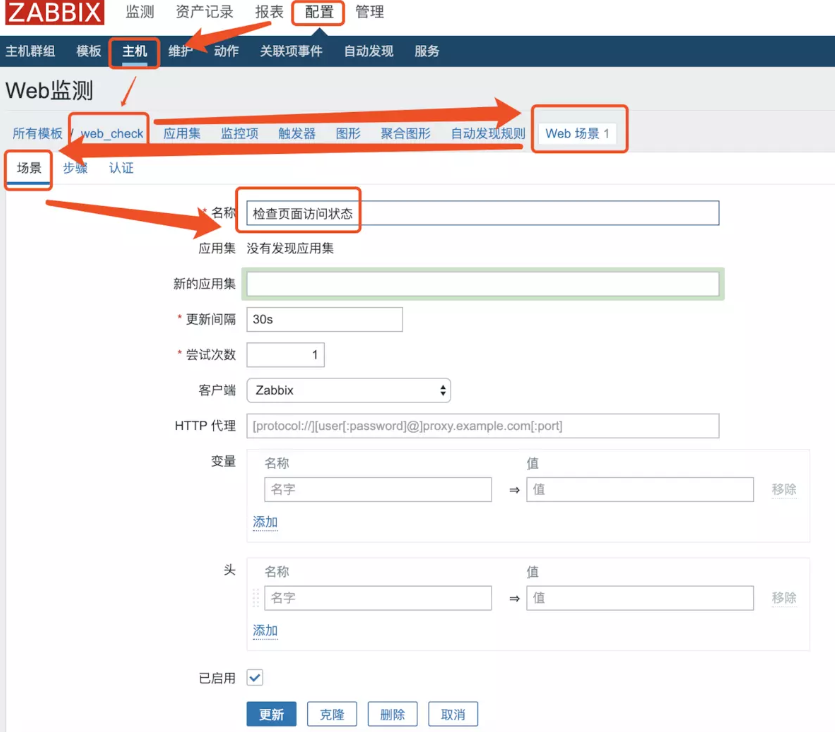
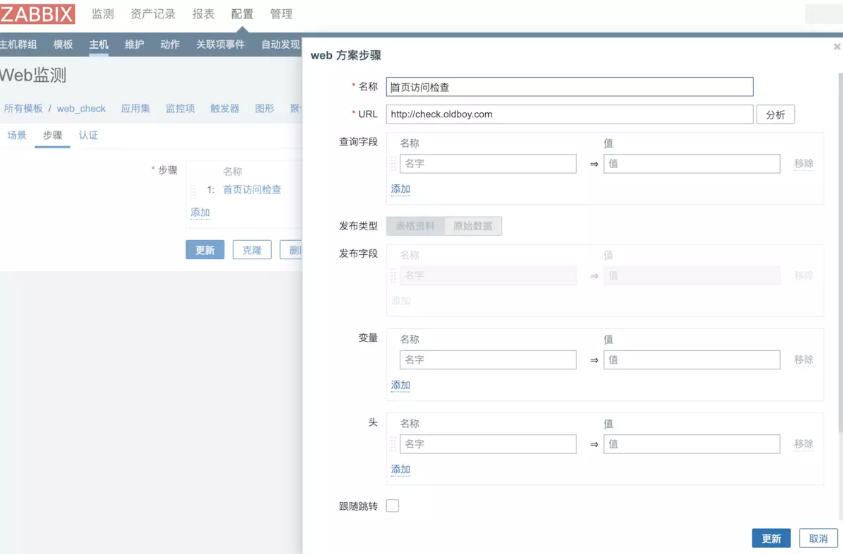
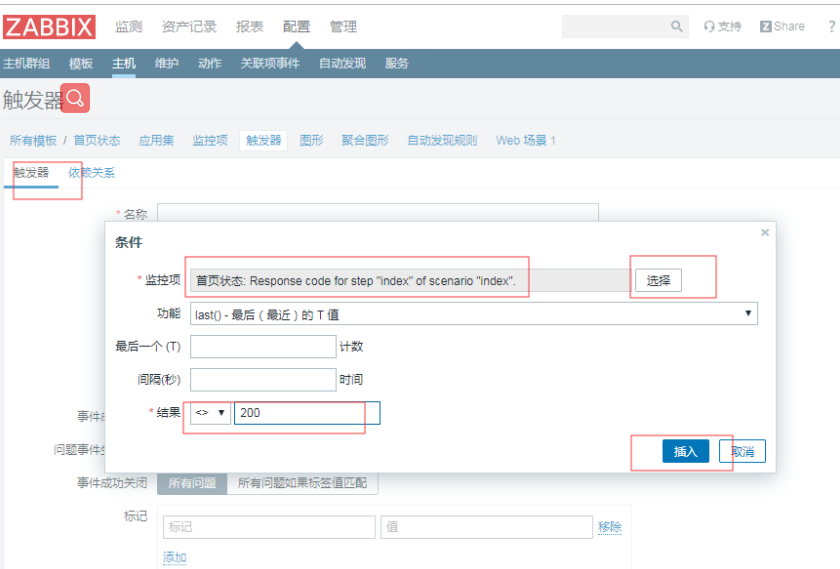
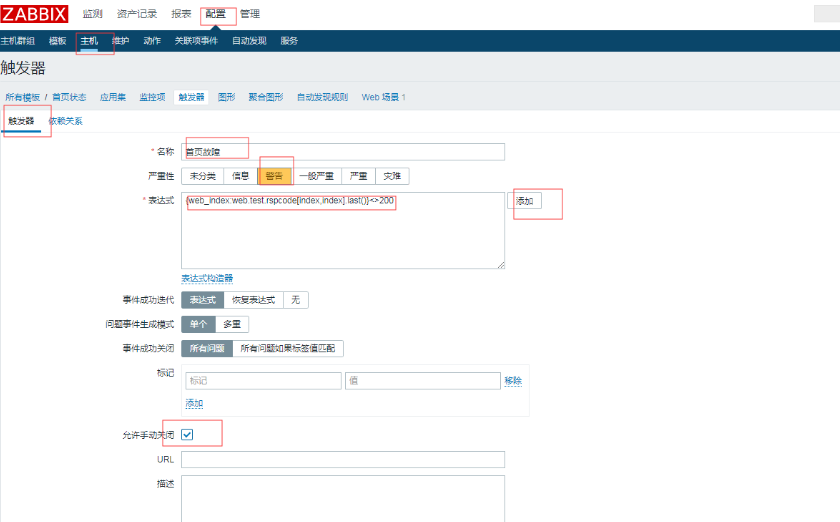
四、WEB监控
需求,监控页面状态码
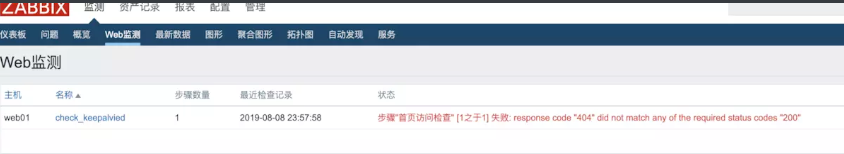
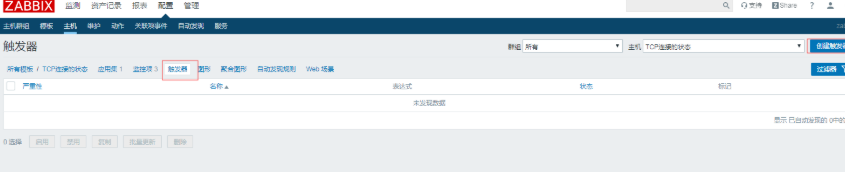
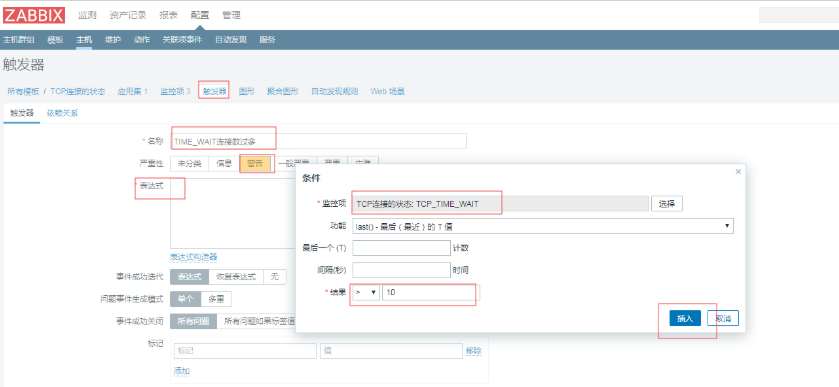
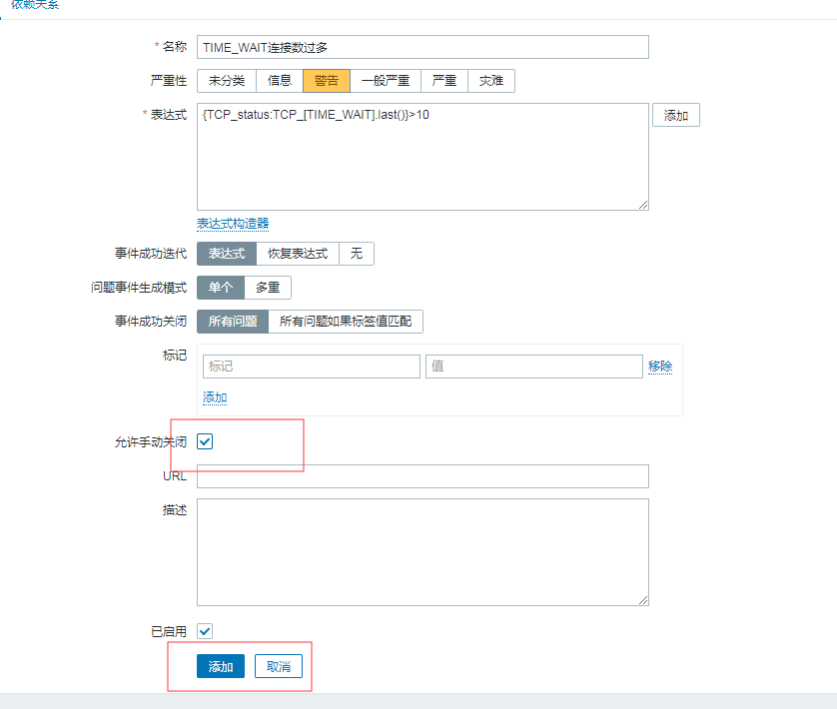
创建触发器
停掉服务时

启动服务

五、故障记录总结
故障1
故障现象:
提示zabbix-server is not running

报错日志:
 34983:20190807:202215.171 database is down: reconnecting in 10 seconds

 34983:20190807:202225.172 [Z3001] connection to database 'zabbix' failed: [1045] Access denied for user 'zabbix'@'localhost' (using password: NO)
故障原因:
zabbix-server的配置文件里配有配置数据库密码
故障解决:
添加正确的数据库账号密码信息
[root@m01 ~]# grep "^DB" /etc/zabbix/zabbix_server.conf

DBHost=localhost

DBName=zabbix

DBUser=zabbix

DBPassword=zabbix
故障2
故障现象:微信报警失败
报错日志:
[root@m01 ~]# tail -f /var/log/zabbix/zabbix_server.log

Problem name: TIME_WAIT过多

Host: web01

Severity: Average

Original problem ID: 51

'": Traceback (most recent call last):

  File "/usr/lib/zabbix/alertscripts/weixin.py", line 7, in <module>

    import requests

ImportError: No module named requests
问题原因:
缺少模块 requests
问题解决:
安装缺失的依赖包
[root@m01 ~]# yum install python-pip

[root@m01 ~]# pip install --upgrade pip

[root@m01 ~]# pip install requests
故障3
故障现象:
在server端使用zabbix_get命令测试键值命令时提示警告
[root@m01 ~]# zabbix_get -s 10.0.1.7 -k ESTABLISHED

(Not all processes could be identified, non-owned process info

 will not be shown, you would have to be root to see it all.)

2
问题原因:
zabbix_agent是以普通用户zabbix运行的,而普通用户执行netstat -antp时会有警告,网上查找发现只要不是用p参数就可以以普通用户运行
解决方案:
监控脚本里的命令修改为netstat -ant
Zabbix--04 自定义模版、web监控的更多相关文章
- 分布式系统监视zabbix讲解五之web监控--技术流ken
Web 监控 概况 你可以使用 Zabbix 检查几个网站可用性方面. 如果要使用 Web 检测功能,必须在 编译Zabbix 的时候加入 cURL(libcurl) 的支持. 要使用 Web 监控, ...
- 分布式系统监视zabbix讲解五之web监控
Web 监控 概况 你可以使用 Zabbix 检查几个网站可用性方面. 如果要使用 Web 检测功能,必须在 编译Zabbix 的时候加入 cURL(libcurl) 的支持. 要使用 Web 监控, ...
- zabbix使用自定义key进行监控
我的zabbix-server是安装在另一台虚拟机上的,用来监控下图中的这台虚拟机 先修改zabbix的客户端配置文件,增加UserParameter那行,这里我只是用来测试,所以就随便起了一个名为p ...
- (39)zabbix snmp自定义OID nginx监控实例
为什么要自定义OID? 前面的文章已经讲过zabbix如何使用snmp监控服务器,但是他有一个很明显的局限性:只能监控定义好的OID项目 假如我们想知道nginx进程是否在运行?在没有zabbix a ...
- zabbix之 自定义内存使用率监控报警
配置zabbix当内存剩余不足15%的时候触发报警 zabbix默认的剩余内存报警:Average Lack of available memory on server {HOST.NAME}{T ...
- Zabbix 添加 WEB 监控
添加 WEB Monitorings Web Monitoring是用来监控web程序的,可以监控到web程序的下载速度.返回码及响应时间,还支持把一组连续的web动作作为一个整体来监控. 下面我们以 ...
- Zabbix设置自定义监控
[zabbix]自定义监控项key值 说明: zabbix自带的默认模版里包括了很多监控项,有时候为了满足业务需求,需要根据自己的监控项目自定义监控项,这里介绍一种自定义监控项的方式. 1,首先编 ...
- 【转载】【zabbix】自定义监控项key值
[转载]https://www.cnblogs.com/zhenglisai/p/6547402.html [zabbix]自定义监控项key值 说明: zabbix自带的默认模版里包括了很多监控 ...
- 19 Zabbix web监控实例
点击返回:自学Zabbix之路 点击返回:自学Zabbix4.0之路 点击返回:自学zabbix集锦 9 Zabbix web监控实例 通过前面的介绍你已经了解Web scenario的配置,下面我们 ...
随机推荐
- [CSP-S模拟测试]:新的世界(BFS)
题目背景 小学五六年级的乔猫是一个喜欢不务正业写游戏的孩纸$......$他曾经模仿著名的沙盒游戏<$Minecraft$>做过一个自己的游戏$"NEWorld"$.这 ...
- enum简单使用
前台传入weightCode :1/2/3/4,获取不同的区间0~10 10~50 50~100 100~999999 0~999999 public void setWeight(){ this.m ...
- vue树形菜单
vue树形菜单 由于项目原因,没有使用ui框架上的树形菜单,所以自己动手并参考大佬的代码写了一个树形菜单的组件,话不多说,直接上代码.html代码js代码直接调用api 把请求到的数据直接赋值给per ...
- 关于spring data jpa的@query的传入参数是对象怎么匹配参数
/** * Specifies methods used to obtain and modify person related information * which is stored in th ...
- Java synchronized到底锁住的是什么?
使用环境:多线程java程序中. 作用:在多线程的环境下,控制synchronized代码段不被多个线程同时执行.synchronized既可以加在一段代码上,也可以加在方法上. 使用:synchro ...
- PADS LAYOUT的一般流程
1.概述 本文档的目的在于说明使用PADS的印制板设计软件PowerPCB进行印制板设计的流程和一些注意事项,为一个工作组的设计人员提供设计规 范,方便设计人员之间进行交流和相互检查. 2.设计 ...
- 如何使用Jetbrains Clion 在一个工程里 编译单个C++源文件 (实现一键编译且运行)
这篇文章主要在下面这篇文章的基础上,先是实现了一键编译和一键运行两个单个功能,最后又进一步使用Clion自带的Custom Build Application实现编译且运行一键实现. https:// ...
- case when then else end 累加
表结构 id(pk) satisfy(满意,一般,不满意) 一条语句查询 总数 各satisfy总数 SELECT count(*) AS 总数, count( CASE satisfy WHEN ' ...
- WebMvcConfigurer 与 WebMvcConfigurationSupport避坑指南
我们知道,在Spring Boot 2.0后用自己的的配置类继承WebMvcConfigurerAdapter时,idea会提示这个类已经过时了. 通常情况下我们会采用下面两种代替方案: 实现WebM ...
- Intellij IDEA 常见问题
右击项目时,没有 Java Class,只能创建其他文件 IDEA 还没有将这个项目识别为 Maven 项目时,会出现这种情况.此时右键无法创建类. 解决办法: 手动为 IDEA 指定项目类型:如果编 ...