
使用shell脚本分析Nagios的status.dat文件
前言
Nagios的安装和配置以及批量添加监控服务器在我前面的文章中已经讲的很详细了。
我们知道,Nagios的网页控制页面(一般为http://nagio.domain.com/nagios)里可以显示监控的服务器、手动检测监控的服务、禁用报警通知等。当我们维护的时候一般都要先停掉报警,最简单的方式就是在网页里设置报警忽略。如下图所示,如监控memory后面紧跟的银色方框就代表disable notification for this service.

但是在维护完成之后很可能就忘记重新开启服务,会造成如下图所示情况,以至于真正出问题后报警没有发出。
status.dat文件结构
那么今天写的文章就是解决这个问题。方法是分析Nagios的status.dat文件。此文件位于/usr/local/nagios/var/status.dat,如果你的nagios是安装在/usr/local目录下的话。
我们来看看此文件的结构,使用vim打开后大致如下:
info {

        created=

        version=3.4.

        last_update_check=

        update_available=

        last_version=

        new_version=

        }

programstatus {

        modified_host_attributes=

        modified_service_attributes=

        ......太多了省略

        }

hoststatus {

        host_name=csmu008

        modified_attributes=

        check_command=check-host-alive

        check_period=24x7

        notification_period=24x7

        ......太多了省略

        notifications_enabled=

        ......

        }

hoststatus {

        host_name=csmu009

        modified_attributes=

        check_command=check-host-alive

        check_period=24x7

        notification_period=24x7

        ......太多了省略

        notifications_enabled=

        ......

        }

servicestatus {

        host_name=csmu008

        service_description=TRAFFIC

        modified_attributes=

        check_command=check_traffic!!!60M

        check_period=24x7

        notification_period=24x7

        .....太多了省略

        notifications_enabled=

        .....

        }

servicestatus {

        host_name=csmu009

        service_description=TRAFFIC

        modified_attributes=

        check_command=check_traffic!!!60M

        check_period=24x7

        notification_period=24x7

        .....太多了省略

        notifications_enabled=

        .....

        }

contactstatus {

        contact_name=lenwood

        modified_attributes=

        modified_host_attributes=

        modified_service_attributes=

        host_notification_period=24x7

        service_notification_period=24x7

        last_host_notification=

        last_service_notification=

        host_notifications_enabled=

        service_notifications_enabled=

        }
大致分析下此文件的结构,通过上面贴出的部分内容,分为info、programstatus、hoststatus、servicestatus、contactstatus这几个模块,每个模块中是一些选项。仔细观察可以发现有主机名、监控命令、监控周期、通知是否禁用等选项。
这个文件是Nagios的server端进程不断更新的,所以我们可以通过分析此文件来知道监控的状态,从而得知哪些监控选项被禁用了。
通过shell脚本分析
Nagios生成的status.dat文件内容是多行,而且这种格式不利于awk等命令的分析,故我先将此文件转换成一行,然后再按照hoststatus和serverstatus分行。这是什么意思呢,先看脚本(exportlog.sh)。
#/bin/bash
#/infra/crontab/exportlog.sh

#written by Lenwood

#mail: ccyhaoran@live.cn

(/bin/cat /usr/local/nagios/var/status.dat|grep -v "#"|awk '{printf("%s",$1)}'|awk -F"servicestatus|hoststatus" '{i=2;while(i<=NF){print $i;i++}}'>/infra/other/nagios.log)
先将整个的文件转化成为一行,然后根据关键字截断分行,并写入到/infra/other/nagios.log中。
在最开始我截图的这个Nagios中监控的服务器有200台,监控项目有1000项左右,生成的satatus.dat文件有1.1M,不是很大,所以用脚本分析能够在很短的时间内完成。
执行结果大致如下
 host_name=csmu008modified_attributes=0check_command=check-host-alivecheck_period=24x7notification_period=24x7check_interval=.000000retry_interval=.000000event_handler=has_been_checked=1should_be_scheduled=1check_execution_time=.014check_latency=.086check_type=0current_state=0last_hard_state=0last_event_id=10268current_event_id=10269current_problem_id=0last_problem_id=5141plugin_output=PINGlong_plugin_output=performance_data=rta=.838000ms;300.000000;1000.000000;.000000last_check=1376636225next_check=1376636835check_options=0current_attempt=1max_attempts=2state_type=1last_state_change=1374987423last_hard_state_change=1369900377last_time_up=1376636235last_time_down=1374987113last_time_unreachable=0last_notification=0next_notification=0no_more_notifications=0current_notification_number=0current_notification_id=0notifications_enabled=1problem_has_been_acknowledged=0acknowledgement_type=0active_checks_enabled=1passive_checks_enabled=1event_handler_enabled=1flap_detection_enabled=1failure_prediction_enabled=1process_performance_data=1obsess_over_host=1last_update=1376636455is_flapping=0percent_state_change=.00scheduled_downtime_depth=}

 host_name=csmu009Smodified_attributes=0check_command=check-host-alivecheck_period=24x7notification_period=24x7check_interval=.000000retry_interval=.000000event_handler=has_been_checked=1should_be_scheduled=1check_execution_time=.011check_latency=.213check_type=0current_state=0last_hard_state=0last_event_id=0current_event_id=0current_problem_id=0last_problem_id=0plugin_output=PINGlong_plugin_output=performance_data=rta=.141000ms;300.000000;1000.000000;.000000last_check=1376635935next_check=1376636545check_options=0current_attempt=1max_attempts=2state_type=1last_state_change=1362990601last_hard_state_change=1362990601last_time_up=1376635945last_time_down=0last_time_unreachable=0last_notification=0next_notification=0no_more_notifications=0current_notification_number=0current_notification_id=0notifications_enabled=1problem_has_been_acknowledged=0acknowledgement_type=0active_checks_enabled=1passive_checks_enabled=1event_handler_enabled=1flap_detection_enabled=1failure_prediction_enabled=1process_performance_data=1obsess_over_host=1last_update=1376636455is_flapping=0percent_state_change=.00scheduled_downtime_depth=}

 host_name=csmu010modified_attributes=0check_command=check-host-alivecheck_period=24x7notification_period=24x7check_interval=.000000retry_interval=.000000event_handler=has_been_checked=1should_be_scheduled=1check_execution_time=.013check_latency=.152check_type=0current_state=0last_hard_state=0last_event_id=9904current_event_id=9905current_problem_id=0last_problem_id=4955plugin_output=PINGlong_plugin_output=performance_data=rta=.334000ms;300.000000;1000.000000;.000000last_check=1376635955next_check=1376636565check_options=0current_attempt=1max_attempts=2state_type=1last_state_change=1373591472last_hard_state_change=1368786250last_time_up=1376635965last_time_down=1373591362last_time_unreachable=0last_notification=0next_notification=0no_more_notifications=0current_notification_number=0current_notification_id=0notifications_enabled=1problem_has_been_acknowledged=0acknowledgement_type=0active_checks_enabled=1passive_checks_enabled=1event_handler_enabled=1flap_detection_enabled=1failure_prediction_enabled=1process_performance_data=1obsess_over_host=1last_update=1376636455is_flapping=0percent_state_change=.00scheduled_downtime_depth=}

 host_name=csmu011modified_attributes=0check_command=check-host-alivecheck_period=24x7notification_period=24x7check_interval=.000000retry_interval=.000000event_handler=has_been_checked=1should_be_scheduled=1check_execution_time=.013check_latency=.025check_type=0current_state=0last_hard_state=0last_event_id=0current_event_id=0current_problem_id=0last_problem_id=0plugin_output=PINGlong_plugin_output=performance_data=rta=.406000ms;300.000000;1000.000000;.000000last_check=1376635945next_check=1376636555check_options=0current_attempt=1max_attempts=2state_type=1last_state_change=1358348022last_hard_state_change=1358348022last_time_up=1376635955last_time_down=0last_time_unreachable=0last_notification=0next_notification=0no_more_notifications=0current_notification_number=0current_notification_id=0notifications_enabled=1problem_has_been_acknowledged=0acknowledgement_type=0active_checks_enabled=1passive_checks_enabled=1event_handler_enabled=1flap_detection_enabled=1failure_prediction_enabled=1process_performance_data=1obsess_over_host=1last_update=1376636455is_flapping=0percent_state_change=.00scheduled_downtime_depth=}
看上去很乱,但是其实就是将每个servicestatus里面的内容拿出来了,单独的写成一行,如上的四行就是csmu008、csmu009、csmu010、csmu011的servicesatus。
然后我们再分析nagios.log文件。脚本(filterhosts.sh)如下
#!/bin/bash
#/infra/crontab/filterhosts.sh

#written by Lenwood

#mail:ccyhaoran@live.cn

[ -f /infra/other/nagios.log ] || exit

while read i

do

    a=`echo $i|grep "notifications_enabled=0"|wc -l`

    if [ $a =  ];then

        (echo $i|awk -F"modified_attributes" '{print $1}')

    fi

done < /infra/other/nagios.log
逐行读取nagios.log文件,判断是否有出现notification_enabled=0,有的话说明这个service被禁用报警通知了,这样我们就可以发送邮件提醒自己。
发送邮件脚本(sendhosts.sh)如下
#!/bin/bash

a=`/infra/crontab/filterhosts.sh|wc -l`

if [ "$a" -ne  ];then

    (/infra/crontab/filterhosts.sh|uniq|mail -s "hosts not enable_notification on $HOSTNAME nagios" ccyhaoran@live.cn)

fi
我们将他们写入crontab,每天提醒两次。crontab如下
  -/ * * * root /infra/crontab/exportlog.sh >/dev/null >&

 -/ * * * root /infra/crontab/sendhosts.sh >/dev/null >&
这样就实现了Nagios监控状态的智能提醒,来看看结果吧。

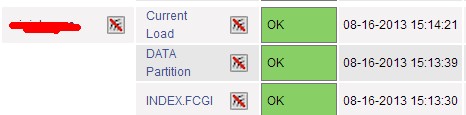
如上所示,csmu008上的对于csmd003和csmd004的load监控的报警被禁用了,赶紧登陆Nagios网页控制页面恢复吧。
使用shell脚本分析Nagios的status.dat文件的更多相关文章
- shell脚本分析nginx日志
shell脚本分析nginx日志: name=`awk -F ',' '{print $13":"$32}' $file | awk -F ':' '{print $4}'`ech ...
- shell脚本分析 nginx日志访问次数最多及最耗时的页面
当服务器压力比较大,跑起来很费力时候.我们经常做站点页面优化,会去查找那些页面访问次数比较多,而且比较费时. 找到那些访问次数高,并且比较耗时的地址,就行相关优化,会取得立竿见影的效果的. 下面是我在 ...
- Shell脚本分析服务器性能
概述 我们原先在服务器上想分析性能指标,需要执行一系列的linux命令.对于linux命令不熟悉的人来说,比较困难 现在有一套集成的shell脚本,把常用的linux命令都包含在里面,一键式分析性能瓶 ...
- Hadoop的shell脚本分析
你会发现hadoop-daemon.sh用于启动单独的本机节点 而hadoop-daemons.sh 会批量的ssh到别的机器启动 前记: 这些天一直学习hadoop,学习中也遇到了许多的问题,主要是 ...
- 一段shell脚本分析
工作中碰到这样的需求: 1.每天定时要执行python脚本生成excel 2.将生成的excel拷贝到特定目录下 3.通过python发送脚本发送给特定的接收者 因为之前没有接触过shell脚本,同事 ...
- 如何用shell脚本分析网站日志统计PV、404、500等数据
以下shell脚本能统计出网站的总访问量,以及404,500出现的次数.统计出来后,可以结合监控宝来进行记录,进而可以看出网站访问量是否异常,是否存在攻击.还可以根据查看500出现的次数,进而判断网站 ...
- shell脚本分析一
Shell 是一个用 C 语言编写的程序,它是用户使用 Linux 的桥梁.Shell 既是一种命令语言,又是一种程序设计语言.Shell 是指一种应用程序,这个应用程序提供了一个界面,用户通过这个界 ...
- Hadoop1.2.1 启停的Shell 脚本分析
停止shell脚本以此类推.
- shell脚本仅列出当前目录下的文件及文件夹
#!/bin/bash function ergodic(){ ` # do # "/"$file ] # then # ergodic $"/"$file # ...
随机推荐
- Python基础-list,tuple,dict,set常用方法及区别
1,列表list 列表定义方式 lis1=[1,2,3,4]#一维数组 lis2=[1,2,3,[4,5,6]]#二维数组 依次多有多维数据,套几层就是几维数组 列表的取值可以通过下标来,下标都是从0 ...
- 【leetcode刷题笔记】Sqrt(x)
Implement int sqrt(int x). Compute and return the square root of x. 题解:二分的方法,从0,1,2.....x搜索sqrt(x)的值 ...
- CMake简易入门
使用CMake编译 CMake工具用于生成Makefile文件.用户通过编写CMakeLists.txt文件,描述构建过程(编译.连接.测试.打包),之后通过解析该文件,生成目标平台的Makefile ...
- Gym - 100851G:Generators(人尽皆知但是WA题)
题意:现在有函数,每一项Xi=(A*X(i-1)+B)%C.现在给定N个函数以及K:X0,A,B,C.然你再每个函数选择一个数,使得其和最大,而且不被K整除. X0,A,B,C<=1e3 :K& ...
- LOJ2722 「NOI2018」情报中心
「NOI2018」情报中心 题目描述 C 国和D 国近年来战火纷飞. 最近,C 国成功地渗透进入了D 国的一个城市.这个城市可以抽象成一张有$n$ 个节点,节点之间由$n - 1$ 条双向的边连接的无 ...
- ACM学习历程—HDU5592 ZYB's Premutation(逆序数 && 树状数组 && 二分)(BestCoder Round #65 1003)
题目链接:http://acm.hdu.edu.cn/showproblem.php?pid=5592 题目大意就是给了每个[1, i]区间逆序对的个数,要求复原原序列. 比赛的时候2B了一发. 首先 ...
- bzoj 4006 管道连接 —— 斯坦纳树+状压DP
题目:https://www.lydsy.com/JudgeOnline/problem.php?id=4006 用斯坦纳树求出所有关键点的各种连通情况的代价,把这个作为状压(压的是集合选择情况)的初 ...
- CCS V5 使用教程一: 安装激活与创建工程
CCS下载与安装 下载地址 Liscense下载地址 安装教程 创建工程 工程创建教程
- linux压缩包安装jdk
1.下载jdk压缩包 $ wget http://download.oracle.com/otn-pub/java/jdk/8u144-b01/090f390dda5b47b9b721c7dfaa00 ...
- mysql- 修改root密码的多种方法
MySQL修改root密码的多种方法 方法1: 用SET PASSWORD命令 mysql -u root mysql> SET PASSWORD FOR 'root'@'localhost' ...