性能测试工具 nGrinder 项目剖析及二次开发
转:https://testerhome.com/topics/4225
0.背景
组内需要一款轻量级的性能测试工具,之前考虑过LR(太笨重,单实例,当然它的地位是不容置疑的),阿里云的PTS(https://pts.aliyun.com/lite/index.htm, 仅支持阿里云内网和公网机器),Gatling(http://gatling.io/#/)没有TPS数据等等,不太适合我们。
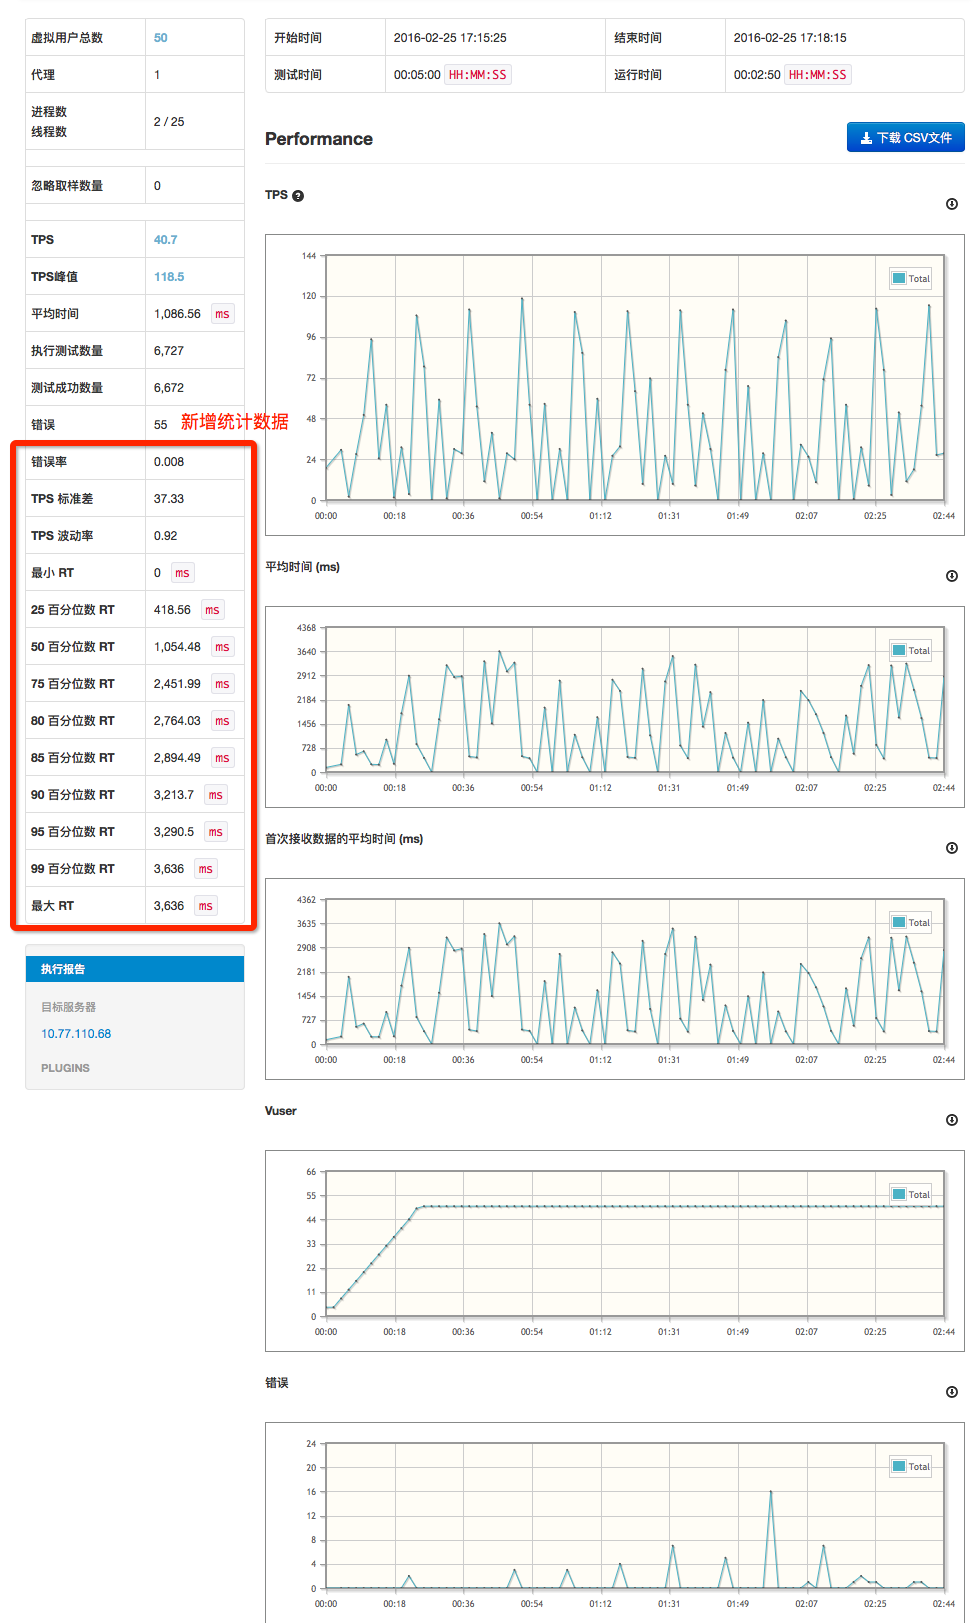
nGrinderr是NAVER(韩国最大互联网公司NHN旗下搜索引擎网站)开源的性能测试工具,直接部署成web服务,支持多用户使用,可扩展性好,可自定义plugin(http://www.cubrid.org/wiki_ngrinder/entry/how-to-develop-plugin),wiki文档较丰富(http://www.cubrid.org/wiki_ngrinder/entry/ngrinder-devzone),数据及图形化展示满足需求;但是展示的统计数据较简单,二次开发整合数据:TPS标准差,TPS波动率,最小/大RT,RT 25/50/75/80/85/90/95/99百分位数字段,并将这些数据展示在详细测试报告页中。
1.项目剖析
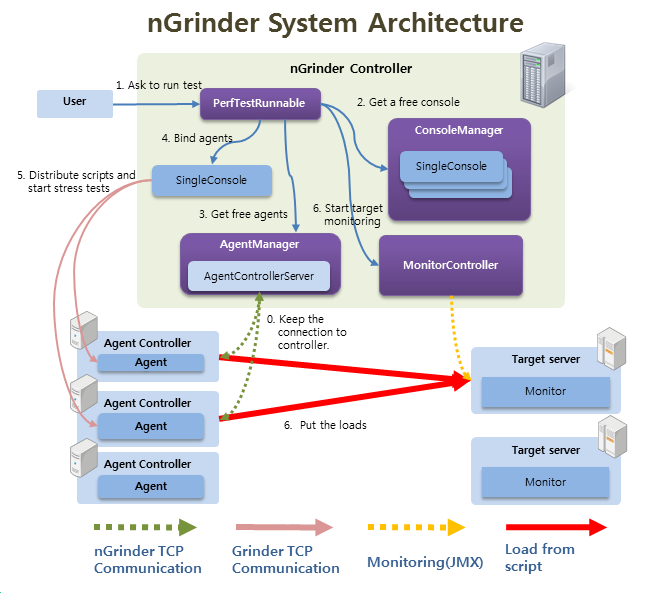
1-1. nGrinder架构
nGrinder是一款在一系列机器上执行Groovy或JPython测试脚本的应用,内部引擎是基于Grinder。
架构图:
层级图:
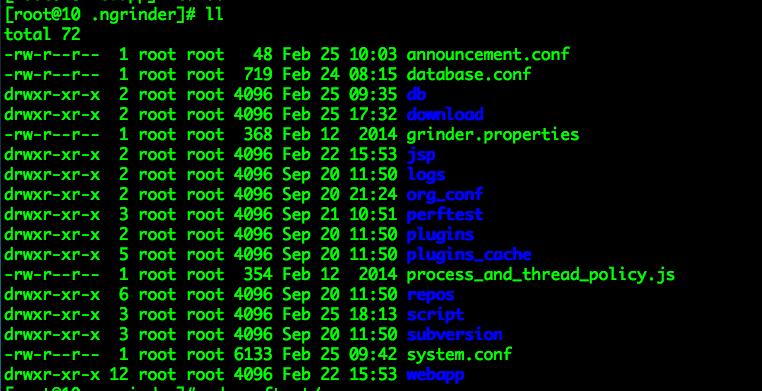
默认的NGRINDER_HOME为/root/.ngrinder, 大多是配置文件和数据文件。
目录/root/.ngrinder/perftest/0_999下,以每个test_id为名的文件夹对应的存储了执行性能测试时的采样数据:
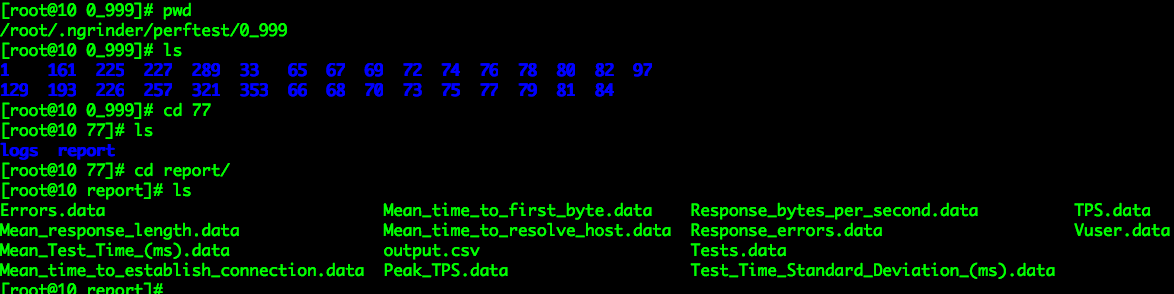
*.data文件就是执行性能测试时对应的各种性能采样数据,性能测试详细报告页就是根据这些data文件,进行图形化展示(ajax)。
nGrinder包含2大组件:
1)Controller
为性能测试提供web interface
协同测试进程
收集和显示测试数据
新建和修改脚本
2)Agent
agent mode: 运行进程和线程,压测目标服务
monitor mode: 监控目标系统性能(cpu/memory), 可以自定义收集的数据(比如 jvm数据)
http://www.cubrid.org/wiki_ngrinder/entry/general-architecture
1-2. 技术栈
1)Controller 层
FreeMarker: 基于Java的模板引擎
Spring Security
Spring Mvc:Spring MVC provides rich functionality for building robust web applications.
GSon
SVNKit Dav
2)Service 层
Grinder
Spring
EhCache: Ehcache has excellent Spring integration.
3)Data层
Spring Data
Hibernate:Hibernate is a powerful technology for persisting data,and it is Spring Data back-end within nGrinder.
H2: (nGrinder默认使用该DB)
Cubrid:(nGrinder同一家公司的DB)
Liquidase: Liquibase is an open source that automates database schema updates.
SVNKit
http://www.cubrid.org/wiki_ngrinder/entry/technology-stack
2.源码实现
需求:在详细测试报告页中展示TPS标准差,TPS波动率,最小/大RT,RT 25/50/75/80/85/90/95/99百分位数这些数据。
修改Controller层,增加数据处理业务逻辑(计算TPS标准差,TPS波动率,最小/大RT,RT 25/50/75/80/85/90/95/99百分位数)
在获取采样数据
ngrinder-core/src/main/java/net/grinder/SingleConsole.java中新增处理业务逻辑,核心修改代码片段:
    // tps list

    List<Double> tps = new CopyOnWriteArrayList<Double>();

    // rt list

    List<Double> meanTestTime = new CopyOnWriteArrayList<Double>();

    /**

     *

     * 每次请求调用一次 Build up statistics for current sampling.

     *

     * @param accumulatedStatistics

     *            intervalStatistics

     * @param intervalStatistics

     *            accumulatedStatistics

     */

    protected void updateStatistics(StatisticsSet intervalStatistics,

            StatisticsSet accumulatedStatistics) {

        Map<String, Object> result = newHashMap();

        result.put("testTime", getCurrentRunningTime() / 1000);

        List<Map<String, Object>> cumulativeStatistics = new ArrayList<Map<String, Object>>();

        List<Map<String, Object>> lastSampleStatistics = new ArrayList<Map<String, Object>>();

        for (Test test : accumulatedStatisticMapPerTest.keySet()) {

            Map<String, Object> accumulatedStatisticMap = newHashMap();

            Map<String, Object> intervalStatisticsMap = newHashMap();

            StatisticsSet accumulatedSet = this.accumulatedStatisticMapPerTest

                    .get(test);

            StatisticsSet intervalSet = this.intervalStatisticMapPerTest

                    .get(test);

            accumulatedStatisticMap.put("testNumber", test.getNumber());

            accumulatedStatisticMap.put("testDescription",

                    test.getDescription());

            intervalStatisticsMap.put("testNumber", test.getNumber());

            intervalStatisticsMap.put("testDescription", test.getDescription());

            // When only 1 test is running, it's better to use the parametrized

            // snapshot.

            for (Entry<String, StatisticExpression> each : getExpressionEntrySet()) {

                if (INTERESTING_STATISTICS.contains(each.getKey())) {

                    accumulatedStatisticMap.put(

                            each.getKey(),

                            getRealDoubleValue(each.getValue().getDoubleValue(

                                    accumulatedSet)));

                    intervalStatisticsMap.put(

                            each.getKey(),

                            getRealDoubleValue(each.getValue().getDoubleValue(

                                    intervalSet)));

                }

            }

            cumulativeStatistics.add(accumulatedStatisticMap);

            lastSampleStatistics.add(intervalStatisticsMap);

        }

        Map<String, Object> totalStatistics = newHashMap();

        for (Entry<String, StatisticExpression> each : getExpressionEntrySet()) {

            if (INTERESTING_STATISTICS.contains(each.getKey())) {

                totalStatistics.put(each.getKey(), getRealDoubleValue(each

                        .getValue().getDoubleValue(accumulatedStatistics)));

            }

        }

        LOGGER.debug("hugang start get plug data");

        // 获取tps, rt集合

        for (Entry<String, StatisticExpression> each : getExpressionEntrySet()) {

            if ("TPS".equals(each.getKey())) {

                tps.add((Double) getRealDoubleValue(each.getValue()

                        .getDoubleValue(intervalStatistics)));

            } else if ("Mean_Test_Time_(ms)".equals(each.getKey())) {

                meanTestTime.add((Double) getRealDoubleValue(each.getValue()

                        .getDoubleValue(intervalStatistics)));

            }

        }

        result.put("totalStatistics", totalStatistics);

        result.put("cumulativeStatistics", cumulativeStatistics);

        result.put("lastSampleStatistics", lastSampleStatistics);

        result.put("tpsChartData", getTpsValues());

        result.put("peakTpsForGraph", this.peakTpsForGraph);

        synchronized (this) {

            result.put(GrinderConstants.P_PROCESS, this.runningProcess);

            result.put(GrinderConstants.P_THREAD, this.runningThread);

            result.put("success", !isAllTestFinished());

        }

        // Finally overwrite.. current one.

        this.statisticData = result;

    }

    /**

     * 从updateStatistics()累加数据, list :rt 和 tps, 为成员变量

     *

     * 再处理集合,放到statisticData中

     *

     * @author hugang

     */

    public void getPlusResult(){

        LOGGER.debug("hugang getPlusResult() tpslist {}  rtlist is {}",

                tps.toString(), meanTestTime.toString());

        int i = 0;

        int j = 0;

        // list转成数组, 标准库使用数组作为参数

        double[] tpsArray = new double[tps.size()];

        for (double tpsNum : tps) {

            tpsArray[i++] = tpsNum;

        }

        // list转成数组

        double[] meanTestTimeArray = new double[meanTestTime.size()];

        for (double meanTime : meanTestTime) {

            meanTestTimeArray[j++] = meanTime;

        }

        // tps 标准差

        double tpsStd = new StandardDeviation().evaluate(tpsArray);

        // tps 平均值

        double tpsMean = new Mean().evaluate(tpsArray, 0, tpsArray.length);

        // tps 波动率= tps 标准差 / tps 平均值

        double tpsVix = 0;

        if(0 != tpsMean){

            tpsVix = tpsStd / tpsMean;

        }

        // meanTestTime 百分位数

        Percentile percentile = new Percentile();

        // 先排序

        Arrays.sort(meanTestTimeArray);

        // meanTestTime最小值

        double minMeanTime = meanTestTimeArray[0];

        double twentyFiveMeanTime = percentile.evaluate(meanTestTimeArray, 25);

        double fiftyMeanTime = percentile.evaluate(meanTestTimeArray, 50);

        double serventyFiveMeanTime = percentile

                .evaluate(meanTestTimeArray, 75);

        double eightyMeanTime = percentile.evaluate(meanTestTimeArray, 80);

        double eightyFiveMeanTime = percentile.evaluate(meanTestTimeArray, 85);

        double ninetyMeanTime = percentile.evaluate(meanTestTimeArray, 90);

        double ninetyFiveMeanTime = percentile.evaluate(meanTestTimeArray, 95);

        double ninetyNineMeanTime = percentile.evaluate(meanTestTimeArray, 99);

        int length = meanTestTimeArray.length;

        // meanTestTime最高值

        double maxMeanTime = meanTestTimeArray[length - 1];

        // meanTestTime平均值

        // double TimeMean = new Mean().evaluate(meanTestTimeArray, 0,

        // meanTestTimeArray.length);

        LOGGER.debug(

                "hugang plug Statistics MinMeanTime {}  MaxMeanTime is {}",

                minMeanTime, maxMeanTime);

        // 附加信息 hugang

        // tps 标准差, tps 波动率, 最小/最大RT, RT百分位数

        Map<String, Object> plusStatistics = newHashMap();

        plusStatistics.put("tpsStd", tpsStd);

//      plusStatistics.put("tpsMean", tpsMean);

        plusStatistics.put("tpsVix", tpsVix);

        plusStatistics.put("minMeanTime", minMeanTime);

        plusStatistics.put("twentyFiveMeanTime", twentyFiveMeanTime);

        plusStatistics.put("fiftyMeanTime", fiftyMeanTime);

        plusStatistics.put("serventyFiveMeanTime", serventyFiveMeanTime);

        plusStatistics.put("eightyMeanTime", eightyMeanTime);

        plusStatistics.put("eightyFiveMeanTime", eightyFiveMeanTime);

        plusStatistics.put("ninetyMeanTime", ninetyMeanTime);

        plusStatistics.put("ninetyFiveMeanTime", ninetyFiveMeanTime);

        plusStatistics.put("ninetyNineMeanTime", ninetyNineMeanTime);

        plusStatistics.put("maxMeanTime", maxMeanTime);

        LOGGER.debug("SingleConsole plug Statistics map plusStatistics {}", plusStatistics);

        this.statisticData.put("plusStatistics", plusStatistics);

    }

    /**

     *

     * 停止采样数据

     * Stop sampling.

     */

    public void unregisterSampling() {

        this.currentNotFinishedProcessCount = 0;

        if (sampleModel != null) {

            this.sampleModel.reset();

            this.sampleModel.stop();

        }

        LOGGER.info("Sampling is stopped");

        informTestSamplingEnd();

        // 结束采样后,处理数据

        // hugang

        getPlusResult();

    }
Map statisticData为不同数据集集合。
Service层从SingleConsole类中获取数据集statisticData:
ngrinder-controller/src/main/java/org/ngrinder/perftest/server/PerfTestService.java 中Map<String, Object> result = consoleManager.getConsoleUsingPort(perfTest.getPort()).getStatisticsData();
/**

     * Update the given {@link PerfTest} properties after test finished.

     *

     * @param perfTest perfTest

     *

     * getConsoleUsingPort()获取数据

     *

     *

     * hugang

     */

    public void updatePerfTestAfterTestFinish(PerfTest perfTest) {

        checkNotNull(perfTest);

        Map<String, Object> result = consoleManager.getConsoleUsingPort(perfTest.getPort()).getStatisticsData();

        @SuppressWarnings("unchecked")

        Map<String, Object> totalStatistics = MapUtils.getMap(result, "totalStatistics", MapUtils.EMPTY_MAP);

        // 获取附加数据

        Map<String, Object> plusStatistics = MapUtils.getMap(result, "plusStatistics", MapUtils.EMPTY_MAP);

        LOGGER.info("Total Statistics for test {}  is {}", perfTest.getId(), totalStatistics);

        LOGGER.info("plug Statistics for test {}  is {}", perfTest.getId(), plusStatistics);

        perfTest.setTps(parseDoubleWithSafety(totalStatistics, "TPS", 0D));

        perfTest.setMeanTestTime(parseDoubleWithSafety(totalStatistics, "Mean_Test_Time_(ms)", 0D));

        perfTest.setPeakTps(parseDoubleWithSafety(totalStatistics, "Peak_TPS", 0D));

        perfTest.setTests(MapUtils.getDouble(totalStatistics, "Tests", 0D).longValue());

        perfTest.setErrors(MapUtils.getDouble(totalStatistics, "Errors", 0D).longValue());

        // 附加信息写到model, 持久化

        perfTest.setTpsStd(parseDoubleWithSafety(plusStatistics, "tpsStd", 0D));

        perfTest.setTpsVix(parseDoubleWithSafety(plusStatistics, "tpsVix", 0D));

        perfTest.setMinRT(parseDoubleWithSafety(plusStatistics, "minMeanTime", 0D));

        perfTest.setTwentyFiveMeanTime(parseDoubleWithSafety(plusStatistics, "twentyFiveMeanTime", 0D));

        perfTest.setFiftyMeanTime(parseDoubleWithSafety(plusStatistics, "fiftyMeanTime", 0D));

        perfTest.setServentyFiveMeanTime(parseDoubleWithSafety(plusStatistics, "serventyFiveMeanTime", 0D));

        perfTest.setEightyMeanTime(parseDoubleWithSafety(plusStatistics, "eightyMeanTime", 0D));

        perfTest.setEightyFiveMeanTime(parseDoubleWithSafety(plusStatistics, "eightyFiveMeanTime", 0D));

        perfTest.setNinetyMeanTime(parseDoubleWithSafety(plusStatistics, "ninetyMeanTime", 0D));

        perfTest.setNinetyFiveMeanTime(parseDoubleWithSafety(plusStatistics, "ninetyFiveMeanTime", 0D));

        perfTest.setNinetyNineMeanTime(parseDoubleWithSafety(plusStatistics, "ninetyNineMeanTime", 0D));

        perfTest.setMaxRT(parseDoubleWithSafety(plusStatistics, "maxMeanTime", 0D));

    }
修改Model层,在javabean中增加TPS标准差,TPS波动率,最小/大RT,RT 25/50/75/80/85/90/95/99百分位数, JPA持久化(H2 DB新增TPS标准差,TPS波动率,最小/大RT,RT 25/50/75/80/85/90/95/99百分位数字段)
model文件为:ngrinder-core/src/main/java/org/ngrinder/model/PerfTest.java
    /**

     * 新增字段,TPS标准差,TPS波动率,最小/大RT,RT 25/50/75/80/85/90/95/99百分位数

     * hugang

     */

    @Expose

    @Column(name = "tpsStd")

    private Double tpsStd;

    @Expose

    @Column(name = "tpsVix")

    private Double tpsVix;

    @Expose

    @Column(name = "minRT")

    private Double minRT;

    @Expose

    @Column(name = "twentyFiveMeanTime")

    private Double twentyFiveMeanTime;

    @Expose

    @Column(name = "fiftyMeanTime")

    private Double fiftyMeanTime;

    @Expose

    @Column(name = "serventyFiveMeanTime")

    private Double serventyFiveMeanTime;

    @Expose

    @Column(name = "eightyMeanTime")

    private Double eightyMeanTime;

    @Expose

    @Column(name = "eightyFiveMeanTime")

    private Double eightyFiveMeanTime;

    @Expose

    @Column(name = "ninetyMeanTime")

    private Double ninetyMeanTime;

    @Expose

    @Column(name = "ninetyFiveMeanTime")

    private Double ninetyFiveMeanTime;

    @Expose

    @Column(name = "ninetyNineMeanTime")

    private Double ninetyNineMeanTime;

    @Expose

    @Column(name = "maxRT")

    private Double maxRT;

    对应的set(), get()
还需修改db change文件(因为系统DB默认使用H2, 只需修改H2对应的xml),ngrinder-controller/src/main/resources/ngrinder_datachange_logfile/db.changelog_schema_H2.xml
create table PERF_TEST (

            id bigint generated by default as identity unique,

            created_date timestamp,

            last_modified_date timestamp,

            agent_count integer,

            description varchar(2048),

            distribution_path varchar(255),

            duration bigint,

            errors integer,

            finish_time timestamp,

            ignore_sample_count integer,

            init_processes integer,

            init_sleep_time integer,

            last_progress_message varchar(2048),

            mean_test_time double,

            peak_tps double,

            errorRate double,

            tpsStd double,

            tpsVix double,

            minRT double,

            twentyFiveMeanTime double,

            fiftyMeanTime double,

            serventyFiveMeanTime double,

            eightyMeanTime double,

            eightyFiveMeanTime double,

            ninetyMeanTime double,

            ninetyFiveMeanTime double,

            ninetyNineMeanTime double,

            maxRT double,
系统重启加载时,Liquidase会自动更新DB。
修改View层,在详细报告对应的freemarker模板新增TPS标准差,TPS波动率,最小/大RT,RT 25/50/75/80/85/90/95/99百分位数字段,前端新增展示这些数据
ngrinder-controller/src/main/webapp/WEB-INF/ftl/perftest/detail_report.ftl
<#-- hugang -->
<#-- 新增 错误率,TPS标准差,TPS波动率,最小RT, 最大RT, RT 25/50/75/80/85/90/95/99百分位数 -->
<tr>
<th><@spring.message "perfTest.report.errorRate"/></th>
<td>${(test.errors /(test.tests + test.errors))!""}</td>
</tr>
<tr>
<th><@spring.message "perfTest.report.tpsStd"/></th>
<td>${test.tpsStd!""}</td>
</tr>
<tr>
<th><@spring.message "perfTest.report.tpsVix"/></th>
<td>${test.tpsVix!""}</td>
</tr>
<tr>
<th><@spring.message "perfTest.report.minRT"/></th>
<td>${test.minRT!""} <code>ms</code></td>
</tr>
<tr>
<th><@spring.message "perfTest.report.TwentyFiveMeanTime"/></th>
<td>${test.twentyFiveMeanTime!""} <code>ms</code></td>
</tr>
<tr>
<th><@spring.message "perfTest.report.FiftyMeanTime"/></th>
<td>${test.fiftyMeanTime!""} <code>ms</code></td>
</tr>
<tr>
<th><@spring.message "perfTest.report.ServentyFiveMeanTime"/></th>
<td>${test.serventyFiveMeanTime!""} <code>ms</code></td>
</tr>
<tr>
<th><@spring.message "perfTest.report.EightyMeanTime"/></th>
<td>${test.eightyMeanTime!""} <code>ms</code></td>
</tr>
</tr>
<tr>
<th><@spring.message "perfTest.report.EightyFiveMeanTime"/></th>
<td>${test.eightyFiveMeanTime!""} <code>ms</code></td>
</tr>
</tr>
<tr>
<th><@spring.message "perfTest.report.NinetyMeanTime"/></th>
<td>${test.ninetyMeanTime!""} <code>ms</code></td>
</tr>
</tr>
<tr>
<th><@spring.message "perfTest.report.NinetyFiveMeanTime"/></th>
<td>${test.ninetyFiveMeanTime!""} <code>ms</code></td>
</tr>
</tr>
<tr>
<th><@spring.message "perfTest.report.NinetyNineMeanTime"/></th>
<td>${test.ninetyNineMeanTime!""} <code>ms</code></td>
</tr>
</tr>
<tr>
<th><@spring.message "perfTest.report.maxRT"/></th>
<td>${test.maxRT!""} <code>ms</code></td>
</tr>还有个坑,就是从github拉下的代码,源码中pom.xml依赖的jar包不完整,直接打不了包,项目有的依赖的jar 公有maven仓库已经没有了,需要自己从网上找jar包,安装到本地仓库,我归整了下:
http://download.csdn.net/detail/neven7/9443895
直接在ngrinder根路径下执行打包命令:
mvn -Dmaven.test.skip=true clean package部署生成的war即可。
3.结果展示
在详细报告页新增如下数据结果:
性能测试工具 nGrinder 项目剖析及二次开发的更多相关文章
- 开源性能测试工具Locust使用篇(二)
那如何理解Locust和TaskSet这两个类呢? class HttpLocust(Locust) 在Locust类中,具有一个client属性,它对应着虚拟用户作为客户端所具备的请求能力,也就是我 ...
- OA项目实战(二) 开发准备
上次的博文OA系统实践(一) 概述中,我们已经了解了OA的相关概念.从本次博文开始,我们做一个简单的OA实例. 在OA开发之前,有几个工作们需要提前做.一个是对需求进行分析,另一个是对开发环境进行选择 ...
- 基于VB语言对SolidWorks参数化设计的二次开发
0 引言 随着数字信息化进程的快速推进,如今三维CAD技术在越来越多的企业当中得到运用.为了降低在设计生产中的成本,缩短设计周期,增强企业竞争力,三维参数化技术随之应声,它凭借更贴近现代概念的设计以及 ...
- 手机游戏渠道SDK接入工具项目分享(二)万事开头难
一般接到任务后程序员们通常都开始着手进行技术调研了,但我这活是项目负责人.还有一大堆事情要先期准备,没人能帮忙. 一.人力配置 考虑的之前已经有一波人搞了大半年,但没有起色,先期也没有太大人力需求,所 ...
- Linux系统性能测试工具(二)——内存压力测试工具memtester
本文介绍关于Linux系统(适用于centos/ubuntu等)的内存压力测试工具-memtester.内存性能测试工具包括: 内存带宽测试工具——mbw: 内存压力测试工具——memtester: ...
- 开源多线程性能测试工具-sysbench
导读 sysbench是一款开源的多线程性能测试工具,可以执行CPU/内存/线程/IO/数据库等方面的性能测试.数据库目前支持MySQL/Oracle/PostgreSQL.本文主要演示Mysql测试 ...
- 【转】开源性能测试工具 - Apache ab 介绍
版权声明:本文可以被转载,但是在未经本人许可前,不得用于任何商业用途或其他以盈利为目的的用途.本人保留对本文的一切权利.如需转载,请在转载是保留此版权声明,并保证本文的完整性.也请转贴者理解创作的辛劳 ...
- 【腾讯开源】Android性能测试工具APT使用指南
[腾讯开源]Android性能测试工具APT使用指南 2014-04-23 09:58 CSDN CODE 作者 CSDN CODE 17 7833 腾讯 apt 安卓 性能测试 开源 我们近日对腾讯 ...
- 性能测试工具Locust的使用
一.写在前面 官网:https://www.locust.io/ 官方使用文档:https://docs.locust.io/en/latest/ 大并发量测试时,建议在linux系统下进行. 二.L ...
随机推荐
- bzoj4556: [Tjoi2016&Heoi2016]字符串 (后缀数组加主席树)
题目是给出一个字符串,每次询问一个区间[a,b]中所有的子串和另一个区间[c,d]的lcp最大值,首先求出后缀数组,对于lcp的最大值肯定是rank[c]的前驱和后继,但是对于这个题会出现问题,就是题 ...
- AtcoderGrandContest 016 D.XOR Replace
$ >AtcoderGrandContest \space 016 D.XOR\space Replace<$ 题目大意 : 有两个长度为 \(n\) 的数组 \(A, B\) ,每次操作 ...
- 【插头DP】BZOJ3125-city
开学忙成狗,刷题慢如蜗牛…… [题目大意] 给出一个m*n的矩阵里面有一些格子为障碍物,一些格子只能上下通行,一些格子只能左右通行,一些格子上下左右都能通行.问经过所有非障碍格子的哈密顿回路个数. [ ...
- 2015 百度之星 1004 KPI STL的妙用
KPI Time Limit: 20 Sec Memory Limit: 256 MB 题目连接 http://acdream.info/problem?pid=1754 Description 你 ...
- nginx+php-fpm 配置和错误总结
<strong>空白页面:</strong>需要这个参数: fastcgi_param SCRIPT_FILENAME $document_root$fastcgi_scrip ...
- PAT甲级1103. Integer Factorization
PAT甲级1103. Integer Factorization 题意: 正整数N的K-P分解是将N写入K个正整数的P次幂的和.你应该写一个程序来找到任何正整数N,K和P的N的K-P分解. 输入规格: ...
- VS2015启动拷贝过来的项目无法启动IIS Express
最近将VS2015开发的项目考给同事,告知无法启动,大概分析了一下原因: 1.查看端口是否占用冲突 2.在解决方案上右键选择,清理解决方案->重建解决方案 3.以上两个方法还不生效的话,在Web ...
- Java容器-引用数据类型排序+TreeSet、TreeMap底层实现
目录 1.冒泡排序的实现 2.比较接口(普通数据类型.引用数据类型) 普通数据类型:冒泡排序 引用数据类型:包装类(Integer.String.Character.Date) 自定义类型:实体类:i ...
- corosync
前提: )本配置共有两个测试节点,分别node1.magedu.com和node2.magedu.com,相的IP地址分别为172.: )集群服务为apache的httpd服务: )提供web服务的地 ...
- 关于GCC Cygwin MinGW MSYS
[转载]关于Gcc/MinGW/Cygwin/Msys http://blog.sciencenet.cn/blog-778757-616920.html 一.GCC的历史 GCC是一个原本用于Uni ...