Seaborn图形可视化库
一、绘图
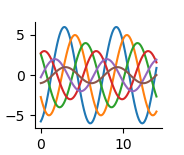
1)快速生成图
import numpy as np

import matplotlib.pyplot as plt

def sinplot(filp=):

    x = np.linspace(,,)

    for i in range(,):

        plt.plot(x,np.sin(x + i * ) * ( - i) * filp)

sinplot()

plt.show()

特别注意: 在ipython中,在导入模块前引用 %matplotlib inline 可替代plt.show()

           在pycharm中不支持 %matplotlib inline 。所有只能 plt.show()  来展示图
sns.set() 默认风格
2)去掉上面,和右边的多余的线。sns.despine()
import seaborn as sns

import numpy as np

import matplotlib.pyplot as plt

def sinplot(filp=):

    x = np.linspace(,,)

    for i in range(,):

        plt.plot(x,np.sin(x + i * ) * ( - i) * filp)

sinplot()

sns.despine()

plt.show()
3)风格的展示。调试的是背景
sns.set_style('whitegrid')

5种主题风格

darkgrid

whitegrid

dark

white

ticks
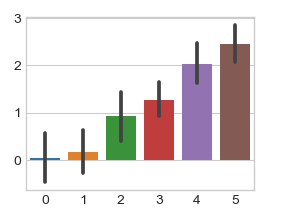
示例一:sns.set_style('whitegrid')
import seaborn as sns

import numpy as np

import matplotlib.pyplot as plt

sns.set_style('whitegrid')

data = np.random.normal(size=(,)) + np.arange() /

sns.barplot(data=data)

plt.show()
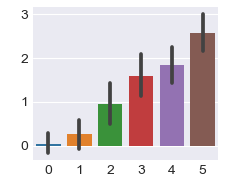
示例二:sns.set_style('darkgrid')
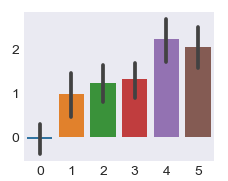
示例三:sns.barplot(data=data)
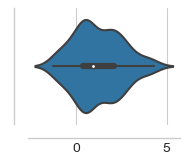
4)可以设置离轴线的距离。sns.despine(offset=10)
import seaborn as sns

import numpy as np

import matplotlib.pyplot as plt

sns.set_style('whitegrid')

data = np.random.normal(size=(,)) + np.arange() /

sns.violinplot(data)

sns.despine(offset=)  # 离轴线的距离

plt.show()
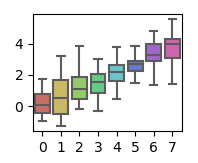
5)隐藏左边的轴线。sns.despine(left=True)
import seaborn as sns

import numpy as np

import matplotlib.pyplot as plt

data = np.random.normal(size=(,)) + np.arange() /

sns.set_style('whitegrid')

sns.boxplot(data=data,palette='deep')

sns.despine(left=True)

plt.show()

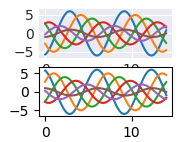
6)指定多种风格。with里面,with外面
import seaborn as sns

import numpy as np

import matplotlib.pyplot as plt

with sns.axes_style("darkgrid"):    # with里面指定一个风格

    plt.subplot()

    sinplot()

plt.subplot()    # 外面指定别的风格

sinplot(-)

plt.show()
7、了解。设置线粗细,坐标文件大小等
import seaborn as sns

import numpy as np

import matplotlib.pyplot as plt

sns.set()

sns.set_context("paper")  # 绘制图的大小 :sns.set_context("talk"),poster,notebook

# sns.set_context("paper",font_scale=1.5,rc={"lines.linewidth":2.5})

#  font_scale=1.5,坐标文字的大小。rc={"lines.linewidth":2.5} 线的粗细

plt.figure(figsize=(,))

sinplot()

plt.show()
二、调色板
1)快速生成调色板
调色板

color_palette() 能传入任何Matplotlib所支持的颜色

color_palette() 不写参数则默认颜色

set_palette() 设置所有图的颜色
示例
import seaborn as sns

import matplotlib.pyplot as plt

sns.set(rc = {"figure.figsize":(,)})

current_palette = sns.color_palette()

sns.palplot(current_palette)

plt.show()

6个默认的颜色循环主题:deep,muted,pastel,bright,dark,colorblind
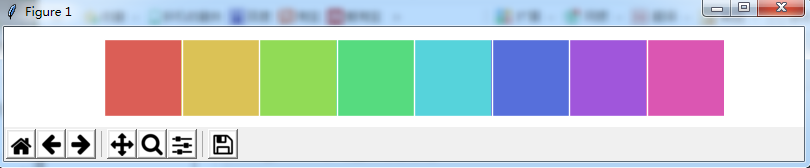
2)当需要更多颜色主题的时候,调用画板。sns.color_palette("hls",8)
import seaborn as sns

import matplotlib.pyplot as plt

sns.set(rc = {"figure.figsize":(,)})

current_palette = sns.color_palette("hls",)

sns.palplot(current_palette)

plt.show()
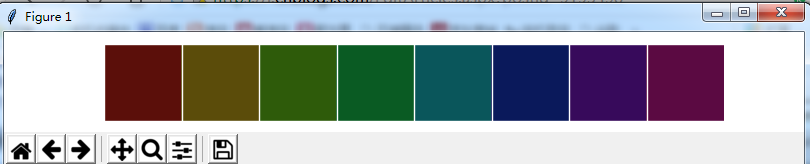
3)设置颜色的饱和度和亮度。sns.hls_palette(8,l=.2,s =.8)
import seaborn as sns

import matplotlib.pyplot as plt

sns.set(rc = {"figure.figsize":(,)})

sns.palplot(sns.hls_palette(,l=.,s =.))  # 注意,前面有小点。饱和度 l=.,亮度 s =.

plt.show()
l ==》亮度 lightness
s ==》饱和 saturation
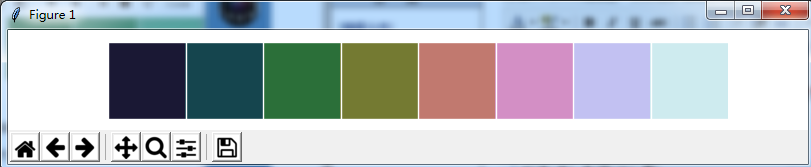
4)相近颜色的对比色。sns.color_palette("Paired",8)
import seaborn as sns

import matplotlib.pyplot as plt

sns.set(rc = {"figure.figsize":(,)})

sns.palplot(sns.color_palette("Paired",))     # 相近颜色的对比色。sns.color_palette("Paired",)

plt.show()

5)将颜色传入绘制的图形中
import numpy as np

import seaborn as sns

import matplotlib.pyplot as plt

data = np.random.normal(size=(,)) + np.arange() /

sns.boxplot(data=data,palette=sns.color_palette("hls",))

plt.show()
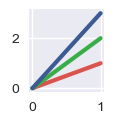
6)使用xkcd颜色来命令颜色
import seaborn as sns

import matplotlib.pyplot as plt

sns.set(rc = {"figure.figsize":(,)})

plt.plot([,],[,], sns.xkcd_rgb["pale red"], lw=)

plt.plot([,],[,], sns.xkcd_rgb["medium green"], lw=)

plt.plot([,],[,], sns.xkcd_rgb["denim blue"], lw=)

plt.show()

plt.close()
xkcd包含了一套众包努力的针对随机RGB色的命名。产生了954个可以随时通过xkcd_rgb字典中的命令颜色
7)列表传值绘制多种颜色
import seaborn as sns

import matplotlib.pyplot as plt

sns.set(rc = {"figure.figsize":(,)})

colors = ["windows blue",'amber',"greyish","faded green","dusty purple"]

sns.palplot(sns.xkcd_palette(colors))

plt.show()

plt.close()

8)连续渐变色画板。sns.palplot(sns.color_palette("Blues"))
import seaborn as sns

import matplotlib.pyplot as plt

sns.set(rc = {"figure.figsize":(,)})

sns.palplot(sns.color_palette("Blues"))

plt.show()

plt.close()
默认由浅变深。如果需要翻转渐变色Blues_r 即可

9)cubehelix_palette()调色板。色调线性变换。sns.color_palette("cubehelix",8)
import seaborn as sns

import matplotlib.pyplot as plt

sns.set(rc = {"figure.figsize":(,)})

sns.palplot(sns.color_palette("cubehelix",))

plt.show()

plt.close()
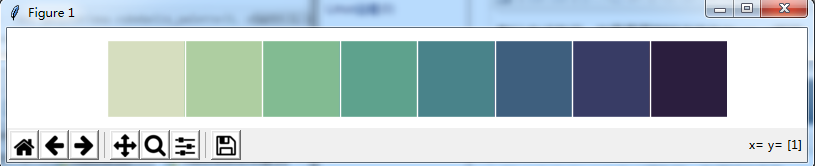
10)在这个区间颜色的变化。sns.cubehelix_palette(8,start=.5,rot=-.75)
import seaborn as sns

import matplotlib.pyplot as plt

sns.set(rc = {"figure.figsize":(,)})

sns.palplot(sns.cubehelix_palette(,start=.,rot=-.))     # 在这个区间颜色的变化

plt.show()

plt.close()
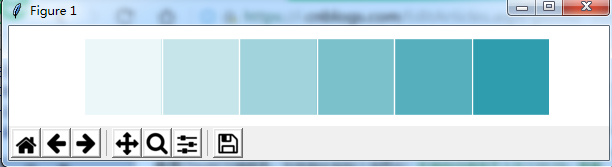
11)定制连续的调色板
示例:sns.light_palette("green")
import seaborn as sns

import matplotlib.pyplot as plt

sns.set(rc = {"figure.figsize":(,)})

sns.palplot(sns.light_palette("green"))     # 定制连续的调色板

plt.show()

plt.close()

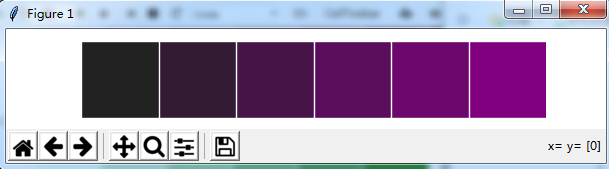
示例:sns.dark_palette("purple")
示例: sns.light_palette("navy",reverse=True)

示例:渐变色的另一种方法。sns.light_palette((210,90,60),input="husl")
import seaborn as sns

import matplotlib.pyplot as plt

sns.set(rc = {"figure.figsize":(,)})

sns.palplot(sns.light_palette((,,),input="husl"))     # 定制连续的调色板

plt.show()

plt.close()
12)利用渐变色绘制海拔
import numpy as np

import seaborn as sns

import matplotlib.pyplot as plt

sns.set(rc = {"figure.figsize":(,)})

x,y = np.random.multivariate_normal([,],[[,-.],[-.,]],size=).T

print(x)

print(y)

pal = sns.dark_palette("green",as_cmap=True)

sns.kdeplot(x,y,cmap=pal)

plt.show()

plt.close()

Seaborn图形可视化库的更多相关文章
- E-Form++图形可视化源码库新增同BCGSoft的Ribbon结合示例
2015年11月20日,来自UCanCode E-Form++源码库的开发团队消息,E-Form++正式提供了同BCGSoft的Ribbon界面风格相结合的示例,如下图: 下载此示例请访问: http ...
- Pycon 2017: Python可视化库大全
本文首发于微信公众号“Python数据之道” 前言 本文主要摘录自 pycon 2017大会的一个演讲,同时结合自己的一些理解. pycon 2017的相关演讲主题是“The Python Visua ...
- Python可视化库
转自小小蒲公英原文用Python可视化库 现如今大数据已人尽皆知,但在这个信息大爆炸的时代里,空有海量数据是无实际使用价值,更不要说帮助管理者进行业务决策.那么数据有什么价值呢?用什么样的手段才能把数 ...
- Seaborn数据可视化入门
在本节学习中,我们使用Seaborn作为数据可视化的入门工具 Seaborn的官方网址如下:http://seaborn.pydata.org 一:definition Seaborn is a Py ...
- 推荐12个最好的 JavaScript 图形绘制库
众多周知,图形和图表要比文本更具表现力和说服力.图表是数据图形化的表示,通过形象的图表来展示数据,比如条形图,折线图,饼图等等.可视化图表可以帮助开发者更容易理解复杂的数据,提高生产的效率和 Web ...
- Vis.js – 基于浏览器的动态 JavaScript 可视化库
Vis.js 是一个动态的,基于浏览器的可视化库.该库被设计为易于使用,能处理大量的动态数据.该库由以下几部分组成:一是数据集和数据视图,基于灵活的键/值数据集,可以添加,更新和删除项目,订阅数据集变 ...
- 动态可视化库Vis.js:社交关系谱
Form Here:http://code.csdn.net/news/2819345 Vis.js 是一个动态的.基于浏览器的可视化库,可处理大量的动态数据并能与这些数据进行交互操作.该项目是由Al ...
- python 可视化库
在做titanic分析的过程中,看了一些大神的想法,发现在分析数据的过程中,许多大神会使用到seaborn,plotly这些库,而我等小白仅仅知道matplotlib这个唯一的数据可视化库而已.上网查 ...
- 5-1可视化库Seabon-整体布局风格设置
In [1]: import seaborn as sns import numpy as np import matplotlib as mpl import matplotlib.pyplot a ...
随机推荐
- hdoj1005(循环,找规律)
Problem Description A number sequence is defined as follows: f(1) = 1, f(2) = 1, f(n) = (A * f(n - 1 ...
- NumPy 高级索引
NumPy 高级索引 NumPy 比一般的 Python 序列提供更多的索引方式.除了之前看到的用整数和切片的索引外,数组可以由整数数组索引.布尔索引及花式索引. 整数数组索引 以下实例获取数组中(0 ...
- appium ,selenium ,webdriver 运行原理与机制
做测试开发的童鞋都知道,UI自动化你绕不开selenium, webdrvier, appium框架,那么这三者之间有什么关联,它们的原理是什么呢? 简单来说就是: Selenium2 将浏览器原生 ...
- f5冗余BIG-IP系统的安装
1.设备服务群集 •一个系列的BIG-Ips彼此互相支持DSC •每一台BIG-IP 自己生成一个Device Object •不同设备的信息 •建立信任证书 •在local device上设置Dev ...
- Python: 调用youtube_dl实现视频下载
研究PySide与youtube_dl结合实现视频下载,抽丝剥蚕,步步维艰,却也颇有意思. 记录初始心得.界面以PySide之Qt编写,调用youtube_dl下载,回调出下载进度,代码如下: # e ...
- 【php 之根据函数名称动态调用该函数】
解释函数:call_user_func()以及函数call_user_func_array() 对于PHP程序员而言,函数是再熟悉不过的事物了,毕竟我们整天都在和PHP内置函数以及我们自定义的函数打交 ...
- sqlserver还原数据库失败,sql2008备份集中的数据库备份与现有的xxx数据库不同
正常操作发现报标题错误,百度后解决思路如下(@参考文章)转到选项下面,勾选覆盖现有数据库即可
- EasyUI Dialog 对话框 关闭事件
在 $('#×××').dialog('close'); 执行后触发 $(function(){ $("#titledialos").dialog({ onClose: fun ...
- SAP transportation
1.CONFIGURATION TRANSPORT flow:DEV(100) --scc1--> DEV(400) --STMS after release-> QAS(510) --S ...
- Mysql的随机抽取
方法一 SELECT * FROM SHARE ORDER BY RAND( ) LIMIT 1; 在MYSQL的官方手册,里面针对RAND()的提示大概意思就是,在ORDER BY从句里面不能使用R ...