echarts的示例跟做出来的不一样
先给大家看下我做出来的和echarts官网做出来的 代码什么的都是一模一样但是颜色不一样 它字的颜色和柱状图颜色还一样不知道是不是脑子有猫病~
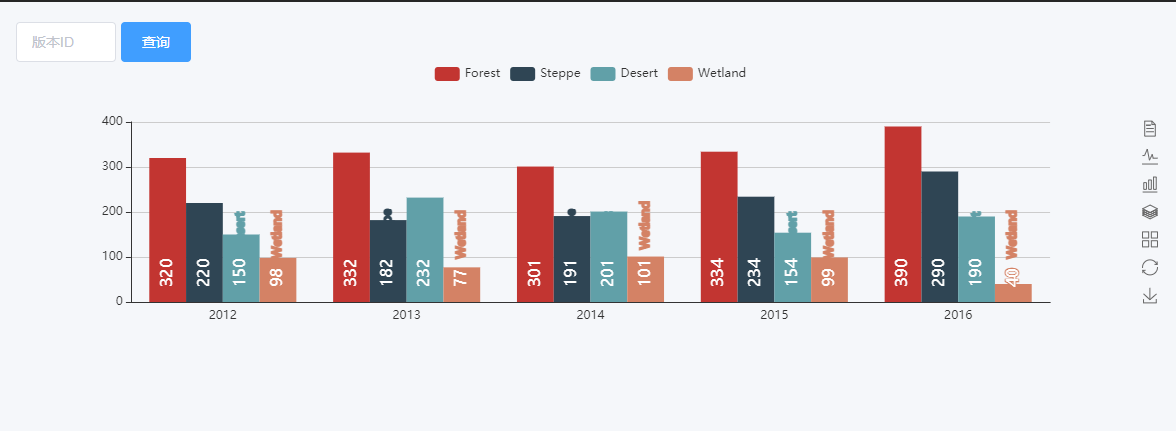
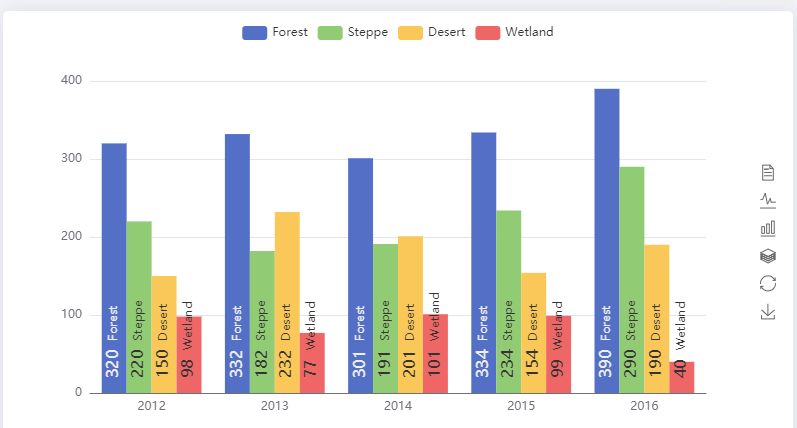
上面是我做的 下面是官网的
主要是代码都是一样 我又不是某宝买衣服 颜色差别这么大呢?
我给你们看代码下面是我写的
<template>

  <div>

    <div class="echarts" ref="echarts"></div>

  </div>

</template>

<script>

import echarts from 'echarts'

export default {

  name: 'dailyJournal',

  data() {

    return {

      chart: null,

      myChart: null,

      option: {},

    }

  },

  methods: {

    draw() {

      this.chart = this.$refs.echarts

      this.chart.style.height = 300 + 'px'

      this.myChart = echarts.init(this.chart)

      var app = {}

      var posList = [

        'left',

        'right',

        'top',

        'bottom',

        'inside',

        'insideTop',

        'insideLeft',

        'insideRight',

        'insideBottom',

        'insideTopLeft',

        'insideTopRight',

        'insideBottomLeft',

        'insideBottomRight'

      ]

      app.configParameters = {

        rotate: {

          min: -90,

          max: 90

        },

        align: {

          options: {

            left: 'left',

            center: 'center',

            right: 'right'

          }

        },

        verticalAlign: {

          options: {

            top: 'top',

            middle: 'middle',

            bottom: 'bottom'

          }

        },

        position: {

          options: posList.reduce(function(map, pos) {

            map[pos] = pos

            return map

          }, {})

        },

        distance: {

          min: 0,

          max: 100

        }

      }

      app.config = {

        rotate: 90,

        align: 'left',

        verticalAlign: 'middle',

        position: 'insideBottom',

        distance: 15,

        onChange: function() {

          var labelOption = {

            normal: {

              rotate: app.config.rotate,

              align: app.config.align,

              verticalAlign: app.config.verticalAlign,

              position: app.config.position,

              distance: app.config.distance

            }

          }

          this.myChart.setOption({

            series: [

              {

                label: labelOption

              },

              {

                label: labelOption

              },

              {

                label: labelOption

              },

              {

                label: labelOption

              }

            ]

          })

        }

      }

      var labelOption = {

        show: true,

        position: app.config.position,

        distance: app.config.distance,

        align: app.config.align,

        verticalAlign: app.config.verticalAlign,

        rotate: app.config.rotate,

        formatter: '{c}  {name|{a}}',

        fontSize: 16,

        rich: {

          name: {}

        }

      }

      this.option = {

        tooltip: {

          trigger: 'axis',

          axisPointer: {

            type: 'shadow'

          }

        },

        legend: {

          data: ['Forest', 'Steppe', 'Desert', 'Wetland']

        },

        toolbox: {

          show: true,

          orient: 'vertical',

          left: 'right',

          top: 'center',

          feature: {

            mark: { show: true },

            dataView: { show: true, readOnly: false },

            magicType: { show: true, type: ['line', 'bar', 'stack', 'tiled'] },

            restore: { show: true },

            saveAsImage: { show: true }

          }

        },

        xAxis: [

          {

            type: 'category',

            axisTick: { show: false },

            data: ['2012', '2013', '2014', '2015', '2016']

          }

        ],

        yAxis: [

          {

            type: 'value'

          }

        ],

        series: [

          {

            name: 'Forest',

            type: 'bar',

            barGap: 0,

            label: labelOption,

            emphasis: {

              focus: 'series'

            },

            data: [320, 332, 301, 334, 390]

          },

          {

            name: 'Steppe',

            type: 'bar',

            label: labelOption,

            emphasis: {

              focus: 'series'

            },

            data: [220, 182, 191, 234, 290]

          },

          {

            name: 'Desert',

            type: 'bar',

            label: labelOption,

            emphasis: {

              focus: 'series'

            },

            data: [150, 232, 201, 154, 190]

          },

          {

            name: 'Wetland',

            type: 'bar',

            label: labelOption,

            emphasis: {

              focus: 'series'

            },

            data: [98, 77, 101, 99, 40]

          }

        ]

      }

      this.myChart.setOption(this.option)

      // this.$nextTick(() => {

      window.addEventListener('resize', () => {

        this.myChart.resize()

      })

      // })

    }

  },

  mounted() {

     this.draw()

  }

}

</script>

<style></style>
下面看官网的 我都是下载示例copy官网一模一样
<!DOCTYPE html>

<html style="height: 100%">

    <head>

        <meta charset="utf-8">

    </head>

    <body style="height: 100%; margin: 0">

        <div id="container" style="height: 100%"></div>

        <script type="text/javascript" src="https://cdn.jsdelivr.net/npm/echarts@5/dist/echarts.min.js"></script>

        <script type="text/javascript">

var dom = document.getElementById("container");

var myChart = echarts.init(dom);

var app = {};

var option;

var posList = [

    'left', 'right', 'top', 'bottom',

    'inside',

    'insideTop', 'insideLeft', 'insideRight', 'insideBottom',

    'insideTopLeft', 'insideTopRight', 'insideBottomLeft', 'insideBottomRight'

];

app.configParameters = {

    rotate: {

        min: -90,

        max: 90

    },

    align: {

        options: {

            left: 'left',

            center: 'center',

            right: 'right'

        }

    },

    verticalAlign: {

        options: {

            top: 'top',

            middle: 'middle',

            bottom: 'bottom'

        }

    },

    position: {

        options: posList.reduce(function (map, pos) {

            map[pos] = pos;

            return map;

        }, {})

    },

    distance: {

        min: 0,

        max: 100

    }

};

app.config = {

    rotate: 90,

    align: 'left',

    verticalAlign: 'middle',

    position: 'insideBottom',

    distance: 15,

    onChange: function () {

        var labelOption = {

            normal: {

                rotate: app.config.rotate,

                align: app.config.align,

                verticalAlign: app.config.verticalAlign,

                position: app.config.position,

                distance: app.config.distance

            }

        };

        myChart.setOption({

            series: [{

                label: labelOption

            }, {

                label: labelOption

            }, {

                label: labelOption

            }, {

                label: labelOption

            }]

        });

    }

};

var labelOption = {

    show: true,

    position: app.config.position,

    distance: app.config.distance,

    align: app.config.align,

    verticalAlign: app.config.verticalAlign,

    rotate: app.config.rotate,

    formatter: '{c}  {name|{a}}',

    fontSize: 16,

    rich: {

        name: {

        }

    }

};

option = {

    tooltip: {

        trigger: 'axis',

        axisPointer: {

            type: 'shadow'

        }

    },

    legend: {

        data: ['Forest', 'Steppe', 'Desert', 'Wetland']

    },

    toolbox: {

        show: true,

        orient: 'vertical',

        left: 'right',

        top: 'center',

        feature: {

            mark: {show: true},

            dataView: {show: true, readOnly: false},

            magicType: {show: true, type: ['line', 'bar', 'stack', 'tiled']},

            restore: {show: true},

            saveAsImage: {show: true}

        }

    },

    xAxis: [

        {

            type: 'category',

            axisTick: {show: false},

            data: ['2012', '2013', '2014', '2015', '2016']

        }

    ],

    yAxis: [

        {

            type: 'value'

        }

    ],

    series: [

        {

            name: 'Forest',

            type: 'bar',

            barGap: 0,

            label: labelOption,

            emphasis: {

                focus: 'series'

            },

            data: [320, 332, 301, 334, 390]

        },

        {

            name: 'Steppe',

            type: 'bar',

            label: labelOption,

            emphasis: {

                focus: 'series'

            },

            data: [220, 182, 191, 234, 290]

        },

        {

            name: 'Desert',

            type: 'bar',

            label: labelOption,

            emphasis: {

                focus: 'series'

            },

            data: [150, 232, 201, 154, 190]

        },

        {

            name: 'Wetland',

            type: 'bar',

            label: labelOption,

            emphasis: {

                focus: 'series'

            },

            data: [98, 77, 101, 99, 40]

        }

    ]

};

if (option && typeof option === 'object') {

    myChart.setOption(option);

}

        </script>

    </body>

</html>
想问下大神们我都没有改啥为什么差别这么大 颜色也不知道在哪里改。。。。。
echarts的示例跟做出来的不一样的更多相关文章
- Echarts图表常用功能配置,Demo示例
先看下效果图: 就如上图所示,都是些常用的基本配置. Legend分页,X轴设置,Y轴设置,底部缩放条设置, 数值显示样式设置,工具箱设置,自定义工具按钮, 绑定点击事件等等.这些配置代码中都做了简单 ...
- 基于Servlet的Echarts例子(2018-12-26更新)
引子 ECharts是百度出品的,一个使用 JavaScript 实现的开源可视化库.程序员在Web页面上引入并稍作配置就能做出漂亮的数据图表. 本篇文章简单介绍一下如何在JSP中使用Echarts, ...
- 在react项目中使用ECharts
这里我们要在自己搭建的react项目中使用ECharts,我们可以在ECharts官网上看到有一种方式是在 webpack 中使用 ECharts,我们需要的就是这种方法. 我们在使用ECharts之 ...
- echarts图表的封装
其实echarts官网有个快速上手的教程,一般人看一遍也知道是怎么回事,先给个传送门吧--五分钟上手 引入方式多种多样就自己去官网看了--这里简单介绍echarts怎么用,下方的封装函数比较重要 1. ...
- Vue3+vite+Echarts案例大屏可视化--千峰(推荐)
https://www.bilibili.com/video/BV14u411D7qK?p=33&spm_id_from=pageDriver&vd_source=e2cfe74d93 ...
- Webstorm+Webpack+echarts构建个性化定制的数据可视化图表&&两个echarts详细教程(柱状图,南丁格尔图)
Webstorm+Webpack+echarts ECharts 特性介绍 ECharts,一个纯 Javascript 的图表库,可以流畅的运行在 PC 和移动设备上,兼容当前绝大部分浏览器(I ...
- ASP.NET MVC5+EF6+EasyUI 后台管理系统(67)-MVC与ECharts
系列目录 ECharts 特性介绍 ECharts,一个纯 Javascript 的图表库,可以流畅的运行在 PC 和移动设备上,兼容当前绝大部分浏览器(IE8/9/10/11,Chrome,Fire ...
- 数据图表插件Echarts(一)
一.引言 最近做一个智慧城市项目,项目中需要图表和报表进行数据分析,从网上找了很多,最后找到了百度开放的echarts,一个很强大的插件. 二.介绍 ECharts,缩写来自Enterprise Ch ...
- Ionic2系列——在Ionic2中使用ECharts
在群里看到有人问怎么在Ionic2中集成ECharts来显示图表.当时答应说写个blog,简单写下步骤. 在TypeScript中如果要使用第三方库,必须要有d.ts,也就是定义文件,没有这个文件的话 ...
- ECharts的简单使用过程
网页中经常要使用图表,以前使用的是highcharts插件,现在发现echarts使用起来和highcharts差不多,但是个人感觉echarts更酷炫,以下是echarts的使用过程,其实highc ...
随机推荐
- Kafka 集群副本数量调整
Kafka 创建时未指定多个副本或者副本数量过少,都可以在后期手动添加,另外如果副本过多也可以减少,当前调整基于 Kafka 的版本是 2.5.1,但是估计 2.1 ~ 2.5 应该都是兼容的. 下面 ...
- Redis持久化技术浅析
Redis是一种内存数据库,数据都存储在内存中,因此可以快速地直接基于内存中的数据结构进行高性能的操作,但是所有数据都在内存中,一旦服务器宕机,内存中的数据就会全部丢失,数据将无法恢复,因此Redis ...
- OceanBase初体验之部署生产标准的三节点分布式集群
前置条件 OceanBase 数据库集群至少由三个节点组成,所以先准备好3台服务器: IP 配置 操作系统 x.x.x.150 Intel x86 12C 64G内存 1T SSD CentOS 7. ...
- 我在阿里巴巴做 Serverless 云研发平台
简介: Serverless 云研发平台经过这半年多的蜕变,已经从简单的解决工程链路的平台演进成一个面向研发.上线.运维的全生命周期研发平台,后续要解决的命题会集中在用户低门槛上. 作者 | 林昱(苏 ...
- 2019-8-31-NuGet-如何设置图标
title author date CreateTime categories NuGet 如何设置图标 lindexi 2019-08-31 16:55:58 +0800 2019-4-27 17: ...
- 【学习笔记】Python 使用 matplotlib 画图
目录 安装 中文显示 折线图.点线图 柱状图.堆积柱状图 坐标轴断点 参考资料 本文将介绍如何使用 Python 的 matplotlib 库画图,记录一些常用的画图 demo 代码 安装 # 建议先 ...
- golang 中 strings 包的 Replace 用法介绍笔记
函数申明: func Replace(s, old, new string, n int) string 官方描述为: 返回将s中前n个不重叠old子串都替换为new的新字符串,如果n<0会替换 ...
- 1.简单的C语言程序
简单的C语言程序 什么是计算机程序? 什么是计算机语言? 所谓程序,就是一组计算机能识别和执行的指令. 什么是计算机语言? 机器语言(0,1 '低级语言'),汇编语言(符号化 '低级语言'),高级语言 ...
- synchronized原理-字节码分析、对象内存结构、锁升级过程、Monitor
本文分析的问题: synchronized 字节码文件分析之 monitorenter.monitorexit 指令 为什么任何一个Java对象都可以成为一把锁? 对象的内存结构 锁升级过程 Moni ...
- C++ 资源大全:标准库、Web框架、人工智能等 | 最全整理
C++ 资源列表,内容包括: 标准库.Web应用框架.人工智能.数据库.图片处理.机器学习.日志.代码分析等 目录 进程间通信 Json 日志 机器学习 数学 内存分配 多媒体 网络 PDF 物理学 ...