[D3] 7. Quantitative Scales
# Quantitative Scales
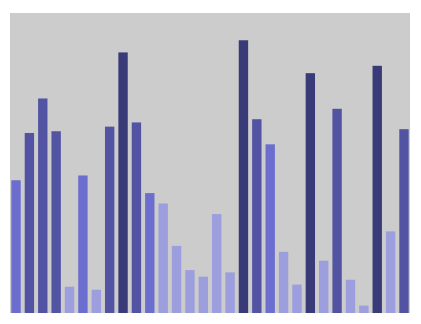
    var colorScale = d3.scale.quantile()

            .domain([d3.max(dataset) / 4, d3.max(dataset) / 2 , 3*d3.max(dataset) / 4, d3.max(dataset)])

            .range(["#9c9ede","#6b6ecf","#5254a3", "#393b79"]);
So the code divide the value into 4 range, if the value smaller than 1/4 max value, then it use #9c9ede color;
from 1/4 - 1/2: #6b6ecf
...
from 3/4 - 1: #393b79
 var q = d3.scale.quantize().domain([0, 1]).range(['a', 'b', 'c']);

 //q(0.3) === 'a', q(0.4) === 'b', q(0.6) === 'b', q(0.7) ==='c';

 //q.invertExtent('a') returns [0, 0.3333333333333333]
### use:
.attr('fill', colorScale);
<!DOCTYPE html>

<html>

<head lang="en">

    <meta charset="UTF-8">

    <title></title>

    <script src="../bower_components/underscore/underscore-min.js"></script>

    <script src="../ventor/d3.min.js"></script>

    <style type="text/css">

        body

        {

            padding-top: 50px;

            padding-left: 100px;

        }

        #chartArea {

            width: 400px;

            height: 300px;

            background-color: #CCC;

        }

        .bar

        {

            display: inline-block;

            width: 20px;

            height: 75px; /* Gets overriden by D3-assigned height below */

            margin-right: 2px;

           /* fill: teal; *//* SVG doesn't have background prop, use fill instead*/

            z-index:99;

        }

    </style>

</head>

<body>

<section id="chartArea"></section>

<script>

    var dataset = _.map(_.range(30), function(num) {

        return Math.random() * 50;

    }), //reandom generate 15 data from 1 to 50

            w = 400, h = 300;

    var svg = d3.select('#chartArea').append('svg')

            .attr('width', w)

            .attr('height', h); //svg deosn't need 'px'

    var yScale = d3.scale.linear()

            .domain([0, d3.max(dataset) * 1.1]) //d3.max(dataset), set the max val of database

            .range([0, h]);

    var xScale = d3.scale.ordinal()

            .domain(dataset)

            .rangeBands([0,w],0.3, 0.1);

//    var colorScale = d3.scale.category20c();

    var colorScale = d3.scale.quantile()

            .domain([d3.max(dataset) / 4, d3.max(dataset) / 2 , 3*d3.max(dataset) / 4, d3.max(dataset)])

            .range(["#9c9ede","#6b6ecf","#5254a3", "#393b79"]);

    svg.selectAll('div')

            .data(dataset)

            .enter()

            .append('rect')// svg doesn't have div, use rect instead

            .attr('class', "bar")

            .attr('width', xScale.rangeBand())

            .attr('x', function(each_data, index){

                return xScale(each_data);

            })

            .attr('y', function(each_data){

                return h-yScale(each_data);

            })

            .attr('height', function(each_data, i){

                return yScale(each_data);

            })

            .attr('fill', colorScale);

</script>

</body>

</html>
[D3] 7. Quantitative Scales的更多相关文章
- 【D3.V3.js系列教程】--(十二)坐标尺度
[D3.V3.js系列教程]--(十二)坐标尺度 1.多种类型的缩放尺度 Quantitative Scales Linear Scales Identity Scales Power Scales ...
- D3 JS study notes
如何使用d3来解析自定义格式的数据源? var psv = d3.dsvFormat("|"); // This parser can parse pipe-delimited t ...
- 【D3 API 中文手冊】
[D3 API 中文手冊] 声明:本文仅供学习所用,未经作者同意严禁转载和演绎 <D3 API 中文手冊>是D3官方API文档的中文翻译. 始于2014-3-23日,基于VisualCre ...
- D3——scale
d3.scale 比例尺 “Scales are functions that map from an input domain to an output range” Domains 定义域 和 R ...
- [D3] Build a Column Chart with D3 v4
Column and bar charts are staples of every visualization library. They also make a great project for ...
- [D3] Convert Dates to Numeric Values with Time Scales in D3 v4
Mapping abstract values to visual representations is what data visualization is all about, and that’ ...
- [D3] Convert Input Data to Output Values with Linear Scales in D3
Mapping abstract values to visual representations is what data visualization is all about, and that’ ...
- [D3] Create Labels from Non-numeric Data with Ordinal Scales in D3 v4
When your data contains discrete, non-numeric property values that you need to format or convert bef ...
- [D3] Create Labels from Numeric Data with Quantize Scales in D3 v4
Sometimes data needs to be converted from a continuous range, like test scores, to a discrete set of ...
随机推荐
- Cocoa Touch 框架
Cocoa Touch包括: (1)Core Animation: 通过Core Animation,可以通过一个基于独立图层的简单的编程模型来创建丰富的用户体验. (2)Core Audio: Co ...
- [置顶] Android Journal
==================================================================================================== ...
- js获取域名的方法
本文实例讲述了js获取域名的方法.分享给大家供大家参考.具体实现方法如下: 复制代码代码如下: <script>//获取域名var k_host = window.location.hos ...
- hdu 1824
也是一道2-sat的入门题: 不过题目描述的不清楚,看了别人的题解才知道题意: 和上面的那题差不多,一个模板: 代码: #include<cstdio> #include<stack ...
- 【HDU3374】 String Problem (最小最大表示法+KMP)
String Problem Description Give you a string with length N, you can generate N strings by left shift ...
- [wikioi]最长严格上升子序列
http://wikioi.com/problem/1576/ 经典的动态规划.我写了个o(n^2)的DP方法. PPT:http://wenku.baidu.com/view/bd290294dd8 ...
- ANDROID_MARS学习笔记_S05_002_给传感器注册listener
1 @Override public void onCreate(Bundle savedInstanceState) { super.onCreate(savedInstanceState); se ...
- ANDROID_MARS学习笔记_S03_003_LocationManager、LocationListener
一.简介 二.代码1.xml (1)AndroidManifest.xml 增加 <uses-permission android:name="android.permission.A ...
- ubuntu下eclipse突然崩溃,解决办法
rm YOUR_WORKSPACE/.metadata/.plugins/org.eclipse.core.resources/.snap 抛出的一场如下: !SESSION 2013-09-30 1 ...
- Library Cache Lookup
Libraey Cache Data Access library cache是关于SQL语句的SGA中的一系列的链表, library cache是通过访问一系列的hash buckets,实现使用 ...