怎样获取Windows平台下SQL server性能计数器值
转载自工作伙伴Garrett, Helen “SQL Server Performance Counter captures”
Capturing Windows Performance Counters for SQL Server
SQL Server Performance Counters
The following counters are the recommended list to capture baseline performance metrics for SQL Server:
- Memory Available Mbytes (already added above)
- Memory Page Faults/sec (already added above)
- Memory Page Reads/sec (already added above)
- Memory Page Writes/sec (already added above)
- Paging File % Usage (_Total) (already added above)
- Processor % Privileged Time (_Total)
- Processor % Processor Time (_Total)
- Processor % User Time (_Total)
- Physical Disk % Idle Time (_Total)
- Physical Disk Avg. Disk Queue Length (_Total)
- Physical Disk Avg. Disk sec/Read (_Total)
- Physical Disk Avg. Disk sec/Transfer (_Total)
- Physical Disk Avg. Disk sec/Write (_Total)
- SQL Server: Access Methods/Page Splits/sec
- SQL Server: Buffer Manager Buffer Cache Hit Ratio
- SQL Server: Buffer Manager Page Life Expectancy
- SQL Server: Buffer Manager Page Lookups/sec
- SQL Server: Buffer Manager Page Reads/sec
- SQL Server: Buffer Manager Page Writes/sec
- SQL Server: General Statistics User Connections
- SQL Server: Memory Manager Memory Grants Pending
- SQL Server: SQL Statistics Batch Requests/sec
- SQL Server: SQL Statistics SQL Compilations/sec
- SQL Server: SQL Statistics SQL Recompilations/sec
- SQL Server: Wait Statistics Memory Grant Queue Waits <all instances>
- SQL Server: Wait Statistics Network IO Waits <all instances>
- SQL Server: Wait Statistics Non-Page Latch Waits <all instances>
- SQL Server: Wait Statistics Page IO Latch Waits <all instances>
- SQL Server: Wait Statistics Page Latch Waits <all instances>
- System Processor Queue Length
TypePerf
Microsoft provides a command line utility “TypePerf” which allows capturing counters from a remote system to a monitoring system and logging these either to the command window or a log file.
More information about the TypePerf command can be found at:
https://www.microsoft.com/resources/documentation/windows/xp/all/proddocs/en-us/nt_command_typeperf.mspx?mfr=true
Using TypePerf with an Input File
Create a folder on the monitoring server named “TypePerf”.
Create a new file in the TypePerf folder named
TypePerf_SQLCounters.txt.
Edit the TypePerf_SQLCounters.txt file by copying the following
contents into the file:
\\SERVERNAME\Memory\Available Bytes
\\SERVERNAME\Memory\Page Reads/sec
\\SERVERNAME\Memory\Page Writes/sec
\\SERVERNAME\Paging File(_Total)\% Usage
\\SERVERNAME\PhysicalDisk(_Total)\% Disk Time
\\SERVERNAME\PhysicalDisk(_Total)\Avg. Disk Queue Length
\\SERVERNAME\PhysicalDisk(_Total)\Avg. Disk sec/Read
\\SERVERNAME\PhysicalDisk(_Total)\Avg. Disk sec/Transfer
\\SERVERNAME\PhysicalDisk(_Total)\Avg. Disk sec/Write
\\SERVERNAME\Processor(_Total)\% Privileged Time
\\SERVERNAME\Processor(_Total)\% Processor Time
\\SERVERNAME\Processor(_Total)\% User Time
\\SERVERNAME\SQLServer:Access Methods\Page Splits/sec
\\SERVERNAME\SQLServer:Buffer Manager\Buffer cache hit ratio
\\SERVERNAME\SQLServer:Buffer Manager\Page life expectancy
\\SERVERNAME\SQLServer:Buffer Manager\Page lookups/sec
\\SERVERNAME\SQLServer:General Statistics\User Connections
\\SERVERNAME\SQLServer:Memory Manager\Memory Grants Pending
\\SERVERNAME\SQLServer:SQL Statistics\Batch Requests/sec
\\SERVERNAME\SQLServer:SQL Statistics\SQL Compilations/sec
\\SERVERNAME\SQLServer:SQL Statistics\SQL Re-Compilations/sec
\\SERVERNAME\SQLServer:Wait Statistics(*)\Memory grant queue
waits
\\SERVERNAME\SQLServer:Wait Statistics(*)\Network IO waits
\\SERVERNAME\SQLServer:Wait Statistics(*)\Page IO latch waits
\\SERVERNAME\SQLServer:Wait Statistics(*)\Page latch waits
\\SERVERNAME\System\Processor Queue Length

Perform a global replace of the SERVERNAME to match the actual server
name for the SQL Server that is to be monitored. Save the file and Close.
--------------------------------------------------------------分割线---------------------------------------------------------------------------
Go to the Start menu -> Command Prompt.

Change the directory to the location where the TypePerf directory was created.
At the command prompt, modify the next command to match the information for the SQL Server being monitored:
TYPEPERF -cf F:\TypePerf\TypePerf_SQLCounters.txt -f csv -o F:\TypePerf\MSLAB2191_yyyymmdd_hhmm.csv -s BRTC_MSLAB2191
-cf Name of the file that contains the list of counters to capture
-f format of the log file, defaults to csv
-o Path\name of output file
-s Name of server to collect the counters from if one does not exist in the counter file
EXAMPLE:
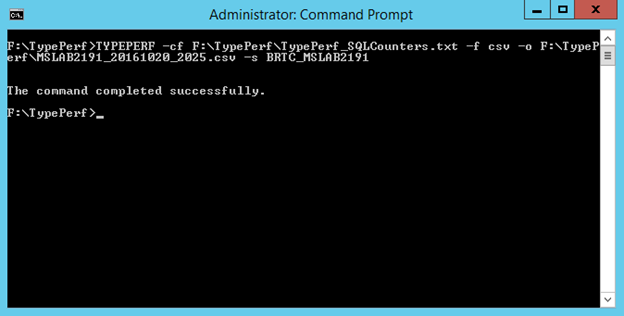
TYPEPERF -cf F:\TypePerf\TypePerf_SQLCounters.txt -f csv -o F:\TypePerf\MSLAB2191_20161020_2025.csv -s BRTC_MSLAB2191
Press Enter to start the counter collection…

The [\] will run the command and capture the counters every second.
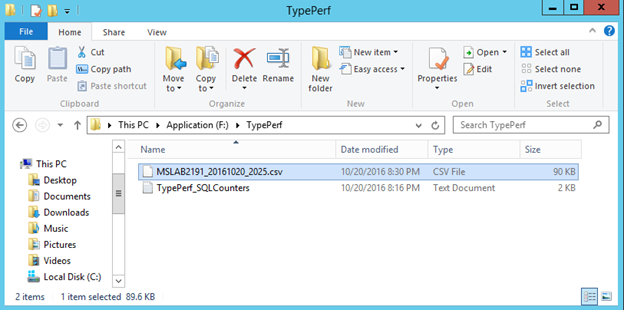
Verify the file you specified for the output was created and is growing:
-------------------------------------------------------分割线-----------------------------------------------------------------------
When you have completed the SQL Server test, Press CTRL-C to stop the counter collection.
Close the Command Prompt window.
怎样获取Windows平台下SQL server性能计数器值的更多相关文章
- Windows平台下MySQL常用操作与命令
Windows平台下MySQL常用操作与命令 Windows平台下MySQL常用操作与命令,学习mysql的朋友可以参考下. 1.导出整个数据库 mysqldump -u 用户名 -p --defau ...
- Windows平台下Git服务器搭建
第一步:下载Java,下载地址:http://www.java.com/zh_CN/ 第二步:安装Java.安装步骤不再详述. 第三步:配置Java环境变量. 右键”计算机” => ”属性” = ...
- Windows 平台下Git 服务器搭建
由于项目中一直在使用git作为版本管理,自己对git的理解.使用都还不是怎么的熟悉,所以准备深入了解一下git及一些常用命令的使用,于是干脆把服务端架上,通过自己的PC作为服务端同时作为客户端的角色进 ...
- windows平台下VLC2.0.5编译
windows平台下VLC2.0.5编译说明 时隔一年多,又要搞流媒体了,不过这次是要做流媒体服务器. 暂时决定使用vlc+ffmpeg+live555,虽然听有些前辈说这个组合的性能较差,只能作为学 ...
- 【转】Windows平台下Git服务器搭建
Windows平台下Git服务器搭建 Posted on 2015-05-18 21:29 阿祥当码农 阅读(7637) 评论(0) 编辑 收藏 该文章转自:http://www.codeceo.co ...
- Windows平台下的node.js安装
Windows平台下的node.js安装 直接去nodejs的官网http://nodejs.org/上下载nodejs安装程序,双击安装就可以了 测试安装是否成功: 在命令行输入 node –v 应 ...
- windows平台下nginx+PHP环境安装
因为日常工作在windows下,为方便在window是下进行PHP开发,需要在windows平台下搭建PHP开发环境,web服务器选择nginx,不过windows版本的nginx性能要比Linux/ ...
- Windows平台下Oracle实例启动过程中日志输出
Windows平台下Oracle实例启动过程中日志输出记录. 路径:D:\app\Administrator\diag\rdbms\orcl\orcl\trace\alert_orcl.log 输出内 ...
- windows系统与SQL SERVER 2008数据库服务性能监控分析简要
软件系统性能测试体系流程介绍之windows系统与SQL SERVER 2008数据库服务性能监控分析简要 目前大部分测试人员对操作系统资源.中间件.数据库等性能监控分析都是各自分析各自的监控指标方式 ...
随机推荐
- Javascript实现页面跳转的几种方式
概述 相信很多Web开发者都知道,在开发Web程序的时候,对于页面之间的跳转,有很多种,但是有效的跳转则事半功倍,下面就是我在平时的开发过程中所用到的一些JavaScript跳转方式,拿出和大家共享一 ...
- Pycharm Professional Edition 激活码(license)
http://blog.csdn.net/yangysc/article/details/52355865 43B4A73YYJ-eyJsaWNlbnNlSWQiOiI0M0I0QTczWVlKIiw ...
- json转js对象
<!DOCTYPE html> <html> <head> <meta charset="UTF-8"> <title> ...
- 20155206赵飞技能获取经验,C语言学习感想与对JAVA的学习目标
自己较强的技能获取经验. 1:实话实说我自己是没有哪个技能可以超过90%的人的,只有自认为做的还可以的一些事情,例如打篮球,office软件的应用,一百米跑.至于其他方面就是很平庸了. 2:经验主要有 ...
- iOS10 导航条,这个二狗子变了...踩坑
1.iOS10导航透明要转换一个透明image UIImage *image = IsDeviceVersionIOS10 ? [WeUtils imageWithColor:[UIColor cle ...
- 在Swift项目中使用cocoaPods导入第三方OC库
首先保证你的项目是基于cocoaPods的,并且是通过XX.xcworkspace打开的.cocoaPods安装教程(Xcode6以上) 下面就第三方库MBProgressHUD来讲解如何在Swift ...
- 转:linux下jar命令与jar包
原文链接:http://blog.chinaunix.net/uid-692788-id-2681136.htmlJAR包是Java中所特有一种压缩文档,其实大家就可以把它理解为.zip包.当然也是有 ...
- windows下面配置apache+http
一.apache安装 下载并安装apache_2.2.9-win32-x86-openssl-0.9.8h-r2.msi(见附件),找到apache安装目录(C:\Program Files (x86 ...
- H5音频和视频
使用媒体标签最大的缺点在于缺少编解码器的支持一.浏览器支持性检测检测浏览器是否支持audio元素或video元素最简单的方式就是用脚本动态创建它,然后检测特定函数是否存在 var hasVideo=! ...
- 返回值是TEXT的阿贾克斯方法
<!DOCTYPE html PUBLIC "-//W3C//DTD XHTML 1.0 Transitional//EN" "http://www.w3.org/ ...