使用dotnet-dump 查找 .net core 3.0 占用CPU 100%的原因
公司的产品一直紧跟 .net core 3.0 preview 不断升级, 部署到 Linux 服务器后, 偶尔会出现某个进程CPU占用100%.
由于服务部署在云上, 不能使用远程调试; 在局域网内的Linux 服务器 或 Windows开发机上又不能重现这个问题, 联想到Java的jstack, 很是羡慕啊. 想到.net core 已经出来这么久了, 还是试着找找看吧, 结果还真找到一篇博客Introducing diagnostics improvements in .NET Core 3.0
这篇文章介绍了3个工具
- dotnet-counters: 实时统计runtime的状况, 包括 CPU、内存、GC、异常等
- dotnet-trace: 类似性能探测器
- dotnet-dump: 程序崩溃时使用该工具
这次使用的是dotnet-dump, 即使程序没有崩溃, 也可以dump程序快照, 用于分析
实验环境
ubuntu-16.04.5-desktop-amd64
SDK 3.0.100-preview6-012264
1. 新建一个简单Console程序(只能是 .net core 3.0的程序, 不支持 .net core 2.2), 模拟CPU占用100%的情况
mkdir NetCoreDumpTest && cd NetCoreDumpTest

dotnet new console
编辑Program.cs
namespace NetCoreDumpTest

{

    using System;

    using System.Threading.Tasks;

    class Program

    {

        static void Main(string[] args)

        {

            Task.Factory.StartNew(() => PrintNumber("Print", ));

            Console.WriteLine("Press any key to exit.");

            Console.ReadKey();

        }

        static void PrintNumber(string message, int startNumber)

        {

            var number = startNumber;

            while (true)

                Console.WriteLine($"{message} {number++}");

        }

    }

}
2. 安装dotnet-dump
dotnet tool install --global dotnet-dump --version 1.0.-preview6.19311.1
提示
If you are using bash, you can add it to your profile by running the following command:

cat << \EOF >> ~/.bash_profile

# Add .NET Core SDK tools

export PATH="$PATH:/home/****/.dotnet/tools"

EOF

You can add it to the current session by running the following command:

export PATH="$PATH:/home/****/.dotnet/tools"

You can invoke the tool using the following command: dotnet-dump

Tool 'dotnet-dump' (version '1.0.4-preview6.19311.1') was successfully installed.
建议将 $HOME/.dotnet/tools加入到PATH, 好吧, 照着做吧, 记得使用下面的命令使设置立即生效
source ~/.bash_profile
3. 使用 dotnet NetCoreDumpTest.dll 启动我们的问题程序, 然后使用 ps -ef | grep dotnet 查看程序的进程ID, 可以看到进程ID是 3411
ps -ef | grep dotnet
z*****e          : pts/    :: dotnet NetCoreDumpTest.dll

z*****e           : pts/    :: grep --color=auto dotnet
针对进程3411, 我们还需要知道是哪个线程占CPU, 使用 top -Hp 3411 可以列出所有线程, 由于top每隔3秒刷新一次, 所以可能需要多观察几秒才能看到具体是哪个线程占用CPU比较高, 这里我们可以看到是PID=3418的线程(Linux的进程ID和线程ID请自行了解一下).
top -Hp

   PID USER      PR  NI    VIRT    RES    SHR S %CPU %MEM     TIME+ COMMAND

   z*****e             R 10.3  1.4   :20.68 dotnet

   z*****e             S  0.0  1.4   :00.11 dotnet

   z*****e             S  0.0  1.4   :00.02 dotnet

   z*****e             S  0.0  1.4   :00.00 dotnet

   z*****e             S  0.0  1.4   :00.00 dotnet

   z*****e             S  0.0  1.4   :00.01 dotnet

   z*****e             S  0.0  1.4   :00.00 dotnet

   z*****e             S  0.0  1.4   :00.00 dotnet

   z*****e             S  0.0  1.4   :00.00 dotnet
获取dump, 只能正对进程进行dump, 所以我们输入的是 3411
dotnet-dump collect -p

Writing minidump with heap to /tmp/core_20190623_075649

Complete
4. 分析
dotnet-dump analyze core_20190623_075649
使用clrthreads 查看所有线程
>clrthreads

ThreadCount:

UnstartedThread:

BackgroundThread:

PendingThread:

DeadThread:

Hosted Runtime:   no

                                                                                                        Lock

 DBG   ID OSID ThreadOBJ           State GC Mode     GC Alloc Context                  Domain           Count Apt Exception

         d53 0000000001307D80     Preemptive  :       Ukn

         d57 000000000135BBD0     Preemptive  :       Ukn (Finalizer)

         d59 00007F666C0009F0   Preemptive  :       Ukn (Threadpool Worker)

         d5a 000000000130DA40   Preemptive  00007F6678106860:00007F6678106F20       Ukn (Threadpool Worker)
我们关心的线程3418的16进制是d5a, 也就是最后一行, 它的DBG是7, 我们需要使用 setthread 7, 将其设置为 当前操作的线程
然后使用 clrstack 获取线程调用信息
> setthread

> clrstack

OS Thread Id: 0xd5a ()

        Child SP               IP Call Site

00007F6715561558 00007f671a2bd4bd [InlinedCallFrame: 00007f6715561558] Interop+Sys.Write(System.Runtime.InteropServices.SafeHandle, Byte*, Int32)

00007F6715561558 00007f669f669a9e [InlinedCallFrame: 00007f6715561558] Interop+Sys.Write(System.Runtime.InteropServices.SafeHandle, Byte*, Int32)

00007F6715561540 00007F669F669A9E ILStubClass.IL_STUB_PInvoke

00007F67155615E0 00007F669F67333E System.ConsolePal.Write(Microsoft.Win32.SafeHandles.SafeFileHandle, Byte*, Int32, Boolean)

00007F67155616A0 00007F669F67360C System.ConsolePal.Write(Microsoft.Win32.SafeHandles.SafeFileHandle, Byte[], Int32, Int32, Boolean) [/_/src/System.Console/src/System/ConsolePal.Unix.cs @ ]

00007F67155616C0 00007F669F672B2A System.IO.StreamWriter.Flush(Boolean, Boolean) [/_/src/System.Private.CoreLib/shared/System/IO/StreamWriter.cs @ ]

00007F6715561710 00007F669F6729F3 System.IO.StreamWriter.WriteLine(System.String) [/_/src/System.Private.CoreLib/shared/System/IO/StreamWriter.cs @ ]

00007F6715561760 00007F669F6727D3 System.IO.TextWriter+SyncTextWriter.WriteLine(System.String) [/_/src/System.Private.CoreLib/shared/System/IO/TextWriter.cs @ ]

00007F67155617A0 00007F669F672770 System.Console.WriteLine(System.String) [/_/src/System.Console/src/System/Console.cs @ ]

00007F67155617C0 00007F669F663791 NetCoreDumpTest.Program.PrintNumber(System.String, Int32) [/home/zhouke/NetCoreDumpTest/Program.cs @ ]

00007F6715561800 00007F669F6636D9 NetCoreDumpTest.Program+<>c.<Main>b__0_0()

00007F6715561820 00007F669F1872A1 System.Threading.Tasks.Task.InnerInvoke() [/_/src/System.Private.CoreLib/shared/System/Threading/Tasks/Task.cs @ ]

00007F6715561840 00007F669F18CBC2 System.Threading.Tasks.Task+<>c.<.cctor>b__274_0(System.Object) [/_/src/System.Private.CoreLib/shared/System/Threading/Tasks/Task.cs @ ]

00007F6715561850 00007F669F171AF2 System.Threading.ExecutionContext.RunFromThreadPoolDispatchLoop(System.Threading.Thread, System.Threading.ExecutionContext, System.Threading.ContextCallback, System.Object) [/_/src/System.Private.CoreLib/shared/System/Threading/ExecutionContext.cs @ ]

00007F6715561890 00007F669F187111 System.Threading.Tasks.Task.ExecuteWithThreadLocal(System.Threading.Tasks.Task ByRef, System.Threading.Thread) [/_/src/System.Private.CoreLib/shared/System/Threading/Tasks/Task.cs @ ]

00007F6715561910 00007F669F186F28 System.Threading.Tasks.Task.ExecuteEntryUnsafe(System.Threading.Thread) [/_/src/System.Private.CoreLib/shared/System/Threading/Tasks/Task.cs @ ]

00007F6715561930 00007F669F186EBB System.Threading.Tasks.Task.ExecuteFromThreadPool(System.Threading.Thread)

00007F6715561940 00007F669F17B754 System.Threading.ThreadPoolWorkQueue.Dispatch() [/_/src/System.Private.CoreLib/shared/System/Threading/ThreadPool.cs @ ]

00007F67155619C0 00007F669F169A5B System.Threading._ThreadPoolWaitCallback.PerformWaitCallback() [/_/src/System.Private.CoreLib/src/System/Threading/ThreadPool.CoreCLR.cs @ ]

00007F6715561D50 00007f6718a1ccaf [DebuggerU2MCatchHandlerFrame: 00007f6715561d50]
哗啦啦一大片, 有点Java调用堆栈的味道, 不过我们还是找到了我们的问题代码
NetCoreDumpTest.Program.PrintNumber(System.String, Int32)
有时候我们想知道传入的什么参数导致CPU占用高, 可以给clrstack加上参数 -a
> clrstack -a

..............

00007F0DD6FFC7C0 00007F0D6EEF3791 NetCoreDumpTest.Program.PrintNumber(System.String, Int32) [/home/zhouke/NetCoreDumpTest/Program.cs @ ]

    PARAMETERS:

        message (0x00007F0DD6FFC7E8) = 0x00007f0d4800b8b0

        startNumber (0x00007F0DD6FFC7E4) = 0x0000000000000005

    LOCALS:

        0x00007F0DD6FFC7E0 = 0x000000000014e42b

        0x00007F0DD6FFC7DC = 0x0000000000000001

...............
可以看到PARAMETERS里, startNumber作为值类型, 可以直接看到数值为5, 而message是引用类型, 指向0x00007f0d4800b8b0, 这时候需要用到 dumpobj 命令
> dumpobj 0x00007f0d4800b8b0

Name:        System.String

MethodTable: 00007f0d6ef70f90

EEClass:     00007f0d6eede1c0

Size:        (0x20) bytes

File:        /home/zhouke/dotnet/shared/Microsoft.NETCore.App/3.0.-preview6--/System.Private.CoreLib.dll

String:      Print

Fields:

              MT    Field   Offset                 Type VT     Attr            Value Name

00007f0d6ef6a138  400022b                 System.Int32   instance                 _stringLength

00007f0d6ef66f38  400022c        c          System.Char   instance                _firstChar

00007f0d6ef70f90  400022d              System.String     static 00007f0d47fff360 Empty
好了, 可以看到它是一个字符串, 内容为 "Print"
假如message是一个复杂类型, 可以查看Fields下面的信息进一步查看
clrstack 还有一个实验性质的参数 -i, 协助查看各种变量信息, 需要用到lldb, 按照官方教程, 我暂时没有实验成功.
查看进程ID和线程ID, 更方便的方法是 htop(需要安装), 然后按 F4 进行过滤, 输入dotnet 即可
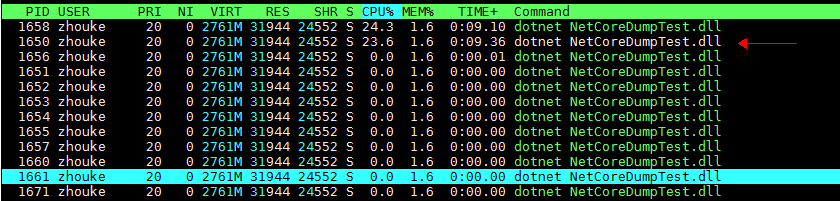
这张图是重新运行问题程序的结果, 进程ID和线程ID与前面不一样
第二行白色的是进程ID=1650, 第一行CPU占用高, 是问题线程ID=1658
End
使用dotnet-dump 查找 .net core 3.0 占用CPU 100%的原因的更多相关文章
- linux下查找java进程占用CPU过高原因
1. 查找进程 top查看进程占用资源情况 明显看出java的两个进程22714,12406占用过高cpu. 2.查找线程 使用top -H -p <pid>查看线程占用情况 3. ...
- ASP.NET Core 1.0 基础与应用启动
.NET Core http://dotnet.github.io/[https://github.com/dotnet/coreclr] ASP.NET Core 1.0 https://get.a ...
- Professional C# 6 and .NET Core 1.0 - Creating Hello, World! with Visual Studio
本文为转载,学习研究 Creating Hello, World! with Visual Studio Chapter 1, “.NET Application Architectures,” ex ...
- DotNet Core 1.0 集成 CentOS 开发与运行环境部署
一. DotNet Core 1.0 开发环境部署 操作系统安装 我们使用CentOS 7.2.1511版本. 安装libunwind库 执行:sudo yum install libunwi ...
- 北京时间28号0点以后Scott Hanselman同志台宣布dotnet core 1.0 rtm
今日占住微信号头条的好消息<终于来了!微软.Net Core 1.0下载放出>.本人立马跑到官网http://dot.net看了一下,仍然是.net core 1.0 Preview 1版 ...
- centos 7 && dotnet core 2.0 && nginx && supervisor
前提 系统:centos 7 目录:/home/wwwroot/www.wuball.com dotnet core 2.0 官方指引 sudo rpm --import https://packag ...
- dotnet core 3.0 linux 部署小贴士
dotnet core 3.0 目前还是测试版,在linux下安装 sdk 需要有一些注意事项 1.下载url https://dotnet.microsoft.com/download/thank- ...
- DotNet Core 2.0使用MySql实现Code First
本教程使用vs2017 + dotnet core2.0 + MySql5.7.19 1.打开vs2017,文件>新建>项目,选择Asp.Net Core Web应用程序. 2.项目名称可 ...
- 卸载.net 5.0后使用dotnet提示Found .NET Core SDK
之前安装了预览版本的vs2019后试了下,然后卸载了.但发现控制台执行dotnet相关命令提示Found .NET Core SDK, but did not find dotnet.dll at [ ...
随机推荐
- EasyUI/TopJUI之如何动态改变下拉列表框ComboBox输入框的背景颜色
简单记录一下 前段时间接到客户需求:动态改变下拉列表框ComboBox输入框的背景颜色. 刚开始想的很简单在用户选择列表项的时候,判断一下列表框的value值添加相应的背景颜色就OK了,然而在实际操作 ...
- java中静态代码块的用法 static用法详解和static静态导入
(一)java 静态代码块 静态方法区别一般情况下,如果有些代码必须在项目启动的时候就执行的时候,需要使用静态代码块,这种代码是主动执行的;需要在项目启动的时候就初始化,在不创建对象的情况下,其他程序 ...
- PHPExcel探索之旅---阶段一
类似于Java,php也有操作Excel的方法,其中需要下载PHPExcel插件,将其中的Classes文件夹改名为PHPExcel并提取到根文件夹外面,将两个文件夹一起放在所需项目中 使用PHPEx ...
- java动态线程池LinkedBlockingQueue和SynchronousQueue比较
import java.util.concurrent.Callable; public class MyCallable implements Callable<String> { pr ...
- eclipse类自动生成注释
1.创建新类时自动生成注释 window->preference->java->code styple->code template 当你选择到这部的时候就会看 ...
- GUI的最终选择 Tkinter(五):Text用法
Text组件 绘制单行文本使用Label组件,多行选使用Listbox,输入框使用Entry,按钮使用Button组件,还有Radiobutton和Checkbutton组件用于提供单选或多选的情况, ...
- python模块之calendar方法详细介绍
calendar,是与日历相关的模块.calendar模块文件里定义了很多类型,主要有Calendar,TextCalendar以及HTMLCalendar类型.其中,Calendar是TextCal ...
- vue——解决“You may use special comments to disable some warnings. Use // eslint-disable-next-line to ignore the next line. Use /* eslint-disable */ to ignore all warnings in a file. ”
在build/webpack.base.conf.js文件中,注释或者删除掉:module->rules中有关eslint的规则 module: { rules: [ //...(config. ...
- serv-U 7以上版本pasv端口的设置及中文乱码问题
利用serv-u架设ftp服务器已经是再常见不过了事情了,近日一朋友为图新鲜,弄了个7.4版本的新玩意儿,结果架设上去后,仅开了21端口,用LeapFtp在port模式下连接没问题,但是另一常见的cu ...
- 织梦通过 phpmyadmin 导出的数据,再次导入的时候报错
错误提示: #1291 – Column 'nature' has duplicated value '婆婆妈妈' in SET SQL 查询: -- -- 导出表中的数据 `dede_member_ ...