pyplot 作图总结
折线图
下面是绘制折线图,设置图片的横轴纵轴标签,图片标题的API的用法。
import matplotlib.pyplot as pyplot

# init

pyplot.figure()

# arguments

x_label = 'X-label'

y_label = 'Y-label'

title = 'Demo-title'

# points data

x = [1, 2, 3, 4]

y = [45, 32, 46, 89]

# set arguments

pyplot.xlabel(x_label)

pyplot.ylabel(y_label)

pyplot.title(title)

# set data

pyplot.plot(x, y)

pyplot.show()
多个函数图像
import matplotlib.pyplot as pyplot

import numpy

# init

pyplot.figure()

# arguments

x_label = 'x'

y_label = 'sin(x)'

title = 'Figure-sin(x)'

# points data

# [0, 10] 区间内的 1000 个均匀分布的 x

x = numpy.linspace(0, 10, 1000)

sin_y = numpy.sin(x)

cos_y = numpy.cos(x)

# set arguments

pyplot.xlabel(x_label)

pyplot.ylabel(y_label)

pyplot.title(title)

# 设置 y 轴范围

pyplot.ylim(-1.5, 1.5)

# set data

# label, color, linewidth 是 图示 参数,用于区分多个曲线的情况

pyplot.plot(x, sin_y, label='$ sin(x) $', color='red', linewidth=1)

pyplot.plot(x, cos_y, label='$ cos(x) $', color='blue', linewidth=1)

pyplot.legend()

pyplot.show()
多个函数图像 2.0
在上述基础上进一步封装, 对 draw_arguments 进行实例化, 然后调用 draw_figure 即可.
import matplotlib.pyplot as pyplot

import numpy

import math

class draw_arguments:

    def __init__(self, func, func_name, x_domain: tuple, points_num=1000):

        super().__init__()

        self.draw_func = func

        self.func_name = func_name

        self.x_data = numpy.linspace(x_domain[0], x_domain[1], points_num)

        self.y_data = [func(x) for x in self.x_data]

def draw_figure(dargs, title='Figure', x_label='x', y_label='y'):

    # init

    pyplot.figure()

    # set arguments

    pyplot.xlabel(x_label)

    pyplot.ylabel(y_label)

    pyplot.title(title)

    # set data

    # label, color, linewidth 是 图示 参数,用于区分多个曲线的情况

    for draw in dargs:

        pyplot.plot(draw.x_data, draw.y_data, label='$' +

                    draw.func_name + '$', linewidth=1)

    pyplot.legend()

    pyplot.show()

d1 = draw_arguments(func=lambda x: 2**x,

                    func_name='2^x',

                    x_domain=(0, 5))

d2 = draw_arguments(func=lambda x: x*x,

                    func_name='x^2',

                    x_domain=(0, 5))

draw_figure([d1, d2])
绘制动画
心形曲线
提到心形曲线, 最著名的莫过于笛卡尔心形曲线, 其方程为(极坐标的形式):
\]
但我不是很想用这个.
还有一个较为著名的方程形式的心形曲线:
\]
也不是很想用, 因为这都不是函数形式.
偶然发现了一个心形曲线为:
\]
其中, \(k \ge 10\) 时, 随着 \(k\) 的增大, 函数图像会越来趋近于一个心形.
当 \(k=10\) 时:
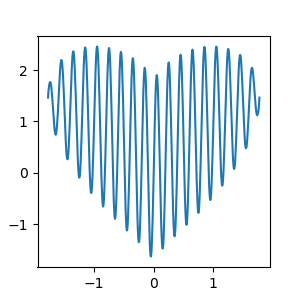
闲着没事, 用 python 做了一段动画:
import matplotlib.pyplot as pyplot

import numpy

import math

pyplot.rcParams['figure.figsize'] = (3, 3)      # 图像显示大小

pyplot.rcParams['lines.linewidth'] = 1.5        # 设置曲线线条宽度

pyplot.ion()

data = numpy.linspace(-math.sqrt(math.pi), math.sqrt(math.pi), 500)

x, y = [], []

def heart(x):

    return math.pow(x * x, 1 / 3) + math.sqrt(math.pi - x * x) * math.sin(10 * x * math.pi)

for k in data:

    x.append(k)

    y.append(heart(k))

    pyplot.clf()

    subplot = pyplot.subplot()

    pyplot.plot(x, y)

    pyplot.pause(0.0000001)

pyplot.ioff()

pyplot.show()
pyplot 作图总结的更多相关文章
- Python#常用的模块和简单用法
目录 random 随机模块 os 文件夹模块: time 时间模块: matplotlab.pyplot 作图模块 mpl_toolkits.mplot3d 绘制3D图模块 Pygame Reque ...
- Python与R的区别和联系
转自:http://bbs.pinggu.org/thread-3078817-1-1.html 有人说Python和R的区别是显而易见的,因为R是针对统计的,python是给程序员设计的,其实这话对 ...
- 6 python高级数据处理和可视化
6.2. pyplot作图 1.折线图和散点图 t = np.arange(0,4,0.1) plt.plot(t,t,'o',t,t+2,t,t**2,'o') plt.show() 2.柱线图 p ...
- Matplotlib数据可视化(1):入门介绍
1 matplot入门指南¶ matplotlib是Python科学计算中使用最多的一个可视化库,功能丰富,提供了非常多的可视化方案,基本能够满足各种场景下的数据可视化需求.但功能丰富从另一方面来 ...
- matplotlib画图实例:pyplot、pylab模块及作图參数
http://blog.csdn.net/pipisorry/article/details/40005163 Matplotlib.pyplot画图实例 {使用pyplot模块} matplotli ...
- Python: 作图
在python中实现数据的可视化,也即作图,一般是依赖matplotlib宏包实现的.但常见的代码中都是加载pylab,是不是这里写错了呀?其实pylib只是matplotlib的一个模块,只是被做成 ...
- matplotlib 入门之Pyplot tutorial
文章目录 pyplot 介绍 修饰你的图案 格式字符串 [color][marker][line] Colors Markers Line Styles 利用关键字作图(大概是数据映射到属性吧) 传入 ...
- 用matplotlib获取雅虎股票数据并作图
matplotlib有一个finance子模块提供了一个获取雅虎股票数据的api接口:quotes_historical_yahoo_ochl 感觉非常好用! 示例一 获取数据并作折线图 import ...
- 一个简单的使用matplotlib作图的例子
#使用matplotlib作图 import numpy as np import matplotlib.pyplot as plt #x = np.linspace(start, stop, num ...
随机推荐
- 能源科技,苹果和Google的新圣战?
细心的果粉可能会注意到,最新版本的IOS软体中,增加了一个不起眼的按钮,它是一款署名为"家庭"的App,之所以说它不起眼,是因为它好像真得没什么用,活跃率恐怕不及Wechat的万分 ...
- 达拉草201771010105《面向对象程序设计(java)》第十二周学习总结
达拉草201771010105<面向对象程序设计(java)>第十二周学习总结 第一部分:理论知识 Java的抽象窗口工具箱(AbstractWindow Toolkit,AWT)包含在j ...
- 达拉草201771010105《面向对象程序设计(java)》第七周学习总结
达拉草201771010105<面向对象程序设计(java)>第七周学习总结 实验七继承附加实验 实验时间 2018-10-11 1.实验目的与要求 (1)进一步理解4个成员访问权限修饰符 ...
- DataGirdView
DataGridView知识点 简单示例 (1)代码 SqlDataAdapter da; DataSet ds; string sql ="select 列名 from 表名": ...
- 7-42 jmu-python-找字符 (15 分)
输入一个字符串及字符,输出第一次出现该字符的位置. 输入格式: 行1:输入字符串 行2:输入一个字符 输出格式: 找到,输出对应位置,格式index=X的, X表示查找到位置 找不到,输出can't ...
- getUserMedia API及HTML5 调用手机摄像头拍照
getUserMedia API简介 HTML5的getUserMedia API为用户提供访问硬件设备媒体(摄像头.视频.音频.地理位置等)的接口,基于该接口,开发者可以在不依赖任何浏览器插件的条件 ...
- echarts优化数据视图dataView中的样式
在使用echart过程中,toolbox里有个dataView视图模式,里面的数据没有对整,影响展示效果,情形如下:改问题解决方案为,在optionTocontent回调函数中处理,具体代码如下: t ...
- C# 视频监控系统(提供源码分享)
去过工厂或者仓库的都知道,在工厂或仓库里面,会有很多不同的流水线,大部分的工厂或仓库,都会在不同流水线的不同工位旁边安装一台电脑,一方面便于工位上的师傅把产品的重要信息录入系统,便于公司系统数据采集分 ...
- Nginx之负载均衡配置(二)
前文我们聊到了nginx作为负载均衡的配置,前端nginx作为调度器调度http或https请求,回顾请参考https://www.cnblogs.com/qiuhom-1874/p/12458159 ...
- .Net Core 依赖注入手记
.Net Core自身提供了一套简单的DI框架,能满足我们DI基本的需求.它依赖以下组件,需要从Nuget包下拉取. Microsoft.Extensions.DependencyInjection. ...