pyplot 作图总结
折线图
下面是绘制折线图,设置图片的横轴纵轴标签,图片标题的API的用法。
import matplotlib.pyplot as pyplot

# init

pyplot.figure()

# arguments

x_label = 'X-label'

y_label = 'Y-label'

title = 'Demo-title'

# points data

x = [1, 2, 3, 4]

y = [45, 32, 46, 89]

# set arguments

pyplot.xlabel(x_label)

pyplot.ylabel(y_label)

pyplot.title(title)

# set data

pyplot.plot(x, y)

pyplot.show()
多个函数图像
import matplotlib.pyplot as pyplot

import numpy

# init

pyplot.figure()

# arguments

x_label = 'x'

y_label = 'sin(x)'

title = 'Figure-sin(x)'

# points data

# [0, 10] 区间内的 1000 个均匀分布的 x

x = numpy.linspace(0, 10, 1000)

sin_y = numpy.sin(x)

cos_y = numpy.cos(x)

# set arguments

pyplot.xlabel(x_label)

pyplot.ylabel(y_label)

pyplot.title(title)

# 设置 y 轴范围

pyplot.ylim(-1.5, 1.5)

# set data

# label, color, linewidth 是 图示 参数,用于区分多个曲线的情况

pyplot.plot(x, sin_y, label='$ sin(x) $', color='red', linewidth=1)

pyplot.plot(x, cos_y, label='$ cos(x) $', color='blue', linewidth=1)

pyplot.legend()

pyplot.show()
多个函数图像 2.0
在上述基础上进一步封装, 对 draw_arguments 进行实例化, 然后调用 draw_figure 即可.
import matplotlib.pyplot as pyplot

import numpy

import math

class draw_arguments:

    def __init__(self, func, func_name, x_domain: tuple, points_num=1000):

        super().__init__()

        self.draw_func = func

        self.func_name = func_name

        self.x_data = numpy.linspace(x_domain[0], x_domain[1], points_num)

        self.y_data = [func(x) for x in self.x_data]

def draw_figure(dargs, title='Figure', x_label='x', y_label='y'):

    # init

    pyplot.figure()

    # set arguments

    pyplot.xlabel(x_label)

    pyplot.ylabel(y_label)

    pyplot.title(title)

    # set data

    # label, color, linewidth 是 图示 参数,用于区分多个曲线的情况

    for draw in dargs:

        pyplot.plot(draw.x_data, draw.y_data, label='$' +

                    draw.func_name + '$', linewidth=1)

    pyplot.legend()

    pyplot.show()

d1 = draw_arguments(func=lambda x: 2**x,

                    func_name='2^x',

                    x_domain=(0, 5))

d2 = draw_arguments(func=lambda x: x*x,

                    func_name='x^2',

                    x_domain=(0, 5))

draw_figure([d1, d2])
绘制动画
心形曲线
提到心形曲线, 最著名的莫过于笛卡尔心形曲线, 其方程为(极坐标的形式):
\]
但我不是很想用这个.
还有一个较为著名的方程形式的心形曲线:
\]
也不是很想用, 因为这都不是函数形式.
偶然发现了一个心形曲线为:
\]
其中, \(k \ge 10\) 时, 随着 \(k\) 的增大, 函数图像会越来趋近于一个心形.
当 \(k=10\) 时:
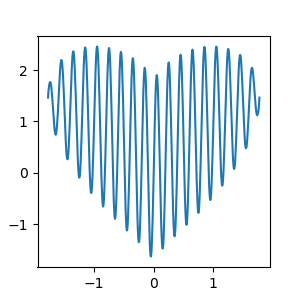
闲着没事, 用 python 做了一段动画:
import matplotlib.pyplot as pyplot

import numpy

import math

pyplot.rcParams['figure.figsize'] = (3, 3)      # 图像显示大小

pyplot.rcParams['lines.linewidth'] = 1.5        # 设置曲线线条宽度

pyplot.ion()

data = numpy.linspace(-math.sqrt(math.pi), math.sqrt(math.pi), 500)

x, y = [], []

def heart(x):

    return math.pow(x * x, 1 / 3) + math.sqrt(math.pi - x * x) * math.sin(10 * x * math.pi)

for k in data:

    x.append(k)

    y.append(heart(k))

    pyplot.clf()

    subplot = pyplot.subplot()

    pyplot.plot(x, y)

    pyplot.pause(0.0000001)

pyplot.ioff()

pyplot.show()
pyplot 作图总结的更多相关文章
- Python#常用的模块和简单用法
目录 random 随机模块 os 文件夹模块: time 时间模块: matplotlab.pyplot 作图模块 mpl_toolkits.mplot3d 绘制3D图模块 Pygame Reque ...
- Python与R的区别和联系
转自:http://bbs.pinggu.org/thread-3078817-1-1.html 有人说Python和R的区别是显而易见的,因为R是针对统计的,python是给程序员设计的,其实这话对 ...
- 6 python高级数据处理和可视化
6.2. pyplot作图 1.折线图和散点图 t = np.arange(0,4,0.1) plt.plot(t,t,'o',t,t+2,t,t**2,'o') plt.show() 2.柱线图 p ...
- Matplotlib数据可视化(1):入门介绍
1 matplot入门指南¶ matplotlib是Python科学计算中使用最多的一个可视化库,功能丰富,提供了非常多的可视化方案,基本能够满足各种场景下的数据可视化需求.但功能丰富从另一方面来 ...
- matplotlib画图实例:pyplot、pylab模块及作图參数
http://blog.csdn.net/pipisorry/article/details/40005163 Matplotlib.pyplot画图实例 {使用pyplot模块} matplotli ...
- Python: 作图
在python中实现数据的可视化,也即作图,一般是依赖matplotlib宏包实现的.但常见的代码中都是加载pylab,是不是这里写错了呀?其实pylib只是matplotlib的一个模块,只是被做成 ...
- matplotlib 入门之Pyplot tutorial
文章目录 pyplot 介绍 修饰你的图案 格式字符串 [color][marker][line] Colors Markers Line Styles 利用关键字作图(大概是数据映射到属性吧) 传入 ...
- 用matplotlib获取雅虎股票数据并作图
matplotlib有一个finance子模块提供了一个获取雅虎股票数据的api接口:quotes_historical_yahoo_ochl 感觉非常好用! 示例一 获取数据并作折线图 import ...
- 一个简单的使用matplotlib作图的例子
#使用matplotlib作图 import numpy as np import matplotlib.pyplot as plt #x = np.linspace(start, stop, num ...
随机推荐
- WiredTiger运行时参数优化
MongoDB的WiredTiger存储引擎,用了一段时间,遇到了一些问题,通过优化WT参数,也解决了一些问题,做个小结. cache_size 指定WT存储引擎内部cache的内存用量上限. 需要注 ...
- Geohash介绍
Geohash介绍 Geohash是一种地址编码,能把二维的经纬度编码成字符串,某一区域范围内的经纬度是一致的,其中有编码长度控制区域的范围 精度参考 使用场景 实时LBS应用 LBS应用中,搜索某某 ...
- IAR软件使用的快捷键配置以及配置cc2530环境
以下是我对IAR软件使用的快捷键配置cc2530以及配置环境的总结,如下图所示 弹出保存窗口 工程生成完毕——生成.c文件 快捷键ctrl+s保存.c文件 选择 ...
- 7-35 jmu-python-求三角形面积及周长 (10 分)
输入的三角形的三条边a.b.c,计算并输出面积和周长.假设输入三角形三边是合法整形数据. 三角形面积计算公式: ,其中s=(a+b+c)/2. import math #导入math库 math.s ...
- Object-Oriented Programming Summary Ⅳ
目录 UML单元总结博客 总结本单元两次作业的设计 总结自己在四个单元中架构设计以及OO方法理解的演进 总结自己在四个单元中测试理解与实践的演进 总结自己的课程收获 立足于自己的体会给课程组提三个具体 ...
- Feign 在 SpringCloud 中的使用 四
此处就单纯写一个消费者服务,通过Feign来调用生产者中的接口,生产者中的接口可以自己随便定义一个,前面博客中也有代码 1.导入springcloud Feign的jar包 <parent> ...
- js中所有函数的参数(按值和按引用)都是按值传递的,怎么理解?
我觉着我可能对这块有点误解,所以单独开个博说下自己的理解,当然是研究后的正解了. 1,参数传递是基本类型,看个例子: function addTen(num){ num += 10; return n ...
- java 发送邮件详细讲解
一.JavaMail概述: JavaMail是由Sun定义的一套收发电子邮件的API,不同的厂商可以提供自己的实现类.但它并没有包含在JDK中,而是作为JavaEE的一部分. 厂商所提供 ...
- postgreSQL外键引用查询 查询外键被那些表占用
根据一个表名,查询所有外键引用它的表,以及那些外键的列名key_column_usage(系统列信息表),pg_constraint(系统所有约束表) SELECT x.table_name, x.c ...
- DEV GridControl控件使用(CheckBox全选、操作按钮、事件处理,获取值)
1.GridControl控件使用 (1)绑定数据源 //绑定DataTable gridControl1.DataSource = DbHelper.ExecuteDataTable("S ...