Prometheus 集成 Node Exporter
文章首发于公众号《程序员果果》
地址:https://mp.weixin.qq.com/s/40ULB9UWbXVA21MxqnjBxw
简介
Prometheus 官方和一些第三方,已经把一些常用数据库、系统、中间件等的指标数据的采集做成了一个个 exporter,在生产环境中,直接导入使用就可以。 这一节,我们就用 Prometheus 官方提供的 Node Exporter 来完成对Linux系统运行数据的采集 。
实验
Node Exporter 安装及运行
在一台 Linux 机器上安装并运行 Node Exporter,我使用的是一台 ip 为 172.16.2.101 的Linux 虚拟机。
下载地址:https://github.com/prometheus/node_exporter/releases
下载并解压:
wget https://github.com/prometheus/node_exporter/releases/download/v0.18.1/node_exporter-0.18.1.linux-amd64.tar.gz

tar zxvf node_exporter-0.18.1.linux-amd64.tar.gz
进入 node_exporter-0.18.1.linux-amd64 文件夹 启动node_exporter:
./node_exporter
Prometheus 配置
在 prometheus.yml 中配置 node_exporter 的metrics 端点,内容如下:
global:

  scrape_interval: 5s

  evaluation_interval: 5s

  scrape_timeout: 5s

scrape_configs:

  - job_name: 'prometheus'

    static_configs:

    - targets: ['localhost:9090']

  - job_name: 'linux-exporter'

    metrics_path: /metrics

    static_configs:

    - targets: ['172.16.2.101:9100']
启动 prometheus:
docker run --name prometheus -d -p 9090:9090 -v /root/prometheus-data:/prometheus-data \

       prom/prometheus --web.enable-lifecycle --config.file=/prometheus-data/prometheus.yml
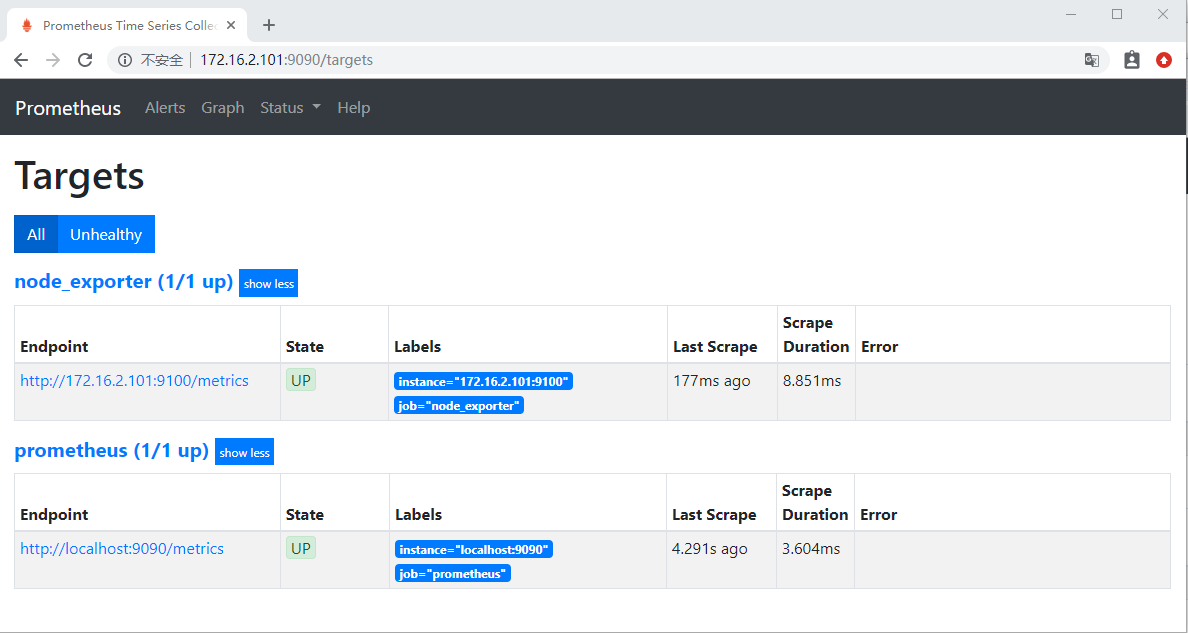
访问 http://172.16.2.101:9090/targets 发现已经出现了 target “node_exporter” ,并且为UP状态。
Grafana 导入 DashBoard
Grafana 官方和社区对已经做好了常用的 DashBoard,可以访问 https://grafana.com/grafana/dashboards 进行查询:
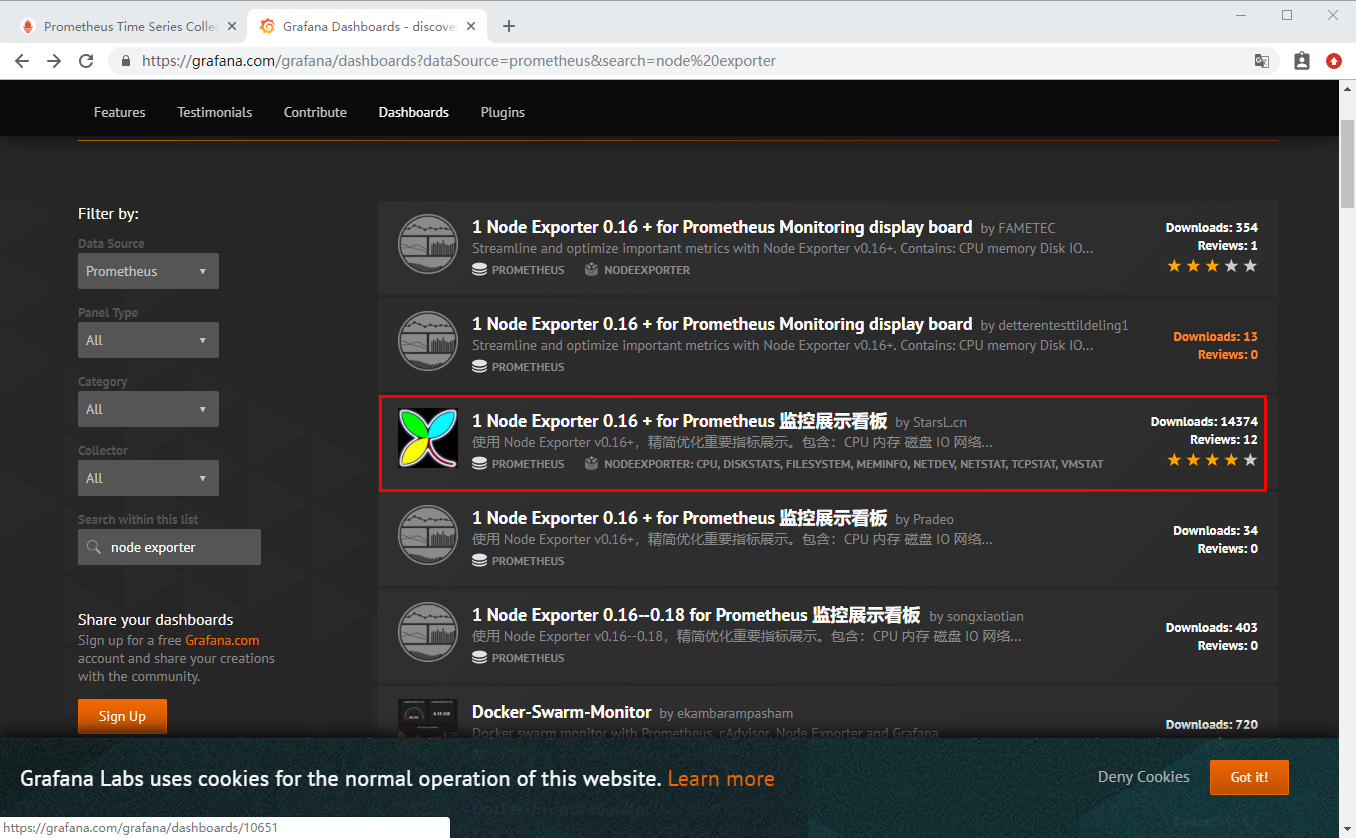
选择下载最多的,点击进去:
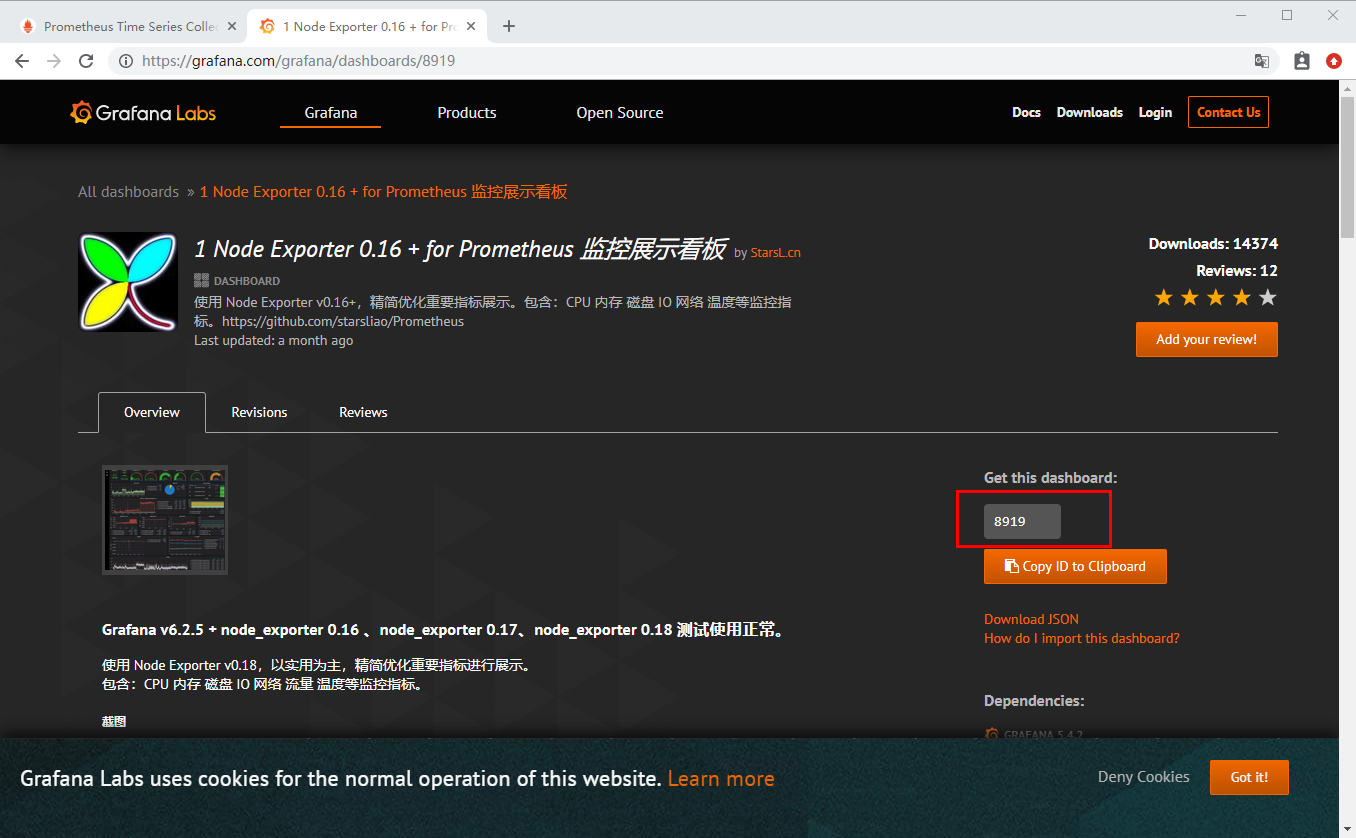
DashBoard 的 id 为 8919,后面要用到。
启动 Grafana
docker start grafana
通过Grafana的 + 图标导入(Import) Node Exporter dashboard:
- grafana id = 8919
- 注意选中prometheus数据源

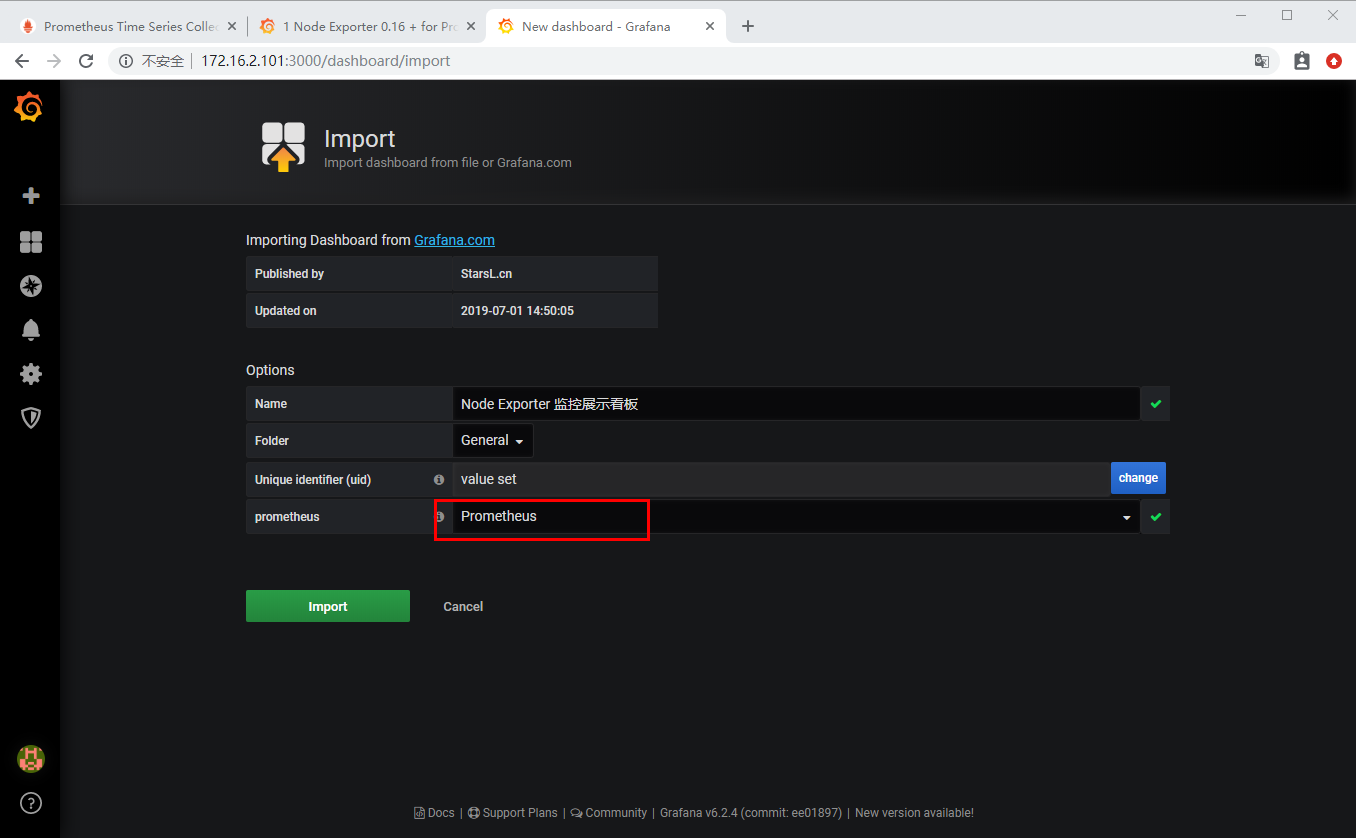
点击 "Import" 会跳转到 监控界面:
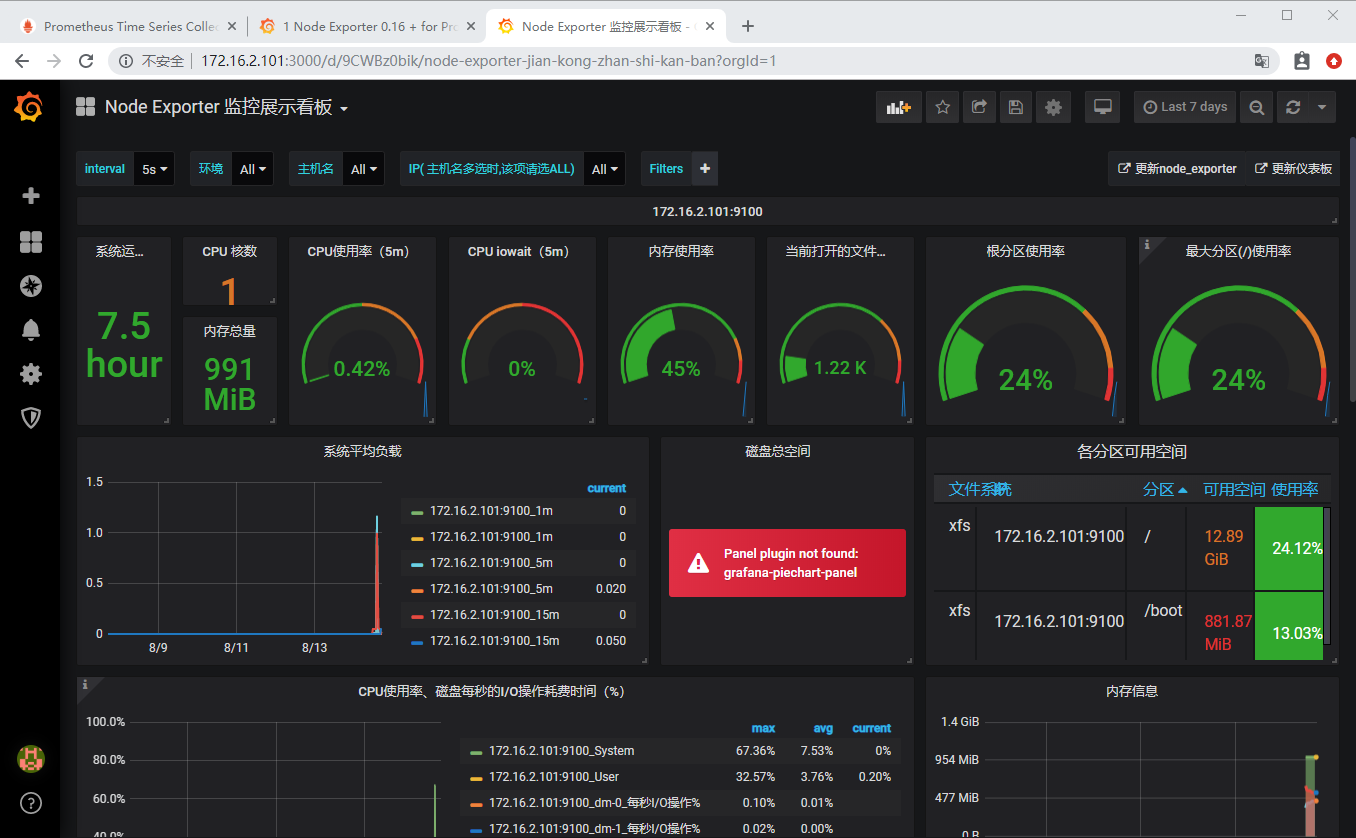
通过界面可以直观的看到 主机cpu占用率 、负载、磁盘空间、内存等信息。
总结
这一节 ,通过集成 Node Exporter 来演示了 exporter 的使用。之后你可以利用Prometheus 官方提供的其他 exporter 应用到你的学习或工作中,例如 MySQL Server Exporter 、Redis exporter 等等。
往期内容
欢迎扫码或微信搜索公众号《程序员果果》关注我,关注有惊喜~

Prometheus 集成 Node Exporter的更多相关文章
- Prometheus exporter的Node exporter是可以独立安装,用来测试的
现在慢慢在把prometheus operator的一些概念组织完整. https://github.com/coreos/prometheus-operator/tree/master/contri ...
- 【开源监控】Prometheus+Node Exporter+Grafana监控linux服务器
Prometheus Prometheus介绍 Prometheus新一代开源监控解决方案.github地址 Prometheus主要功能 多维 数据模型(时序由 metric 名字和 k/v 的 l ...
- Prometheus + Node Exporter + Grafana 监控主机运行信息
上一篇文章中讲了如何利用Prometheus和Grafana监控SpringBoot应用的JVM信息,这次就来看看如何监控 服务器运行状态,先列出用到的工具: Prometheus node_ex ...
- Prometheus 使用之 node exporter
本文使用的 Prometheus 版本为 2.22.0,node exporter 版本为 1.0.1:部署在 Linux 服务器Prometheus 是开源的监控报警系统和时序列数据库 (TSDB) ...
- Prometheus Node_exporter 之 Node Exporter
Node Exporter 1. Node Exporter Scrape Time type: GraphUnit: secondsLabel: Seconds{{collector}} - 各个收 ...
- Prometheus 安装Grafana与Prometheus集成
Prometheus 安装Grafana与Prometheus集成 Grafana是一个开源的度量分析和可视化系统. 下载地址:https://grafana.com/grafana/download ...
- Node Exporter监控指标
访问http://localhost:9100/metrics,可以看到当前node exporter获取到的当前主机的所有监控数据,如下所示: 每一个监控指标之前都会有一段类似于如下形式的信息: # ...
- node exporter
在prometheus中负责数据汇报的程序统一叫做exporter; 负责主机信息收集的node_exporter 可以利用prometheus的static_configs来拉取node_expor ...
- zeebe 集成elasticsearch exporter
zeebe 目前还在一直的开发中,同时一些变动还是挺大的,比如simple monitor 的以前是不需要配置HazelcastExporter的 估计是为了进行集群功能处理,新添加的,以前写的配置基 ...
随机推荐
- ElementUI 简要源码解析——Basic篇
Layout 布局 row 布局组件中的父组件,用于控制子组件.很简单的一个布局标签,主要通过 justify 和 align 控制子元素的对齐方式,使用 render 函数通过传入的 tag 属性控 ...
- 浅谈tomcat 、apache、 nginx的区别及优缺点
(~~排版垃圾~~,此文纪念自己18年6月所作为,如有不适合之处,请告知.) 本文主要说明tomcat .apache. nginx的定义.区别及优缺点 一. 定义: 1. Apache Apache ...
- javascript之正则表达式(二)
js正则贪婪模式与非贪婪模式 类似于贪吃蛇游戏,越吃越长.而贪婪模式就是尽可能多的匹配. 默认是贪婪模式 (尽可能多的匹配) 例子: va ...
- 程序员到sql笔记
1最近准备面试,总结一下之前学过到东西.
- java多线程总结-同步容器与并发容器的对比与介绍
1 容器集简单介绍 java.util包下面的容器集主要有两种,一种是Collection接口下面的List和Set,一种是Map, 大致结构如下: Collection List LinkedLis ...
- 个人永久性免费-Excel催化剂功能第71波-定义名称管理器维护增强
Excel使用得好坏一个分水岭之一乃是对定义名称的使用程度如何,大量合理地使用定义名称功能,对整个Excel的高级应用带来极大的便利性和日常公式函数嵌套的可读性得到很大的提升.Excel催化剂再次以插 ...
- 阿里云服务器连接以及centos 搭建 web java环境(linux java部署 tomcat部署)
版权声明:本文为博主原创文章,未经博主允许不得转载. 最近弄了个试用阿里云服务器倒腾了半天终于部署好,分享一下. 1.登入阿里云打开你申请的是云服务器的实例: 点击重置密码---重置密码后重启服务器才 ...
- Shiro权限管理框架(一):Shiro的基本使用
首发地址:https://www.guitu18.com/post/2019/07/26/43.html 核心概念 Apache Shiro是一个强大且易用的Java安全框架,执行身份验证.授权.密码 ...
- 详解iframe与frame的区别
iframe与frame的区别 一.使用iframe的优缺点 优点: 1.程序调入静态页面比较方便; 2.页面和程序分离; 缺点: 1.iframe有不好之处:样式/脚本需要额外链入,会增加请求.另外 ...
- django第四次(转自刘江)
我们都知道对于ManyToMany字段,Django采用的是第三张中间表的方式.通过这第三张表,来关联ManyToMany的双方.下面我们根据一个具体的例子,详细解说中间表的使用. 一.默认中间表 首 ...