DSP using MATLAB 示例Example3.8

代码:
x = rand(1,11); n = 0:10;
k = 0:500; w = (pi/500)*k; % [0,pi] axis divided into 501 points.
X = x * (exp(-j*pi/500)) .^ (n'*k); % DTFT of x % signal shifted by two samples
y = x; m = n + 2;
Y = y * (exp(-j*pi/500)) .^ (m'*k); % DTFT of y = x(n-2) magX = abs(X); angX = angle(X); realX = real(X); imagX = imag(X);
magY = abs(Y); angY = angle(Y); realY = real(Y); imagY = imag(Y); %verification
Y_check = (exp(-j*2) .^ w) .* X; % multiplication by exp(-j2w)
error = max(abs(Y-Y_check)); % Difference figure('NumberTitle', 'off', 'Name', 'x & y sequence')
set(gcf,'Color','white');
subplot(2,1,1); stem(n,x); title('x sequence'); xlabel('n'); ylabel('x(n)'); grid on;
subplot(2,1,2); stem(m,y); title('y sequence'); xlabel('n'); ylabel('y(n)'); grid on; %% --------------------------------------------------------------
%% START X's mag ang real imag
%% --------------------------------------------------------------
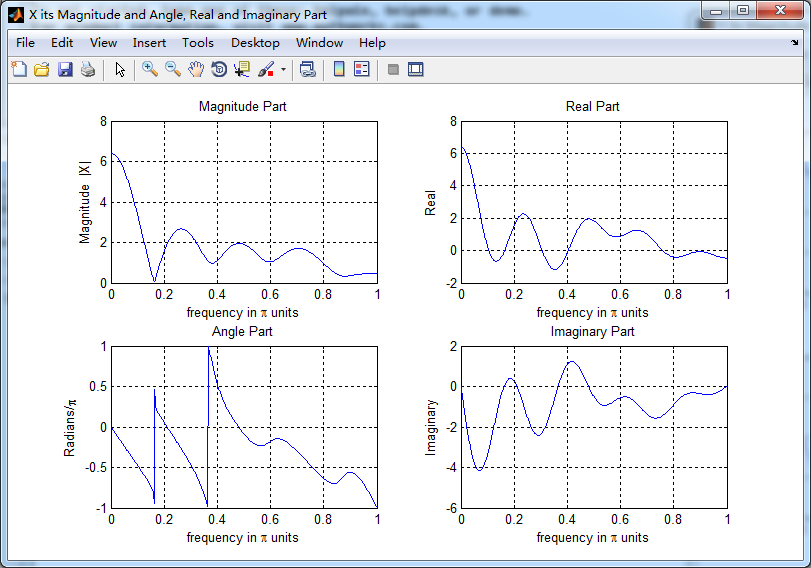
figure('NumberTitle', 'off', 'Name', 'X its Magnitude and Angle, Real and Imaginary Part');
set(gcf,'Color','white');
subplot(2,2,1); plot(w/pi,magX); grid on; % axis([-2,2,0,15]);
title('Magnitude Part');
xlabel('frequency in \pi units'); ylabel('Magnitude |X|');
subplot(2,2,3); plot(w/pi, angX/pi); grid on; % axis([-2,2,-1,1]);
title('Angle Part');
xlabel('frequency in \pi units'); ylabel('Radians/\pi'); subplot('2,2,2'); plot(w/pi, realX); grid on;
title('Real Part');
xlabel('frequency in \pi units'); ylabel('Real');
subplot('2,2,4'); plot(w/pi, imagX); grid on;
title('Imaginary Part');
xlabel('frequency in \pi units'); ylabel('Imaginary');
%% --------------------------------------------------------------
%% END X's mag ang real imag
%% -------------------------------------------------------------- %% --------------------------------------------------------------
%% START Y's mag ang real imag
%% --------------------------------------------------------------
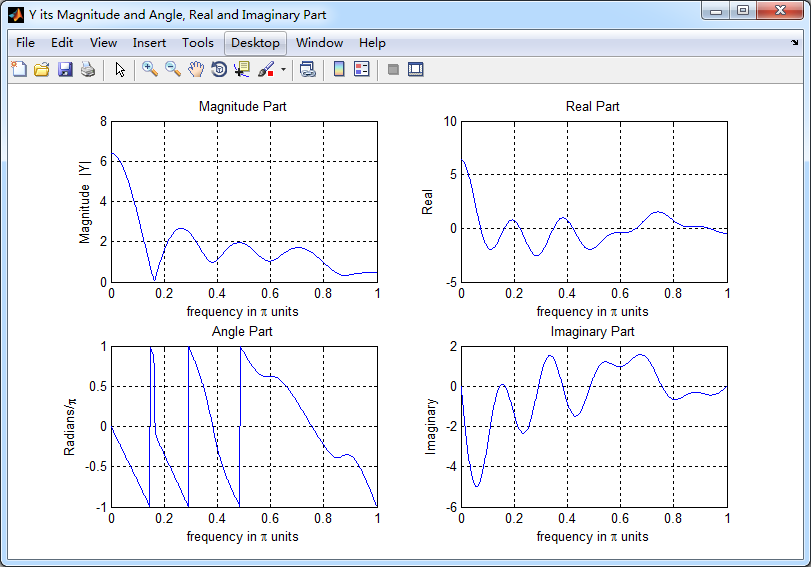
figure('NumberTitle', 'off', 'Name', 'Y its Magnitude and Angle, Real and Imaginary Part');
set(gcf,'Color','white');
subplot(2,2,1); plot(w/pi,magY); grid on; % axis([-2,2,0,15]);
title('Magnitude Part');
xlabel('frequency in \pi units'); ylabel('Magnitude |Y|');
subplot(2,2,3); plot(w/pi, angY/pi); grid on; % axis([-2,2,-1,1]);
title('Angle Part');
xlabel('frequency in \pi units'); ylabel('Radians/\pi'); subplot('2,2,2'); plot(w/pi, realY); grid on;
title('Real Part');
xlabel('frequency in \pi units'); ylabel('Real');
subplot('2,2,4'); plot(w/pi, imagY); grid on;
title('Imaginary Part');
xlabel('frequency in \pi units'); ylabel('Imaginary'); %% --------------------------------------------------------------
%% END Y's mag ang real imag
%% --------------------------------------------------------------
运行结果:


DSP using MATLAB 示例Example3.8的更多相关文章
- DSP using MATLAB 示例Example3.21
代码: % Discrete-time Signal x1(n) % Ts = 0.0002; n = -25:1:25; nTs = n*Ts; Fs = 1/Ts; x = exp(-1000*a ...
- DSP using MATLAB 示例 Example3.19
代码: % Analog Signal Dt = 0.00005; t = -0.005:Dt:0.005; xa = exp(-1000*abs(t)); % Discrete-time Signa ...
- DSP using MATLAB示例Example3.18
代码: % Analog Signal Dt = 0.00005; t = -0.005:Dt:0.005; xa = exp(-1000*abs(t)); % Continuous-time Fou ...
- DSP using MATLAB 示例Example3.23
代码: % Discrete-time Signal x1(n) : Ts = 0.0002 Ts = 0.0002; n = -25:1:25; nTs = n*Ts; x1 = exp(-1000 ...
- DSP using MATLAB示例Example3.16
代码: b = [0.0181, 0.0543, 0.0543, 0.0181]; % filter coefficient array b a = [1.0000, -1.7600, 1.1829, ...
- DSP using MATLAB 示例Example3.22
代码: % Discrete-time Signal x2(n) Ts = 0.001; n = -5:1:5; nTs = n*Ts; Fs = 1/Ts; x = exp(-1000*abs(nT ...
- DSP using MATLAB 示例Example3.17
- DSP using MATLAB 示例 Example3.15
上代码: subplot(1,1,1); b = 1; a = [1, -0.8]; n = [0:100]; x = cos(0.05*pi*n); y = filter(b,a,x); figur ...
- DSP using MATLAB 示例 Example3.13
上代码: w = [0:1:500]*pi/500; % freqency between 0 and +pi, [0,pi] axis divided into 501 points. H = ex ...
- DSP using MATLAB 示例 Example3.12
用到的性质 代码: n = -5:10; x = sin(pi*n/2); k = -100:100; w = (pi/100)*k; % freqency between -pi and +pi , ...
随机推荐
- 【leetcode】Count and Say (easy)
The count-and-say sequence is the sequence of integers beginning as follows:1, 11, 21, 1211, 111221, ...
- s:iterator,s:if与OGNL的嵌套使用
今天在写代码时,遇到个如下问题,要求当前登陆用户的id与系统参数类型代码所属维护人的id相同时,显示单选框.如下效果: 代码如下: <s:iterator value="vo.page ...
- 【XLL API 函数】xlSet
快速的将常数值放入到单元格区域中. 原型 Excel12(xlSet, LPXLOPER12 pxRes, 2, LPXLOPER12 pxReference,LPXLOPER pxValue); 参 ...
- php原型模式的研究
<?php class Sea{} class EarthSea extends Sea{} class MarsSea extends Sea{} class Plains{} class E ...
- 118. Pascal's Triangle
题目: Given numRows, generate the first numRows of Pascal's triangle. For example, given numRows = 5, ...
- WaxPatch中demo注意问题
问题一 https://github.com/mmin18/WaxPatch网址中提供的demo是可以运行,但是存在一个问题,如果把patch.zip换成自己的并且上传到自己的服务器(github), ...
- python基础——访问限制
python基础——访问限制 在Class内部,可以有属性和方法,而外部代码可以通过直接调用实例变量的方法来操作数据,这样,就隐藏了内部的复杂逻辑. 但是,从前面Student类的定义来看,外部代码还 ...
- 方法重载的小demo
方法的重载(overload)要求:1,同一个类中2,方法名必须相同3,方法的参数列表不同(1,参数的个数不同2,参数类型不同,但是参数名相同) 注:方法的重载与方法的返回值类型没有关系 packag ...
- ios中通过调试来使用私有api
转自:http://blog.csdn.net/cubepeng/article/details/11284173 OS不允许使用ios私有api,使用私有api可以获得意想不到的效果 ,同时使用私有 ...
- 一个TextView内显示不同颜色的文字
String format = "<font color='#FC8262'>%s</font>:%s"; String text = String.for ...