
基于ELK5.1(ElasticSearch, Logstash, Kibana)的一次整合测试
前言
开源实时日志分析ELK平台(ElasticSearch, Logstash, Kibana组成),能很方便的帮我们收集日志,进行集中化的管理,并且能很方便的进行日志的统计和检索,下面基于ELK的最新版本5.1进行一次整合测试。
ElasticSearch
1.概述:
ElasticSearch是一个高可扩展的开源的全文搜索分析引擎。它允许你快速的存储、搜索和分析大量数据。ElasticSearch通常作为后端程序,为需要复杂查询的应用提供服务。
Elasticsearch是一个基于Lucene的开源分布式搜索引擎,具有分布式多用户能力。Elasticsearch是用java开发,提供Restful接口,能够达到实时搜索、高性能计算;同时Elasticsearch的横向扩展能力非常强,不需要重启服务,基本上达到了零配置。
2.解压ElasticSearch并进入目录:
unzip elasticsearch-5.1.1.zip

cd elasticsearch-5.1.1
3.启动ElasticSearch服务:
./bin/elasticsearch因为这里使用的是root账号进行启动服务的,所以会报如下错误:
        at org.elasticsearch.bootstrap.Elasticsearch.init(Elasticsearch.java:125) ~[elasticsearch-5.1.1.jar:5.1.1]

        at org.elasticsearch.bootstrap.Elasticsearch.execute(Elasticsearch.java:112) ~[elasticsearch-5.1.1.jar:5.1.1]

        at org.elasticsearch.cli.SettingCommand.execute(SettingCommand.java:54) ~[elasticsearch-5.1.1.jar:5.1.1]

        at org.elasticsearch.cli.Command.mainWithoutErrorHandling(Command.java:96) ~[elasticsearch-5.1.1.jar:5.1.1]

        at org.elasticsearch.cli.Command.main(Command.java:62) ~[elasticsearch-5.1.1.jar:5.1.1]

        at org.elasticsearch.bootstrap.Elasticsearch.main(Elasticsearch.java:89) ~[elasticsearch-5.1.1.jar:5.1.1]

        at org.elasticsearch.bootstrap.Elasticsearch.main(Elasticsearch.java:82) ~[elasticsearch-5.1.1.jar:5.1.1]

Caused by: java.lang.RuntimeException: can not run elasticsearch as root

        at org.elasticsearch.bootstrap.Bootstrap.initializeNatives(Bootstrap.java:100) ~[elasticsearch-5.1.1.jar:5.1.1]

        at org.elasticsearch.bootstrap.Bootstrap.setup(Bootstrap.java:176) ~[elasticsearch-5.1.1.jar:5.1.1]

        at org.elasticsearch.bootstrap.Bootstrap.init(Bootstrap.java:306) ~[elasticsearch-5.1.1.jar:5.1.1]

        at org.elasticsearch.bootstrap.Elasticsearch.init(Elasticsearch.java:121) ~[elasticsearch-5.1.1.jar:5.1.1]

... 6 more错误很明显,不能以root账号来运行elasticsearch,网上有一种解决方法是添加es.insecure.allow.root=true参数,启动方式如下:
./bin/elasticsearch -Des.insecure.allow.root=true启动日志如下所示:
starts elasticsearch

Option                Description

------                -----------

-E <KeyValuePair>     Configure a setting

-V, --version         Prints elasticsearch version information and exits

-d, --daemonize       Starts Elasticsearch in the background

-h, --help            show help

-p, --pidfile <Path>  Creates a pid file in the specified path on start

-q, --quiet           Turns off standard ouput/error streams logging in console

-s, --silent          show minimal output

-v, --verbose         show verbose output

ERROR: D is not a recognized option
并没有启动成功,但是试了一下在elasticsearch-2.1.1这个版本是可以成功的,官方网站的Issues也给出了说明:
In 5.0.0-alpha3, all of this has been cleaned up.

The entanglement between system properties and settings has beenremoved.

This means that the system property es.insecure.allow.root will not automatically

be converted to a setting which means it's no longer a problem that it's not registered.
更加详细的介绍https://github.com/elastic/elasticsearch/issues/18688
这是出于系统安全考虑设置的条件。由于ElasticSearch可以接收用户输入的脚本并且执行,为了系统安全考虑,建议创建一个单独的用户用来运行ElasticSearch。
4.创建用户组和用户:
groupadd esgroup

useradd esuser -g esgroup -p espassword
更改elasticsearch文件夹及内部文件的所属用户及组:
cd /opt/elk

chown -R esuser:esgroup elasticsearch-5.1.1
切换用户并运行:
su esuser

./bin/elasticsearch
启动日志如下所示:
[esuser@localhost elasticsearch-5.1.1]$ ./bin/elasticsearch

[2017-01-13T11:18:35,020][INFO ][o.e.n.Node               ] [] initializing ...

[2017-01-13T11:18:35,284][INFO ][o.e.e.NodeEnvironment    ] [rBrMTNx] using [1] data paths, mounts [[/ (rootfs)]], net usable_space [21.6gb], net total_space [27.4gb], spins? [unknown], types [rootfs]

[2017-01-13T11:18:35,284][INFO ][o.e.e.NodeEnvironment    ] [rBrMTNx] heap size [1.9gb], compressed ordinary object pointers [true]

[2017-01-13T11:18:35,285][INFO ][o.e.n.Node               ] node name [rBrMTNx] derived from node ID [rBrMTNxCSEehQsfjvxmSgw]; set [node.name] to override

[2017-01-13T11:18:35,308][INFO ][o.e.n.Node               ] version[5.1.1], pid[2612], build[5395e21/2016-12-06T12:36:15.409Z], OS[Linux/3.10.0-327.el7.x86_64/amd64], JVM[Oracle Corporation/Java HotSpot(TM) 64-Bit Server VM/1.8.0_112/25.112-b15]

[2017-01-13T11:18:38,284][INFO ][o.e.p.PluginsService     ] [rBrMTNx] loaded module [aggs-matrix-stats]

[2017-01-13T11:18:38,285][INFO ][o.e.p.PluginsService     ] [rBrMTNx] loaded module [ingest-common]

[2017-01-13T11:18:38,285][INFO ][o.e.p.PluginsService     ] [rBrMTNx] loaded module [lang-expression]

[2017-01-13T11:18:38,285][INFO ][o.e.p.PluginsService     ] [rBrMTNx] loaded module [lang-groovy]

[2017-01-13T11:18:38,285][INFO ][o.e.p.PluginsService     ] [rBrMTNx] loaded module [lang-mustache]

[2017-01-13T11:18:38,285][INFO ][o.e.p.PluginsService     ] [rBrMTNx] loaded module [lang-painless]

[2017-01-13T11:18:38,285][INFO ][o.e.p.PluginsService     ] [rBrMTNx] loaded module [percolator]

[2017-01-13T11:18:38,285][INFO ][o.e.p.PluginsService     ] [rBrMTNx] loaded module [reindex]

[2017-01-13T11:18:38,285][INFO ][o.e.p.PluginsService     ] [rBrMTNx] loaded module [transport-netty3]

[2017-01-13T11:18:38,285][INFO ][o.e.p.PluginsService     ] [rBrMTNx] loaded module [transport-netty4]

[2017-01-13T11:18:38,286][INFO ][o.e.p.PluginsService     ] [rBrMTNx] no plugins loaded

[2017-01-13T11:18:44,427][INFO ][o.e.n.Node               ] initialized

[2017-01-13T11:18:44,441][INFO ][o.e.n.Node               ] [rBrMTNx] starting ...

[2017-01-13T11:18:44,943][INFO ][o.e.t.TransportService   ] [rBrMTNx] publish_address {127.0.0.1:9300}, bound_addresses {[::1]:9300}, {127.0.0.1:9300}

[2017-01-13T11:18:44,976][WARN ][o.e.b.BootstrapCheck     ] [rBrMTNx] max file descriptors [4096] for elasticsearch process is too low, increase to at least [65536]

[2017-01-13T11:18:44,976][WARN ][o.e.b.BootstrapCheck     ] [rBrMTNx] max virtual memory areas vm.max_map_count [65530] is too low, increase to at least [262144]

[2017-01-13T11:18:48,633][INFO ][o.e.c.s.ClusterService   ] [rBrMTNx] new_master {rBrMTNx}{rBrMTNxCSEehQsfjvxmSgw}{N9FXgAA5TjC78HBimEJ9kw}{127.0.0.1}{127.0.0.1:9300}, reason: zen-disco-elected-as-master ([0] nodes joined)

[2017-01-13T11:18:48,762][INFO ][o.e.g.GatewayService     ] [rBrMTNx] recovered [0] indices into cluster_state

[2017-01-13T11:18:48,775][INFO ][o.e.h.HttpServer         ] [rBrMTNx] publish_address {127.0.0.1:9200}, bound_addresses {[::1]:9200}, {127.0.0.1:9200}

[2017-01-13T11:18:48,775][INFO ][o.e.n.Node               ] [rBrMTNx] started
日志中启动了两个端口分别是:9300和9200,9300用于跟其他的节点的传输,9200用于接受HTTP请求,ctrl+c可以结束进程
5.后台运行:
./bin/elasticsearch -d6.简单连接:
curl 127.0.0.1:9200结果如下所示:
[root@localhost ~]# curl 127.0.0.1:9200

{

  "name" : "rBrMTNx",

  "cluster_name" : "elasticsearch",

  "cluster_uuid" : "-noR5DxFRsyvAFvAzxl07g",

  "version" : {

    "number" : "5.1.1",

    "build_hash" : "5395e21",

    "build_date" : "2016-12-06T12:36:15.409Z",

    "build_snapshot" : false,

    "lucene_version" : "6.3.0"

  },

  "tagline" : "You Know, for Search"

}
7.因为elasticsearch安装在虚拟机里面,我希望我的主机也可以访问,需要对config/elasticsearch.yml进行配置:
network.host: 192.168.111.131192.168.111.131是虚拟机里面的地址,修改完之后重新启动,会出现如下错误日志:
ERROR: bootstrap checks failed

max file descriptors [4096] for elasticsearch process is too low, increase to at least [65536]

max virtual memory areas vm.max_map_count [65530] is too low, increase to at least [262144]
解决办法:
切换到root用户,修改配置limits.conf
vi /etc/security/limits.conf 添加如下内容:
* soft nofile 65536

* hard nofile 131072

* soft nproc 2048

* hard nproc 4096
修改配置sysctl.conf
vi /etc/sysctl.conf 添加如下内容:
vm.max_map_count=655360更加详细的参考:Elasticsearch5.0 安装问题集锦
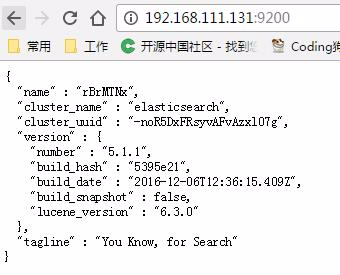
修改完之后重启服务,并在本地浏览器中进行访问,结果如下图所示:
8.停止服务:
ps -ef |grep elasticsearch

kill PID
Logstash
Logstash是一个完全开源的工具,可以对你的日志进行收集、过滤,并将其存储供以后使用,参考官网的介绍图:

1.解压进入目录
tar -zxvf logstash-5.1.1.tar.gz

cd logstash-5.1.1
2.添加配置文件
vi config/first-pipeline.conf添加如下内容:
input {

  log4j {

    host => "192.168.111.131"

    port => 8801

  }

}

output {

    elasticsearch {

        hosts => [ "192.168.111.131:9200" ]

    }

}
3.启动服务
./bin/logstash -f config/first-pipeline.conf启动成功日志如下:
Sending Logstash's logs to /opt/elk/logstash-5.1.1/logs which is now configured via log4j2.properties

[2017-01-17T11:41:42,978][INFO ][logstash.inputs.log4j    ] Starting Log4j input listener {:address=>"192.168.111.131:8801"}

[2017-01-17T11:41:43,565][INFO ][logstash.inputs.log4j    ] Log4j input

[2017-01-17T11:41:45,658][INFO ][logstash.outputs.elasticsearch] Elasticsearch pool URLs updated {:changes=>{:removed=>[], :added=>["http://192.168.111.131:9200"]}}

[2017-01-17T11:41:45,659][INFO ][logstash.outputs.elasticsearch] Running health check to see if an Elasticsearch connection is working {:url=>#<URI::HTTP:0x3a685472 URL:http://192.168.111.131:9200>, :healthcheck_path=>"/"}

log4j:WARN No appenders could be found for logger (org.apache.http.client.protocol.RequestAuthCache).

log4j:WARN Please initialize the log4j system properly.

log4j:WARN See http://logging.apache.org/log4j/1.2/faq.html#noconfig for more info.

[2017-01-17T11:41:46,090][WARN ][logstash.outputs.elasticsearch] Restored connection to ES instance {:url=>#<URI::HTTP:0x3a685472 URL:http://192.168.111.131:9200>}

[2017-01-17T11:41:46,115][INFO ][logstash.outputs.elasticsearch] Using mapping template from {:path=>nil}

[2017-01-17T11:41:46,357][INFO ][logstash.outputs.elasticsearch] Attempting to install template {:manage_template=>{"template"=>"logstash-*", "version"=>50001, "settings"=>{"index.refresh_interval"=>"5s"}, "mappings"=>{"_default_"=>{"_all"=>{"enabled"=>true, "norms"=>false}, "dynamic_templates"=>[{"message_field"=>{"path_match"=>"message", "match_mapping_type"=>"string", "mapping"=>{"type"=>"text", "norms"=>false}}}, {"string_fields"=>{"match"=>"*", "match_mapping_type"=>"string", "mapping"=>{"type"=>"text", "norms"=>false, "fields"=>{"keyword"=>{"type"=>"keyword"}}}}}], "properties"=>{"@timestamp"=>{"type"=>"date", "include_in_all"=>false}, "@version"=>{"type"=>"keyword", "include_in_all"=>false}, "geoip"=>{"dynamic"=>true, "properties"=>{"ip"=>{"type"=>"ip"}, "location"=>{"type"=>"geo_point"}, "latitude"=>{"type"=>"half_float"}, "longitude"=>{"type"=>"half_float"}}}}}}}}

[2017-01-17T11:41:46,474][INFO ][logstash.outputs.elasticsearch] New Elasticsearch output {:class=>"LogStash::Outputs::ElasticSearch", :hosts=>["192.168.111.131:9200"]}

[2017-01-17T11:41:46,495][INFO ][logstash.pipeline        ] Starting pipeline {"id"=>"main", "pipeline.workers"=>1, "pipeline.batch.size"=>125, "pipeline.batch.delay"=>5, "pipeline.max_inflight"=>125}

[2017-01-17T11:41:46,514][INFO ][logstash.pipeline        ] Pipeline main started

[2017-01-17T11:41:46,935][INFO ][logstash.agent           ] Successfully started Logstash API endpoint {:port=>9600}
New Elasticsearch output {:class=>”LogStash::Outputs::ElasticSearch”, :hosts=>[“192.168.111.131:9200”]}表示已经成功连接了指定的Elasticsearch。
Kibana
Kibana可以为Logstash和ElasticSearch提供的日志分析友好的Web界面,可以帮助您汇总、分析和搜索重要数据日志。
1.解压进入目录
tar -zxvf kibana-5.1.1-linux-x86_64.tar.gz

cd kibana-5.1.1-linux-x86_64
2.修改配置文件
vi config/kibana.yml添加如下配置项:
server.port: 5601

server.host: "192.168.111.130"

elasticsearch.url: "http://192.168.111.131:9200"

kibana.index: ".kibana"
3.启动服务
./bin/kibana启动成功日志如下:
log   [16:42:01.349] [info][status][plugin:kibana@5.1.1] Status changed from uninitialized to green - Ready

log   [16:42:01.406] [info][status][plugin:elasticsearch@5.1.1] Status changed from uninitialized to yellow - Waiting for Elasticsearch

log   [16:42:01.427] [info][status][plugin:console@5.1.1] Status changed from uninitialized to green - Ready

log   [16:42:01.567] [info][status][plugin:timelion@5.1.1] Status changed from uninitialized to green - Ready

log   [16:42:01.574] [info][listening] Server running at http://192.168.111.130:5601
4.浏览器访问
http://192.168.111.130:5601/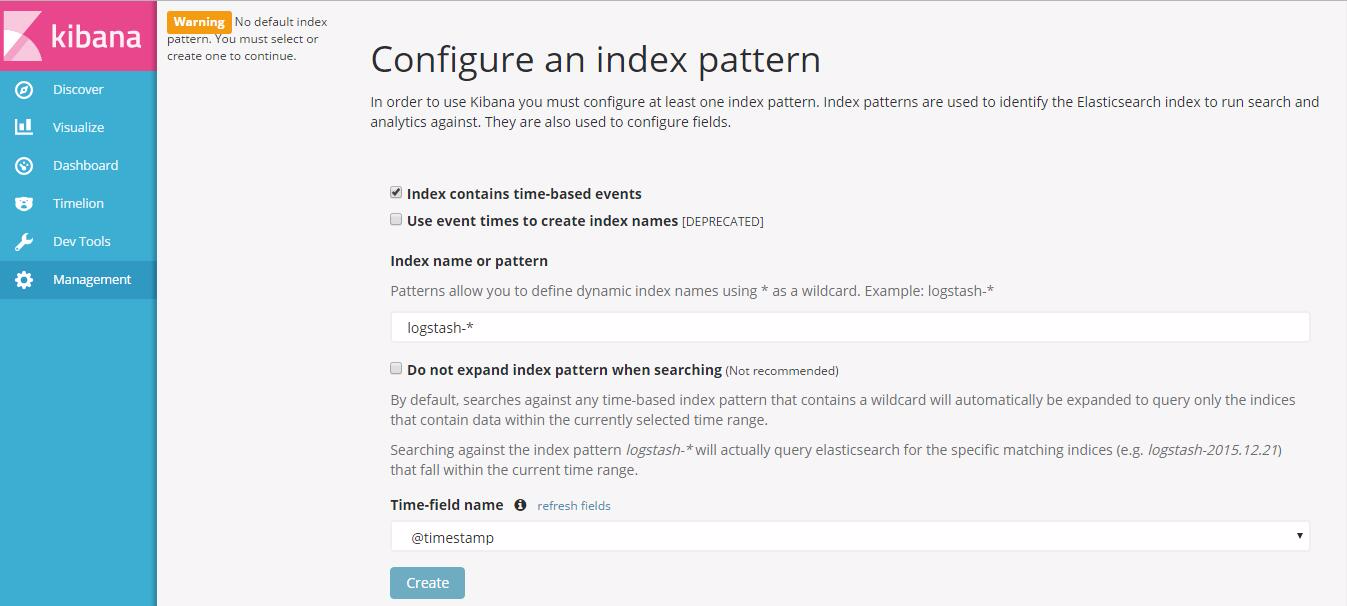
默认第一次需要Configure an index pattern,默认的Index name是logstash-*,直接create就行了。
测试
1.准备一个测试工程,往logstash写数据,同时通过kibana查看数据
log4j maven
<dependency>

    <groupId>log4j</groupId>

    <artifactId>log4j</artifactId>

    <version>1.2.17</version>

</dependency>
log4j.properties
log4j.rootLogger=DEBUG, logstash

log4j.appender.logstash=org.apache.log4j.net.SocketAppender

log4j.appender.logstash.Port=8801

log4j.appender.logstash.RemoteHost=192.168.111.131

log4j.appender.logstash.ReconnectionDelay=60000

log4j.appender.logstash.LocationInfo=true
测试类App
import org.apache.log4j.Logger;

public class App {

    private static final Logger LOGGER = Logger.getLogger(App.class);

    public static void main(String[] args) throws Exception {

        for (int i = 0; i < 1000; i++) {

            LOGGER.info("Test [" + i + "]");

        }

    }

}
运行App,会出现如下错误:
SocketException: Software caused connection abort: socket write error解决方法:
vi logstash-core/lib/logstash-core_jars.rb注释掉#require_jar( ‘org.apache.logging.log4j’, ‘log4j-1.2-api’, ‘2.6.2’ ),然后重启logstash
2.kibana查看数据
点击Discover,然后指定好日期,就可以查看刚刚log4j发送的日志了,如下图所示:
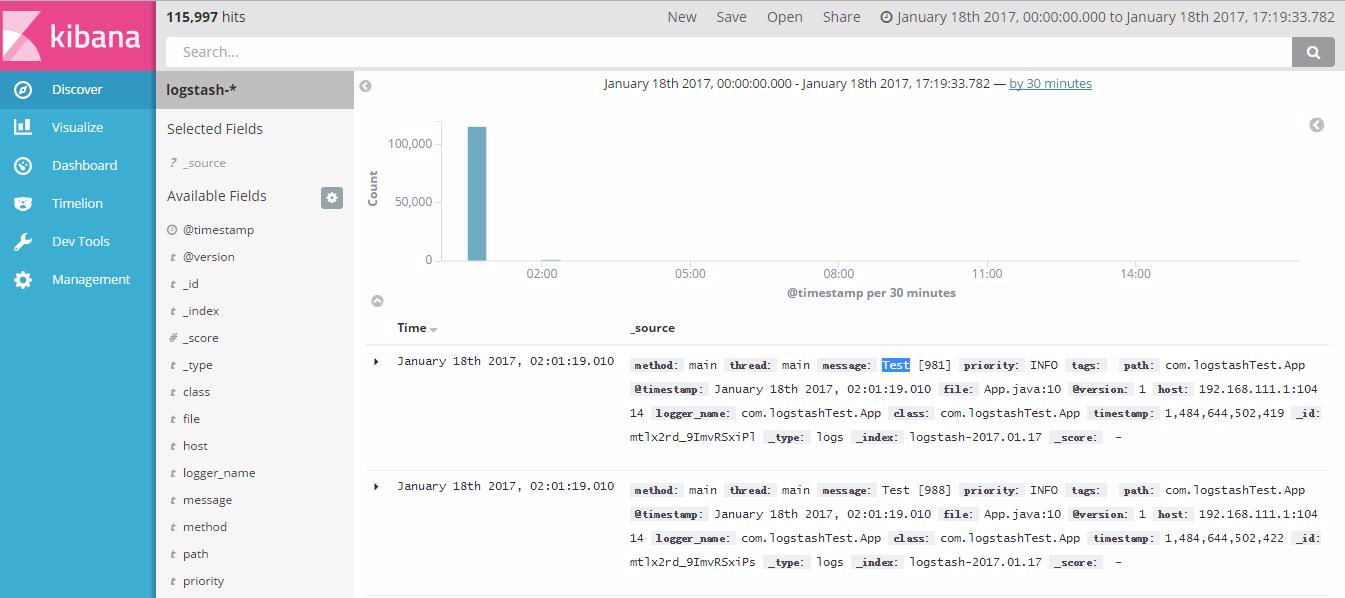
可以指定关键字进行搜索,指定时间范围,指定刷新间隔时间等,更多的功能可以自行去摸索
基于ELK5.1(ElasticSearch, Logstash, Kibana)的一次整合测试的更多相关文章
- 基于ELK5.1(ElasticSearch, Logstash, Kibana)的一次整合
前言开源实时日志分析ELK平台(ElasticSearch, Logstash, Kibana组成),能很方便的帮我们收集日志,进行集中化的管理,并且能很方便的进行日志的统计和检索,下面基于ELK的最 ...
- 基于CentOS6.5或Ubuntu14.04下Suricata里搭配安装 ELK (elasticsearch, logstash, kibana)(图文详解)
前期博客 基于CentOS6.5下Suricata(一款高性能的网络IDS.IPS和网络安全监控引擎)的搭建(图文详解)(博主推荐) 基于Ubuntu14.04下Suricata(一款高性能的网络ID ...
- 【转】ELK(ElasticSearch, Logstash, Kibana)搭建实时日志分析平台
[转自]https://my.oschina.net/itblog/blog/547250 摘要: 前段时间研究的Log4j+Kafka中,有人建议把Kafka收集到的日志存放于ES(ElasticS ...
- ELk(Elasticsearch, Logstash, Kibana)的安装配置
目录 ELk(Elasticsearch, Logstash, Kibana)的安装配置 1. Elasticsearch的安装-官网 2. Kibana的安装配置-官网 3. Logstash的安装 ...
- ELK6.0部署:Elasticsearch+Logstash+Kibana搭建分布式日志平台
一.前言 1.ELK简介 ELK是Elasticsearch+Logstash+Kibana的简称 ElasticSearch是一个基于Lucene的分布式全文搜索引擎,提供 RESTful API进 ...
- 【Big Data - ELK】ELK(ElasticSearch, Logstash, Kibana)搭建实时日志分析平台
摘要: 前段时间研究的Log4j+Kafka中,有人建议把Kafka收集到的日志存放于ES(ElasticSearch,一款基于Apache Lucene的开源分布式搜索引擎)中便于查找和分析,在研究 ...
- ELKF安装使用教程。elasticsearch+logstash+kibana+filebeta。
近期因工作需要学习了ELKF的安装和使用.网络上的中文我看大部分也比较老版本了,我想写一下,希望能给他人带来一点帮助.小弟不才,有错位之处,还请大家原谅指点. ELKF就是:elasticsearch ...
- ELK (Elasticsearch , Logstash, Kibana [+FileBeat])
ELK 简述: ELK 是: Elasticsearch , Logstash, Kibana 简称, 它们都是开源软件. Elasticsearch[搜索]是个开源分布式基于Lucene的搜索引擎, ...
- Elasticsearch+Logstash+Kibana搭建分布式日志平台
一.前言 编译安装 1.ELK简介 下载相关安装包地址:https://www.elastic.co/cn/downloads ELK是Elasticsearch+Logstash+Kibana的简称 ...
随机推荐
- c程序的编译
linux系统下采用gcc进行编译,而在aix系统下采用xlc 进行编译. 附上aix安装xlc地址:https://www.ibm.com/developerworks/cn/aix/library ...
- JeeSite
JeeSite是一个 开源的企业信息管理系统 基础框架.主要定位于"企业信息管理"领域,可用作企业信息管理类系统.网站后台管理类系统等.JeeSite是非常强调开发的高效性.健壮性 ...
- mysql 带条件的sum/count 使用技巧
本测试只是简单测试,其用途不在于代替count函数配合where函数进行聚合计算,而是在复杂查询中在sum/count中加入条件,一次性求出不同条件下的聚合结果. 1.插入测试数据如图 2.sum计算 ...
- mysql distinct field1,field2,field3, .... from table
mysql distinct field1,field2,field3, .... from table 我们知道 这样的sql可以去掉重复项 (field1的重复项); select distinc ...
- CentOS7安装codeblocks(转载)
1.安装gcc,需要c和c++两部分,默认安装下,CentOS不安装编译器的,在终端输入以下命令即可 yum install gccyum install gcc-c++ 2.安装gtk2-devel ...
- Kapacitor之TICK脚本,监控输出
好久没更新博客园了,说来也惭愧,之前说好每隔几天更新一个的,虽然没什么人看,但是作为一个记录,回顾也是能有新的认识,这篇博客是讲的目前我在工作中使用的一个结束点,这个技术点目前网上资料少之甚少,也是希 ...
- JavaScript要点汇总——The Most Important
关于JavaScript的基础变量,运算符的详解以及基本的分支循环嵌套已经在 JS基础变量及JS中的运算符 JS中的循环分支嵌套 说过了,今天我们所说的是做网页中最长用到的东西.内容不算少,要有耐心, ...
- 在Ubuntu系统安装Sencha CMD
Now type from the terminal prompt followed by Enter: 1 root@prompt:cd /java 1 root@prompt:tar zx ...
- php 微信JS-SDK封装类
JSSDK使用步骤: 步骤一:绑定域名 步骤二:引入JS文件 步骤三:通过config接口注入权限验证配置 步骤四:通过ready接口处理成功验证 步骤五:通过error接口处理失败验证 具体步骤方法 ...
- Python《学习手册:第一章-习题》
人们选择Python的六大主要原因是什么? 软件质量:Python注重可读性.一致性和软件质量. Python代码的设计致力于可读性,因此具备了比传统脚本语言更优秀的可重用性和可维护性. Python ...