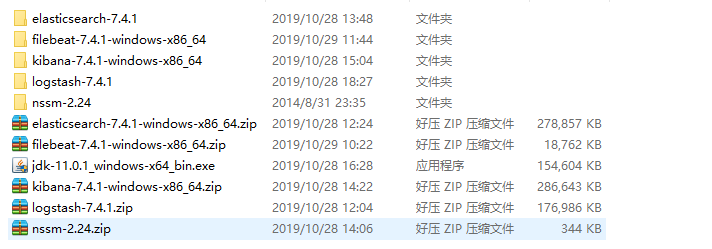
ELK搭建-windows
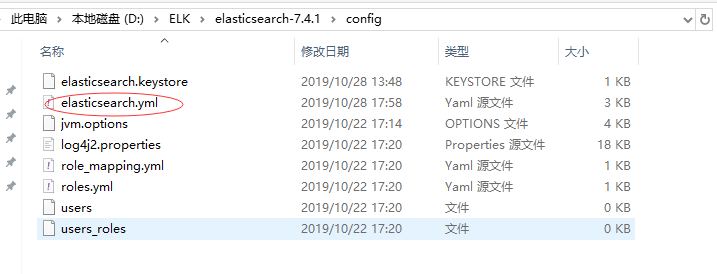
一、E

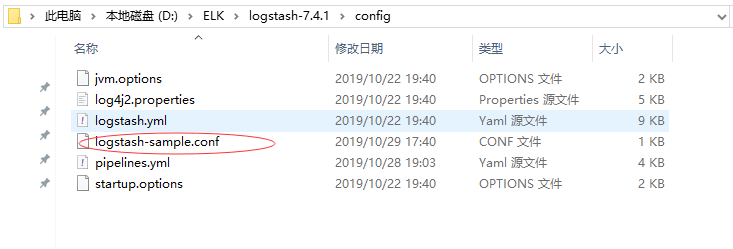
二、L

启动

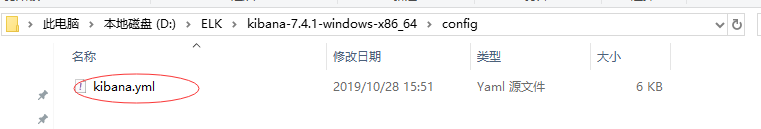
三、K

四、filebeat

五、配置文件使用
1、logstash-sample.conf
# Sample Logstash configuration for creating a simple

# Beats -> Logstash -> Elasticsearch pipeline.

input {

    redis {

        batch_count => 1

        type => "redis-input"

        data_type => "list"

        key => "logstash_test_list"

        host => "127.0.0.1"

        port => 6379

        password => "Aroot1234@A"

        db => 0

        threads => 5

        codec => "json"

    }

     beats{

         host => "127.0.0.1"

         port => 5044

   }

}

filter {

}

output {

    if [fields][document_type]=="api" {

        elasticsearch {

            hosts => ["127.0.0.1:9200"]

            index => "apinadiyi-%{+YYYY.MM.dd}"

            # template_name => "apinadiyi"

        }

        stdout {

            codec => rubydebug

        }

    }

    if [type]=="redis-input" {

        elasticsearch {

            hosts => ["127.0.0.1:9200"]

            index => "logstash-%{+YYYY.MM.dd}"

            # document_type => "logs" # 7之后不支持了

        }

        stdout {

            codec => rubydebug

        }

    }

}
2、filebeat.yml
###################### Filebeat Configuration Example #########################

# This file is an example configuration file highlighting only the most common

# options. The filebeat.reference.yml file from the same directory contains all the

# supported options with more comments. You can use it as a reference.

#

# You can find the full configuration reference here:

# https://www.elastic.co/guide/en/beats/filebeat/index.html

# For more available modules and options, please see the filebeat.reference.yml sample

# configuration file.

#=========================== Filebeat inputs =============================

filebeat.inputs:

# Each - is an input. Most options can be set at the input level, so

# you can use different inputs for various configurations.

# Below are the input specific configurations.

- type: log

  # Change to true to enable this input configuration.

  enabled: true

  # Paths that should be crawled and fetched. Glob based paths.

  paths:

    #- /var/log/*.log

    #- c:\programdata\elasticsearch\logs\*

    - C:\PythonLog\*.log

    #定义写入 ES 时的 _type 值

  fields:

    document_type: "api"

  #   logsource: 192.168.2.116

  #   logtype: nginx

  #   logdj: baseapi

  # Exclude lines. A list of regular expressions to match. It drops the lines that are

  # matching any regular expression from the list.

  #exclude_lines: ['^DBG']

  # Include lines. A list of regular expressions to match. It exports the lines that are

  # matching any regular expression from the list.

  #include_lines: ['^ERR', '^WARN']

  # Exclude files. A list of regular expressions to match. Filebeat drops the files that

  # are matching any regular expression from the list. By default, no files are dropped.

  #exclude_files: ['.gz$']

  # Optional additional fields. These fields can be freely picked

  # to add additional information to the crawled log files for filtering

  #fields:

  #  level: debug

  #  review: 1

  ### Multiline options

  # Multiline can be used for log messages spanning multiple lines. This is common

  # for Java Stack Traces or C-Line Continuation

  # The regexp Pattern that has to be matched. The example pattern matches all lines starting with [

  #multiline.pattern: ^\[

  # Defines if the pattern set under pattern should be negated or not. Default is false.

  #multiline.negate: false

  # Match can be set to "after" or "before". It is used to define if lines should be append to a pattern

  # that was (not) matched before or after or as long as a pattern is not matched based on negate.

  # Note: After is the equivalent to previous and before is the equivalent to to next in Logstash

  #multiline.match: after

#============================= Filebeat modules ===============================

filebeat.config.modules:

  # Glob pattern for configuration loading

  path: ${path.config}/modules.d/*.yml

  # Set to true to enable config reloading

  reload.enabled: true

  # Period on which files under path should be checked for changes

  #reload.period: 10s

#==================== Elasticsearch template setting ==========================

setup.template.settings:

  index.number_of_shards: 1

  #index.codec: best_compression

  #_source.enabled: false

#================================ General =====================================

# The name of the shipper that publishes the network data. It can be used to group

# all the transactions sent by a single shipper in the web interface.

#name:

# The tags of the shipper are included in their own field with each

# transaction published.

#tags: ["service-X", "web-tier"]

# Optional fields that you can specify to add additional information to the

# output.

#fields:

#  env: staging

#============================== Dashboards =====================================

# These settings control loading the sample dashboards to the Kibana index. Loading

# the dashboards is disabled by default and can be enabled either by setting the

# options here or by using the `setup` command.

#setup.dashboards.enabled: false

# The URL from where to download the dashboards archive. By default this URL

# has a value which is computed based on the Beat name and version. For released

# versions, this URL points to the dashboard archive on the artifacts.elastic.co

# website.

#setup.dashboards.url:

#============================== Kibana =====================================

# Starting with Beats version 6.0.0, the dashboards are loaded via the Kibana API.

# This requires a Kibana endpoint configuration.

setup.kibana:

  # Kibana Host

  # Scheme and port can be left out and will be set to the default (http and 5601)

  # In case you specify and additional path, the scheme is required: http://localhost:5601/path

  # IPv6 addresses should always be defined as: https://[2001:db8::1]:5601

  #host: "localhost:5601"

  # Kibana Space ID

  # ID of the Kibana Space into which the dashboards should be loaded. By default,

  # the Default Space will be used.

  #space.id:

#============================= Elastic Cloud ==================================

# These settings simplify using Filebeat with the Elastic Cloud (https://cloud.elastic.co/).

# The cloud.id setting overwrites the `output.elasticsearch.hosts` and

# `setup.kibana.host` options.

# You can find the `cloud.id` in the Elastic Cloud web UI.

#cloud.id:

# The cloud.auth setting overwrites the `output.elasticsearch.username` and

# `output.elasticsearch.password` settings. The format is `<user>:<pass>`.

#cloud.auth:

#================================ Outputs =====================================

# Configure what output to use when sending the data collected by the beat.

#-------------------------- Elasticsearch output ------------------------------

#output.elasticsearch:

  # Array of hosts to connect to.

  #hosts: ["localhost:9200"]

  # Optional protocol and basic auth credentials.

  #protocol: "https"

  #username: "elastic"

  #password: "changeme"

#----------------------------- Logstash output --------------------------------

output.logstash:

  # The Logstash hosts

  hosts: ["127.0.0.1:5044"]

  # Optional SSL. By default is off.

  # List of root certificates for HTTPS server verifications

  #ssl.certificate_authorities: ["/etc/pki/root/ca.pem"]

  # Certificate for SSL client authentication

  #ssl.certificate: "/etc/pki/client/cert.pem"

  # Client Certificate Key

  #ssl.key: "/etc/pki/client/cert.key"

#================================ Processors =====================================

# Configure processors to enhance or manipulate events generated by the beat.

processors:

  - add_host_metadata: ~

  - add_cloud_metadata: ~

#================================ Logging =====================================

# Sets log level. The default log level is info.

# Available log levels are: error, warning, info, debug

#logging.level: debug

# At debug level, you can selectively enable logging only for some components.

# To enable all selectors use ["*"]. Examples of other selectors are "beat",

# "publish", "service".

#logging.selectors: ["*"]

#============================== X-Pack Monitoring ===============================

# filebeat can export internal metrics to a central Elasticsearch monitoring

# cluster.  This requires xpack monitoring to be enabled in Elasticsearch.  The

# reporting is disabled by default.

# Set to true to enable the monitoring reporter.

#monitoring.enabled: false

# Sets the UUID of the Elasticsearch cluster under which monitoring data for this

# Filebeat instance will appear in the Stack Monitoring UI. If output.elasticsearch

# is enabled, the UUID is derived from the Elasticsearch cluster referenced by output.elasticsearch.

#monitoring.cluster_uuid:

# Uncomment to send the metrics to Elasticsearch. Most settings from the

# Elasticsearch output are accepted here as well.

# Note that the settings should point to your Elasticsearch *monitoring* cluster.

# Any setting that is not set is automatically inherited from the Elasticsearch

# output configuration, so if you have the Elasticsearch output configured such

# that it is pointing to your Elasticsearch monitoring cluster, you can simply

# uncomment the following line.

#monitoring.elasticsearch:

#================================= Migration ==================================

# This allows to enable 6.7 migration aliases

#migration.6_to_7.enabled: true
六、别人配置文件参考
1、filebeat.yml
###################### Filebeat Configuration Example #########################

# This file is an example configuration file highlighting only the most common

# options. The filebeat.full.yml file from the same directory contains all the

# supported options with more comments. You can use it as a reference.

#

# You can find the full configuration reference here:

# https://www.elastic.co/guide/en/beats/filebeat/index.html

#=========================== Filebeat prospectors =============================

filebeat.prospectors:

# Each - is a prospector. Most options can be set at the prospector level, so

# you can use different prospectors for various configurations.

# Below are the prospector specific configurations.

- input_type: log

  # Paths that should be crawled and fetched. Glob based paths.

  paths:

     - /usr/local/nginx/logs/api/api.filebeat_*.log

     - /usr/local/nginx/logs/api/msg/api.message_*.log

  #定义写入 ES 时的 _type 值

  document_type: "api"

  fields:

    logsource: 192.168.2.116

    logtype: nginx

    logdj: baseapi

  #排除更改时间超过定义的文件,时间字符串可以用2h表示2小时,5m表示5分钟,默认0

  ignore_older: 0

  #prospector扫描新文件的时间间隔,默认10秒

  scan_frequency: 5s

  # Defines the buffer size every harvester uses when fetching the file, 16K

  #harvester_buffer_size: 16384

  #单文件最大收集的字节数,单文件超过此字节数后的字节将被丢弃,默认10MB,需要增大,保持与日志输出配置的单文件最大值一致即可

  # Maximum number of bytes a single log event can have

  # All bytes after max_bytes are discarded and not sent. The default is 10MB. 10485760

  # This is especially useful for multiline log messages which can get large.

  max_bytes: 1048576000

  # Exclude lines. A list of regular expressions to match. It drops the lines that are

  # matching any regular expression from the list.

  #exclude_lines: ["^DBG"]

  # Include lines. A list of regular expressions to match. It exports the lines that are

  # matching any regular expression from the list.

  #include_lines: ["^ERR", "^WARN"]

  # Exclude files. A list of regular expressions to match. Filebeat drops the files that

  # are matching any regular expression from the list. By default, no files are dropped.

  #exclude_files: [".gz$"]

  # Optional additional fields. These field can be freely picked

  # to add additional information to the crawled log files for filtering

  #fields:

  #  level: debug

  #  review: 1

  ### Multiline options

  # Mutiline can be used for log messages spanning multiple lines. This is common

  # for Java Stack Traces or C-Line Continuation

  # The regexp Pattern that has to be matched. The example pattern matches all lines starting with [

  #multiline.pattern: ^\[

  # Defines if the pattern set under pattern should be negated or not. Default is false.

  #multiline.negate: false

  # Match can be set to "after" or "before". It is used to define if lines should be append to a pattern

  # that was (not) matched before or after or as long as a pattern is not matched based on negate.

  # Note: After is the equivalent to previous and before is the equivalent to to next in Logstash

  #multiline.match: after

#========================= Filebeat global options ============================

# Event count spool threshold - forces network flush if exceeded

#filebeat.spool_size: 2048

# Enable async publisher pipeline in filebeat (Experimental!)

#filebeat.publish_async: false

# Defines how often the spooler is flushed. After idle_timeout the spooler is

# Flush even though spool_size is not reached.

#filebeat.idle_timeout: 5s

# Name of the registry file. If a relative path is used, it is considered relative to the

# data path.

#filebeat.registry_file: ${path.data}/registry

#

# These config files must have the full filebeat config part inside, but only

# the prospector part is processed. All global options like spool_size are ignored.

# The config_dir MUST point to a different directory then where the main filebeat config file is in.

#filebeat.config_dir:

# How long filebeat waits on shutdown for the publisher to finish.

# Default is 0, not waiting.

#filebeat.shutdown_timeout: 0

#================================ General =====================================

# The name of the shipper that publishes the network data. It can be used to group

# all the transactions sent by a single shipper in the web interface.

#name:

# The tags of the shipper are included in their own field with each

# transaction published.

#tags: ["service-X", "web-tier"]

# Optional fields that you can specify to add additional information to the

# output.

#fields:

#  env: staging

#处理管道中单个事件内的队列大小,默认1000

# Internal queue size for single events in processing pipeline

queue_size: 2000

# The internal queue size for bulk events in the processing pipeline.

# Do not modify this value.

#bulk_queue_size: 0

#================================ Outputs =====================================

# Configure what outputs to use when sending the data collected by the beat.

# Multiple outputs may be used.

#-------------------------- Elasticsearch output ------------------------------

#output.elasticsearch:

  # Array of hosts to connect to.

  #hosts: ["localhost:9200"]

  # Optional protocol and basic auth credentials.

  #protocol: "https"

  #username: "elastic"

  #password: "changeme"

#----------------------------- Logstash output --------------------------------

output.logstash:

  # The Logstash hosts

  hosts: ["192.168.6.204:4501"]

  # Optional SSL. By default is off.

  # List of root certificates for HTTPS server verifications

  #ssl.certificate_authorities: ["/etc/pki/root/ca.pem"]

  # Certificate for SSL client authentication

  #ssl.certificate: "/etc/pki/client/cert.pem"

  # Client Certificate Key

  #ssl.key: "/etc/pki/client/cert.key"

#================================ Logging =====================================

# Sets log level. The default log level is info.

# Available log levels are: critical, error, warning, info, debug

#logging.level: debug

# At debug level, you can selectively enable logging only for some components.

# To enable all selectors use ["*"]. Examples of other selectors are "beat",

# "publish", "service".

#logging.selectors: ["*"]
2、nginx_log.conf
input {

        file {

                path => "/opt/logstash-6.7.0/data/*.test.json"

                type => "test"

                start_position => "beginning"

                sincedb_path => "/opt/logstash-6.7.0/data/test-sincedb"

        }

}

input {

        beats {

            port => 4501

            ssl  => false

        }

}

filter {

        if [fields][logtype] in ["test", "nginx"] or [type]=="test" {

            grok {

                    #设置自定义正则路径

                    patterns_dir => ["/opt/logstash-6.7.0/config/patterns/nginx"]

                    match => {

                            "message" => "%{NGINXACCESS}"

                    }

            }

            date {

                    match => [ "timestamp" , "dd/MMM/YYYY:HH:mm:ss Z" ]

                    target => "@timestamp"

                    locale => "cn"

            }

            useragent{

                source => "agent"

                prefix => "agent_"

                remove_field =>  "agent"

            }

            #定义客户端的IP是哪个字段(上面定义的数据格式)

            if [clientip] {

                geoip {

                    source => "clientip"   # 取自nginx中的客户端ip

                }

            }

            if ![request_time] {

                mutate {

                    add_field =>   {

                        "request_time" => "0.0"

                    }

                }

            }

            if ![upstream_response_time] {

                mutate {

                    add_field =>   {

                        "upstream_response_time" => "0.0"

                    }

                }

            }

            #需要进行转换的字段,这里是将访问的时间转成int,再传给Elasticsearch

            mutate {

                convert => ["bytes", "integer"]

                convert => ["[geoip][coordinates]", "float" ]

                convert => ["request_time", "float"]

                convert => ["upstream_response_time", "float"]

            }

        }

        # 对模板点击参数进行分解

        # /Mould/GetLmsgBoard/?t=1554737610678&id=1&m_no=F2018_11_21_00100

        # func=Mould

        # module=GetLmsgBoard

        # para=?t=...

        if [type]=="api" {

            mutate{

                add_field =>   {

                    "tempmessage" => "%{[request]}"

                }

            }

             mutate{

                split => ["tempmessage","/"]

                add_field =>   {

                    "module" => "%{[tempmessage][1]}"

                }

                add_field =>   {

                    "func" => "%{[tempmessage][2]}"

                }

                add_field =>   {

                    "para" => "%{[tempmessage][3]}"

                }

            }

            if [func] == "GetLmsgBoard" {

                kv {

                    source => "para"

                    include_keys => ["id","m_no"]

                    prefix => "msg_"

                    field_split => "&? "

                    add_field =>   {

                        "type" => "api"

                    }

                }

                mutate{

                    convert => [ "meg_id", "integer"]

                    replace => { "type" => "message"}

                }

            }

            mutate{

                remove_field => "tempmessage"

                remove_field => "para"

            }

        }

        #####################################################################

        #        Baidu

        #####################################################################

        if [type]=="baidu" {

            date {

              match => ["datetime", "yyyy/MM/dd HH:mm:ss Z"]

              target => "@timestamp"

              locale => "cn"

              timezone => "Asia/Shanghai"

            }

            #定义客户端的IP是哪个字段(上面定义的数据格式)

            geoip {

                source => "ip"

            }

            mutate {

                convert => { "datetime" => "string" }

            }

        }

        #####################################################################

        #        ERP User

        #####################################################################

        if [type]=="erpuser" {

            date {

              match => ["time", "yyyy-MM-dd HH:mm:ss Z"]

              target => "@timestamp"

              locale => "cn"

              timezone => "Asia/Shanghai"

            }

            #定义客户端的IP是哪个字段(上面定义的数据格式)

            geoip {

                source => "ip"

            }

            mutate {

                convert => { "time" => "string" }

            }

        }

}

output {

        if [type]=="fanyi" {

            elasticsearch {

                hosts => ["http://192.168.6.204:9200"]

                index => "nginx-fanyi-%{+YYYY.MM}"

                template_name => "nginx"

            }

        }

        if [type]=="api" {

            elasticsearch {

                hosts => ["http://192.168.6.204:9200"]

                index => "apinadiyi-%{+YYYY.MM.dd}"

                template_name => "apinadiyi"

            }

        }

        if [type]=="message" {

            elasticsearch {

                hosts => ["http://192.168.6.204:9200"]

                index => "message-%{+YYYY.MM.dd}"

                template_name => "message"

            }

        }

        if [type]=="beimu" {

            elasticsearch {

                hosts => ["http://192.168.6.204:9200"]

                index => "nginx-beimu-%{+YYYY.MM}"

                template_name => "nginx"

            }

        }

        if [type]=="syd" {

            elasticsearch {

                hosts => ["http://192.168.6.204:9200"]

                index => "nginx-syd-%{+YYYY.MM}"

                template_name => "nginx"

            }

        }

        if [type]=="nadiyi" {

            elasticsearch {

                hosts => ["http://192.168.6.204:9200"]

                index => "nginx-nadiyi-%{+YYYY.MM}"

                template_name => "nginx"

            }

        }

        if [type]=="jiajiao" {

            elasticsearch {

                hosts => ["http://192.168.6.204:9200"]

                index => "nginx-jiajiao-%{+YYYY.MM}"

                template_name => "nginx"

            }

        }

        if [type]=="tingclass" {

            elasticsearch {

                hosts => ["http://192.168.6.204:9200"]

                index => "nginx-tingclass-%{+YYYY.MM}"

                template_name => "nginx"

            }

        }

        if [type]=="baidu" {

            elasticsearch {

                hosts => ["http://192.168.6.204:9200"]

                index => "baidu-%{+YYYY.MM.dd}"

                template_name => "baidu"

            }

            #stdout {

            #    codec => rubydebug

            #}

        }

        if [type]=="erpuser" {

            elasticsearch {

                hosts => ["http://192.168.6.204:9200"]

                index => "erpuser-new-%{+YYYY.MM}"

                template_name => "erpuser"

            }

        }

        if [type] == "test" {

            elasticsearch {

                hosts => ["http://192.168.6.204:9200"]

                index => "nginx-access-test-%{+YYYY.MM}"

            }

            stdout {

                codec => rubydebug

            }

        }

}
3、nginx_template.json
PUT _template/nginx

{

    "order" : 0,

    "version" : 190407,

    "index_patterns" : [

      "nginx-*"

    ],

    "settings" : {

      "number_of_shards": 1,

      "number_of_replicas": 1,

      "index" : {

        "refresh_interval" : "30s"

      }

    },

    "mappings" : {

      "doc" : {

        "dynamic_templates" : [

          {

            "message_field" : {

              "path_match" : "message",

              "mapping" : {

                "index": "false",

                "norms" : false,

                "type" : "text"

              },

              "match_mapping_type" : "string"

            }

          },

          {

            "string_fields" : {

              "mapping" : {

                "index": "true",

                "analyzer": "ik_max_word",

                "search_analyzer": "ik_smart",

                "norms" : false,

                "type" : "text",

                "fields" : {

                  "keyword" : {

                    "ignore_above" : 512,

                    "type" : "keyword"

                  }

                }

              },

              "match_mapping_type" : "string",

              "match" : "*"

            }

          }

        ],

        "properties" : {

          "@timestamp" : {

            "type" : "date"

          },

          "geoip" : {

            "dynamic" : true,

            "properties" : {

              "ip" : {

                "type" : "ip"

              },

              "latitude" : {

                "type" : "half_float"

              },

              "location" : {

                "type" : "geo_point"

              },

              "longitude" : {

                "type" : "half_float"

              }

            }

          },

          "@version" : {

            "type" : "keyword"

          }

        }

      }

    },

    "aliases" : {

        "nginx_this_week":{}

    }

  }
4、nginx
URIPATH1 (?:/[\\A-Za-z0-9$.+!*'(){},~:;=@#% \[\]_<>^\-&?]*)+

URI1 %{URIPROTO}://(?:%{USER}(?::[^@]*)?@)?(?:%{URIHOST})?(?:%{URIPATH1 })?

NGINXACCESS %{IPORHOST:clientip} \[%{HTTPDATE:timestamp}\] %{NUMBER:response} (?:%{WORD:catch}|-) %{WORD:verb} %{URIPATH1:request} HTTP/%{NUMBER:httpversion} (?:%{NUMBER:bytes}|-) (?:%{NUMBER:request_time}|-) (?:%{NUMBER:upstream_response_time}|-) (?:%{URI1:referrer}|-) (?:%{QS:agent}|-) (?:(%{IPORHOST:upsteam_server}:%{POSINT:up_port})|-) (?:%{NUMBER:up_request}|-)
ELK搭建-windows的更多相关文章
- 2018年ElasticSearch6.2.2教程ELK搭建日志采集分析系统(教程详情)
章节一 2018年 ELK课程计划和效果演示1.课程安排和效果演示 简介:课程介绍和主要知识点说明,ES搜索接口演示,部署的ELK项目演示 es: localhost:9200 k ...
- 【Lua学习笔记之:Lua环境搭建 Windows 不用 visual studio】
Lua 环境搭建 Windows 不用 visual studio 系统环境:Win7 64bit 联系方式:yexiaopeng1992@126.com 前言: 最近需要学习Unity3d游戏中的热 ...
- 转:WIN7上搭建Windows Phone 8 开发环境——VMware Workstation下Win8 “无法安装Hyper-V, 某个虚拟机监控程序正在运行”问题解决的办法
转自:http://www.cnblogs.com/shaddock2013/p/3155024.html 最近在试着在Windows 7上搭建Windows Phone 8的开发调试环境,使用的是V ...
- WIN7上搭建Windows Phone 8 开发环境——VMware Workstation下Win8 “无法安装Hyper-V, 某个虚拟机监控程序正在运行”问题解决的办法
最近在试着在Windows 7上搭建Windows Phone 8的开发调试环境,使用的是VMware Workstation + Win8 Pro的虚拟环境, 在漫长的WPexpress_full下 ...
- OpenGL环境搭建Windows+Mac+Linux
OpenGL环境搭建Windows+Mac+Linux Mac平台下 下载列表:GLFWcmake 下载的GLFW解压缩 然后安装cmake, 安装好cmake之后打开 1.browse source ...
- Python环境搭建(windows)
Python环境搭建(windows) Python简介 Python(英国发音:/ˈpaɪθən/ 美国发音:/ˈpaɪθɑːn/),是一种面向对象.直译式计算机编程语言,具有近二十年的发展历史,成 ...
- 图文详解如何搭建Windows的Android C++开发环境
原地址:http://www.apkbus.com/android-18595-1-1.html //================================================= ...
- 搭建Windows SVN服务器及TortoiseSVN使用帮助和下载
搭建Windows SVN服务器: 用的SVN服务器通常为外部,例如Google Code的服务器,不过,做为一个程序开发人员,就算自己一个人写程序,也应该有一个SVN版本控制系统,以便对开发代码进行 ...
- (1)cocos2d-x-2.2.4搭建windows开发环境
Cocos2d-x-2.2.4搭建windows环境 软件需求 Windows系统(windows7或之后的系统): cocos2d-x-2.2.4压缩包. python安装包(推荐使用2.7.3版本 ...
随机推荐
- 关于Oracle 数据库使用dba_tables或者all_tables或者user_tables统计数据时,与直接查询表统计时数据不一致的记录
1. 今天写代码发现这个问题,这里记录一下, 不一致的原因是因为 dba_tables .all_tables.user_tables 不是实时的反应表的数据的,所以需要在查询统计之前对表进行手动分 ...
- 【Scrapy(三)】Scrapy 中的 logging 模块
logging模块的使用: 1.在scrapy中使用 2.在普通项目中使用
- cf534D 枚举握手次数
题意: 有n个学生进教室,先后顺序不同,每个人进去后会和当前在教室里的人握手,并且记录人数,而且当教室里有超过三个人的时候 他们有可能组队去参加比赛,后来的人看不到他们. 思路: ...
- Dockerfile多阶段构建
多阶段构建 之前的做法: 在Docker17.05版本之前,构建Docker镜像,通常采用两种方式: 1.全部放入一个Dockerfile 一种方式是将所有的构建过程全都包含在一个Dockerfile ...
- Windows核心编程 第四章 进程(上)
第4章 进 程 本章介绍系统如何管理所有正在运行的应用程序.首先讲述什么是进程,以及系统如何创建进程内核对象,以便管理每个进程.然后将说明如何使用相关的内核对象来对进程进行操作.接着,要介绍进 ...
- 前端Excel表格导入导出,包括合并单元格,表格自定义样式等
表格数据导入 读取导入Excel表格数据这里采用的是 xlsx 插件 npm i xlsx 读取excel需要通过 XLSX.read(data, {type: type}) 方法来实现,返回一个叫W ...
- Elastic-Job原理
概述Elastic-Job是一个分布式调度解决方案,由两个相互独立的子项目Elastic-Job-Lite和Elastic-Job-Cloud组成. Elastic-Job-Lite定位为轻量级无中心 ...
- 大数据开发-Flink-数据流DataStream和DataSet
Flink主要用来处理数据流,所以从抽象上来看就是对数据流的处理,正如前面大数据开发-Flink-体系结构 && 运行架构提到写Flink程序实际上就是在写DataSource.Tra ...
- Day015 Error和Exception
Error和Exception 什么是异常 实际工作中,遇到的情况不可能是非常完美的.比如:你写的某个模块,用户输入不一定符合你的要求.你的程序要打开某个文件,这个文件可能不存在或者文件的格式不对,你 ...
- Spring cloud 基础框架集成
Spring cloud 基础框架集成 1. 注册中心 -eurekar 1. pom依赖 <?xml version="1.0" encoding="UTF-8& ...