MKMapView and Zoom Levels: A Visual Guide
原帖:http://troybrant.net/blog/2010/01/mkmapview-and-zoom-levels-a-visual-guide/
So, how exactly does the code provided in the previous post work? What follows is a visual explanation of Google Maps, zoom levels, and how you go about adding support for zoom levels to the MKMapView class.
Round to Flat
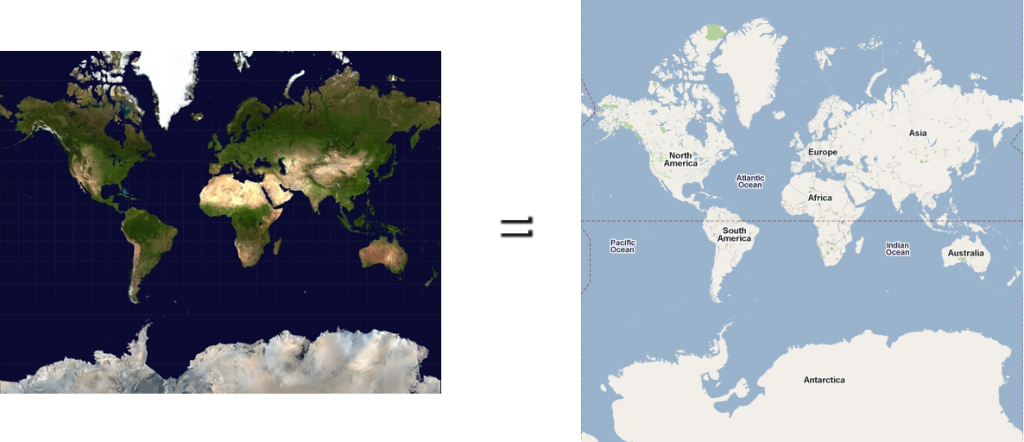
This is planet Earth:
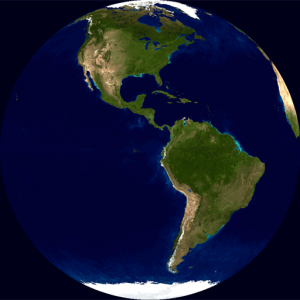
As you may know, it is round.
To create a map of the Earth, the curved surface must be projected onto a flat surface. There are many map projections that attempt to flatten the Earth. There are distortions inherent to every projection, but each map projection aims to preserve at least one quality from the original curved representation.
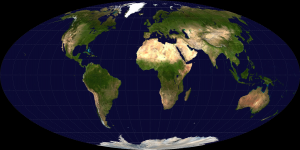
Some projections preserve area, such as the Mollweide projection:
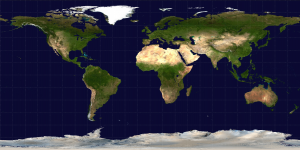
Equirectangluar projections preserve distance between the meridians:
The Mercator projection stretches out the poles in order to preserve locally measured angles:
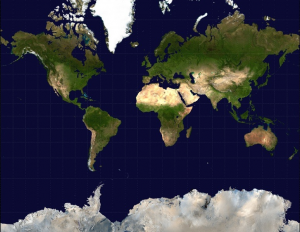
Google uses the Mercator projection to render Google Maps:
Mercator Math
The Mercator projection converts latitude (φ) and longitude (λ) coordinates to pixel values. It uses math:

You don’t have to understand the math; just know that it converts latitudes and longitudes to pixels.
But, where are these pixels? Well, it depends on your zoom level.
Zoom Levels
At zoom level 0, Google displays the world in a single 256 pixel by 256 pixel tile:

At zoom level 1, Google doubles the area of the map while keeping the tile size constant. So, the map grows to 512 pixels by 512 pixels and uses four tiles:

At zoom level 2, Google doubles the area again. The map grows to 1024 pixels by 1024 pixels and uses sixteen tiles:

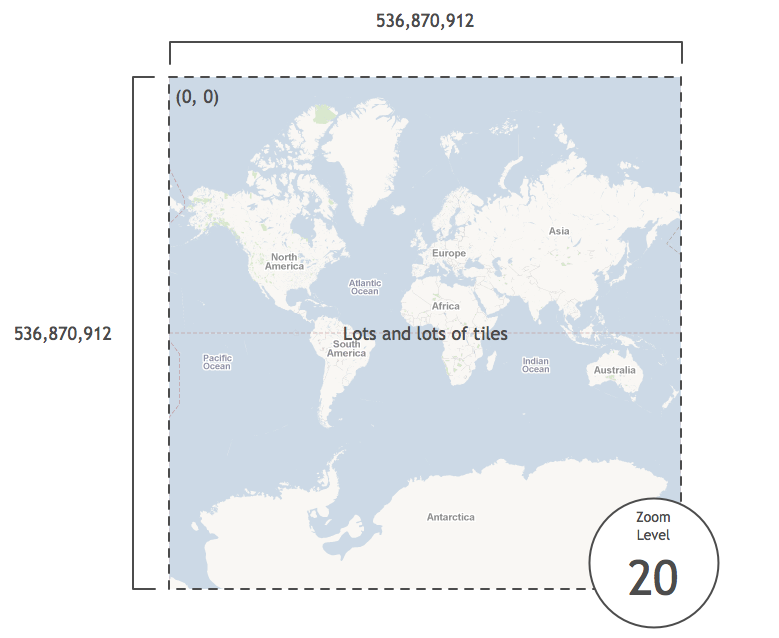
The pixel area continues to double at each zoom level, and when zoom level 20 is reached, the map is 536,870,912 pixels by 536,870,912 pixels. It has so many tiles we won’t bother to count them:
Latitudes and Longitudes to Pixels
As part of the PHP Static Maps project, Mike Tuupola wrote some code that converts latitudes and longitudes to pixels at zoom level 20. The code is easily ported to Objective-C:
#define MERCATOR_OFFSET 268435456 /* (total pixels at zoom level 20) / 2 */
#define MERCATOR_RADIUS 85445659.44705395 /* MERCATOR_OFFSET / pi */
x = round(MERCATOR_OFFSET + MERCATOR_RADIUS * longitude * M_PI / 180.0);
y = round(MERCATOR_OFFSET - MERCATOR_RADIUS * logf((1 + sinf(latitude * M_PI / 180.0)) / (1 - sinf(latitude * M_PI / 180.0))) / 2.0);
To be honest, I haven’t taken the time to wrap my head around how this code works. But, knowing that it does
work, we can now take any latitude and longitude and figure out its
pixel coordinates at zoom level 20. For instance, here are the pixel
coordinates of several cities around the world:
![]()
Add an iPhone
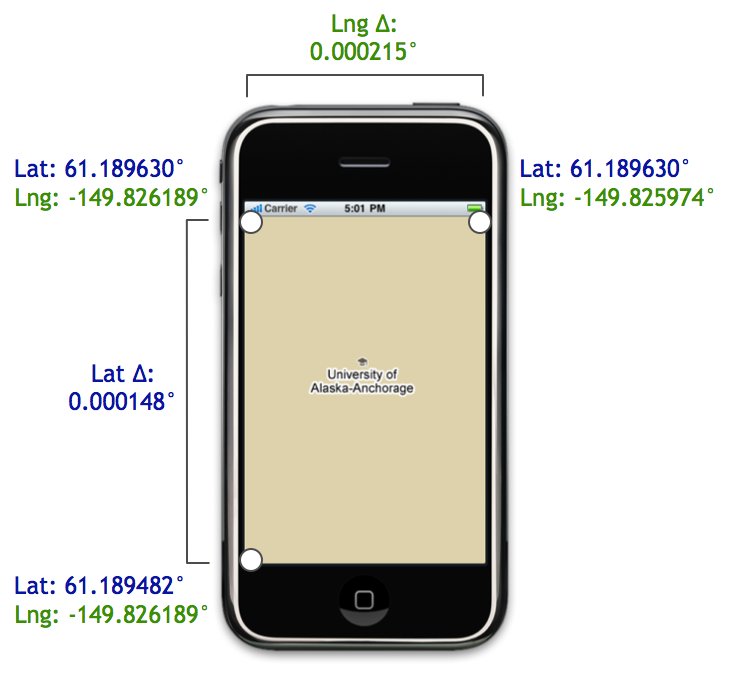
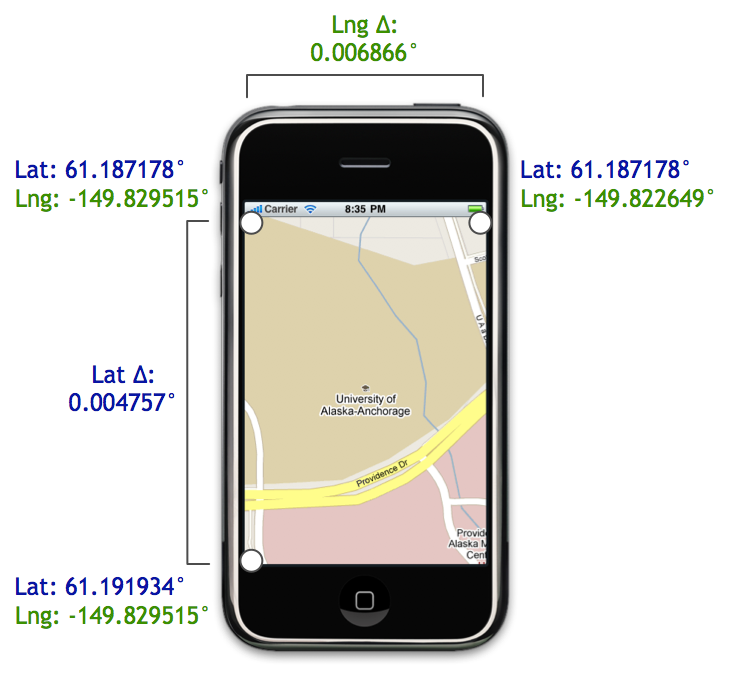
Say we place an iPhone on top of Anchorage, Alaska at zoom level 20:

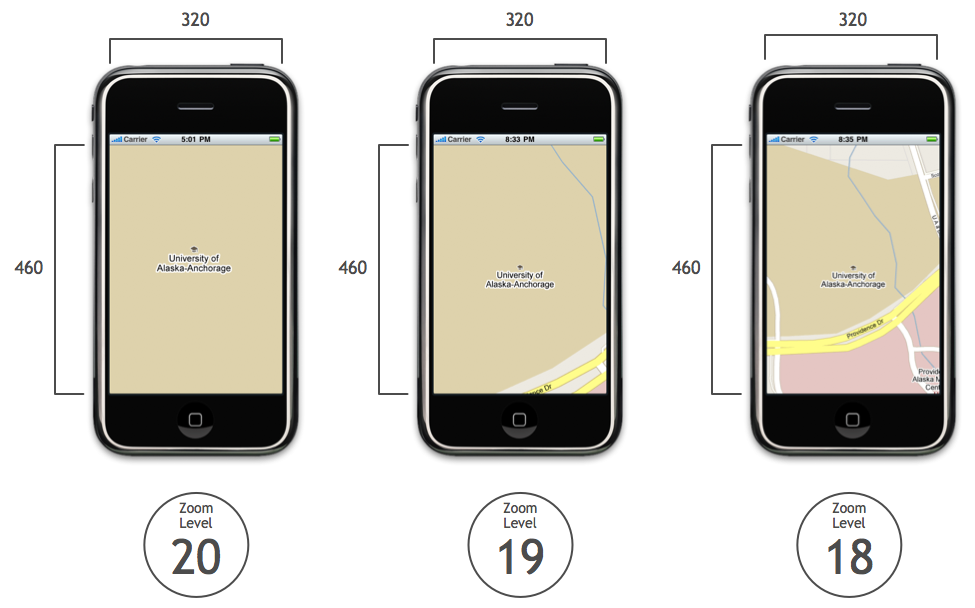
In the iPhone shown above, the map size is 320 pixels by 460 pixels.
Since we know the map dimensions and center coordinate in pixels, we can
easily compute the pixel coordinates of the top-left corner relative to
the center pixel coordinate:

We can find the relative position of the top-right and bottom-left pixel coordinates as well:

The PHP Static Maps code also provides code to go from pixels at zoom level 20 to latitudes and longitudes:
latitude = (M_PI / 2.0 - 2.0 * atan(exp((round(pixelY) - MERCATOR_OFFSET) / MERCATOR_RADIUS))) * 180.0 / M_PI;
longitude = ((round(pixelX) - MERCATOR_OFFSET) / MERCATOR_RADIUS) * 180.0 / M_PI;
We can use this code to convert the corners from pixel coordinates to latitudes and longitudes:
As shown above, using the corner coordinates, we can compute the
latitudinal and longitudinal distances. These distances are exactly what
we need to construct an MKCoordinateSpan. That span, in turn, is used to initialize the region property of an MKMapView:
MKCoordinateSpan span = MKCoordinateSpanMake(latitudeDelta, longitudeDelta);
MKCoordinateRegion region = MKCoordinateRegionMake(centerCoordinate, span);
[mapView setRegion:region animated:NO];
And you’re done!…That is, if you want to see zoom level 20. What do
you do when your user wants to see the map at zoom level 19 instead of
20?
Scaling using Zoom Levels
Relative to zoom level 20, zooming out one level doubles the area visible on the map.
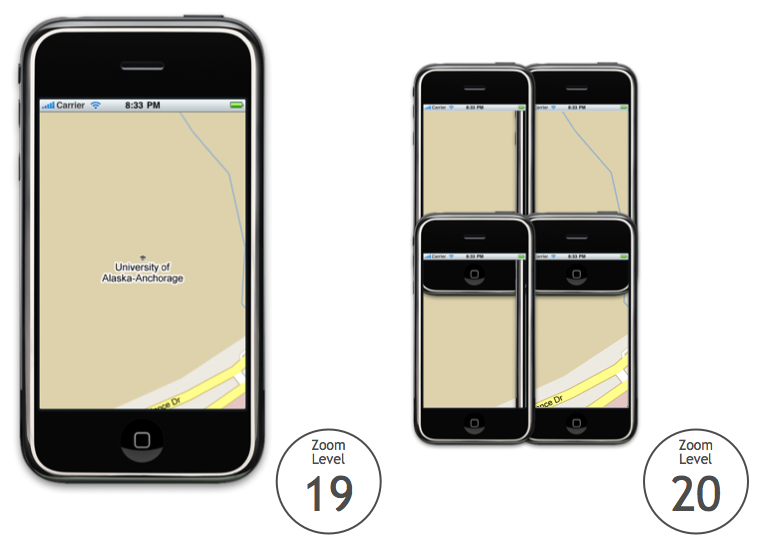
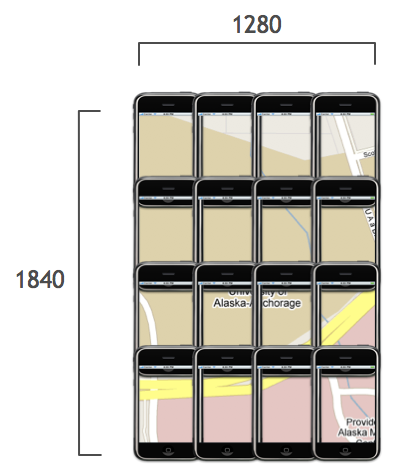
For example, consider the image below. On the left is Anchorage at
zoom level 19, and on the right are the 4 iPhones at zoom level 20 it
would take to display the same amount of area:
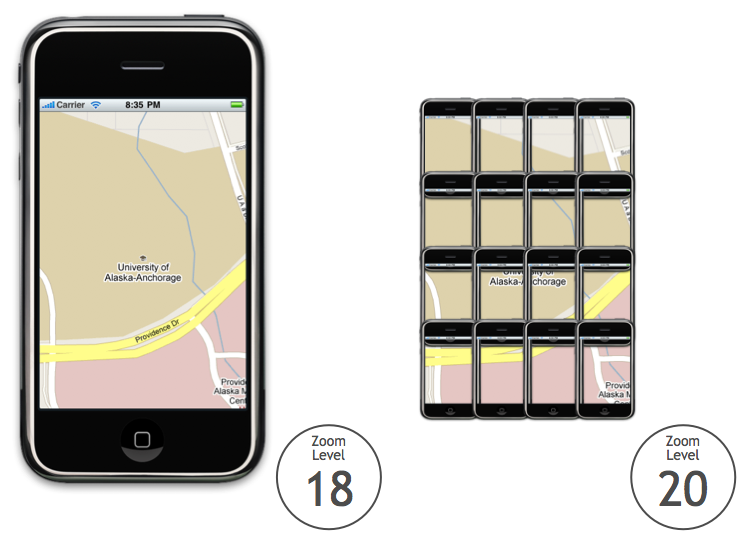
If we move up another level, the area doubles again. Consider the
following image. On the left is Anchorage at zoom level 18, and on the
right are the 16 iPhones at zoom level 20 it would take to display the
same amount of area:
Since the area doubles at each zoom level, we can define the
following exponential relationship between the zoom level and the area
covered by the map:
NSInteger zoomExponent = 20 - zoomLevel;
double zoomScale = pow(2, zoomExponent);
double scaledMapWidth = mapSizeInPixels.width * zoomScale;
double scaledMapHeight = mapSizeInPixels.height * zoomScale;
For instance, here is Anchorage at zoom levels 20, 19, and 18. The map’s width and height in pixels are unaltered:
After computing the zoom scale factor, we can apply it to each map to determine its dimensions at zoom level 20:

After we compute these new dimensions, we plug them into the algorithm for finding the coordinates of the map corners.
An Example: Zoom Level 18
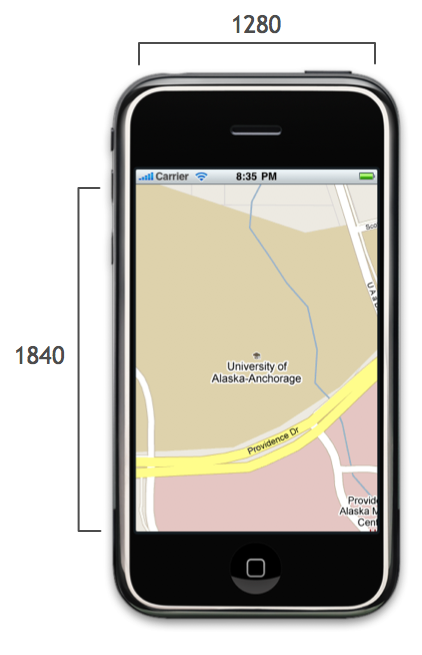
For instance, say we take the map at zoom level 18:
Let’s drop the matrix of phones but keep the scaled width and height:
We find the top-left corner just like we did before, except now we use the scaled width and height:

Similarly, we use the scaled width and height for finding the top-right and bottom-left corners as well:

Using the pixel and latitude and pixel and longitude helper methods,
we can compute the coordinates of the corners and the distance between
them:
These delta values are used to initialize the map’s region property, and the map zooms to the level you specify.
That’s a Wrap
Be sure to check out the previous post for the full code that adds support for zoom levels to MKMapView.
If you are interested in learning more from someone much smarter than I am, check out these posts from Charlie Savage, a programmer and cartographer extraordinaire:
Much of what I know about maps is from these articles, and I highly
recommended checking them out if you want to learn more about how Google
Maps works under the hood.
MKMapView and Zoom Levels: A Visual Guide的更多相关文章
- [Forward]Visual Guide: Setting up My Sites in SharePoint 2013
from http://blog.sharedove.com/adisjugo/index.php/2012/07/25/visual-guide-setting-up-my-sites-in-sh ...
- A SIMPLE LIBRARY TO BUILD A DEEP ZOOM IMAGE
My current project requires a lot of work with Deep Zoom images. We recently received some very high ...
- leaflet地图库
an open-source JavaScript libraryfor mobile-friendly interactive maps Overview Tutorials Docs Downlo ...
- Android Weekly Notes Issue #221
Android Weekly Issue #221 September 4th, 2016 Android Weekly Issue #221 ARTICLES & TUTORIALS And ...
- less 基础+ flex
1.less 中的变量 @ 符号 引入 /*普通变量*/ @color:pinker; .styles{ color:@color; } /*选择器变量*/ @I:img; @{I}{ width: ...
- Flex 布局教程:语法篇
作者: 阮一峰 网页布局(layout)是CSS的一个重点应用. 布局的传统解决方案,基于盒状模型,依赖 display属性 + position属性 + float属性.它对于那些特殊布局非常不方便 ...
- TileJSON
TileJSON TileJSON is an open standard for representing map metadata. License The text of this specif ...
- MBTiles
MBTiles Specification MBTiles is a specification for storing tiled map data in SQLite databases for ...
- 【转】Flex 布局语法教程
网页布局(layout)是CSS的一个重点应用. 布局的传统解决方案,基于盒状模型,依赖 display属性 + position属性 + float属性.它对于那些特殊布局非常不方便,比如,垂直居中 ...
随机推荐
- MySQL定时备份之使用Linux下的crontab定时备份实例
这篇文章主要介绍了使用Linux下的crontab进行MySQL定时备份的例子,需要的朋友可以参考下 复制代码代码如下: ##################################### ...
- vim 开发配置(转载)
原文:http://www.cnblogs.com/ma6174/archive/2011/12/10/2283393.html 花了很长时间整理的,感觉用起来很方便,共享一下. 我的vim配置主要有 ...
- Java基础知识强化之IO流笔记03:throws的方式处理异常
1. 什么时候使用throws ? (1)定义功能方法时候,需要把出现的问题暴露出来,让调用者去处理.那么就通过throws在方法上标识. (2)有时候,我们是可以对异常进行处理的,但是又有些时候,我 ...
- git pull 代码很慢的问题
办公环境调整,之前开发机是和自己的电脑放同一网段内的,现在开发机放至到本地其他网段内,造成pull 代码很慢的问题,在网上查了一下 以下是原文,链接为 http://blog.sina.com.cn/ ...
- Topcoder SRM 639 (Div.2)
A.ElectronicPetEasy [题意]一个数st1开始,每次加p1,一共加t1次,另外一个数st2开始,每次加p2,一共加t2次,输入的数均小于1000,问这两个数有没有可能相等,有可能输出 ...
- 判断两条直线的位置关系 POJ 1269 Intersecting Lines
两条直线可能有三种关系:1.共线 2.平行(不包括共线) 3.相交. 那给定两条直线怎么判断他们的位置关系呢.还是用到向量的叉积 例题:POJ 1269 题意:这道题是给定四个点p1, ...
- Oracle 11g详细安装配置教程
最近开始学习Oracle数据库了,根据我的理解Oracle数据库是一种强大.复杂.高性能的数据库,而且价格不菲,使用都是中大型企业,土豪专用.学习一种数据库的入门工作就是先安装这种数据库,鉴于大批道友 ...
- svg转换工具
package com.rubekid.springmvc.utils; import java.io.ByteArrayInputStream; import java.io.ByteArrayOu ...
- dropdownlist 二级联动
protected void Page_Load(object sender, EventArgs e) { if (!Page.IsPostBack) { GradeBind(); } } //绑定 ...
- MD5加密类
public class MD5Util { public static String getMD5(String s) { char hexDigits[] = {'0', '1', '2', '3 ...