基于GIS的国土空间规划平台建设
本期介绍基于地理信息平台的国土空间规划平台的规划辅助编制应用。在梳理国土空间规划科学流程的基础上,将规划编制各关键环节信息化、工具化、智能化;充分发挥清华同衡大数据与智能模型相结合的定量评估、精准预测的数据优势与模型优势,提升国土空间规划编制的精准性、科学性。
国土空间规划编制包括明晰规划思路、统一规划基础、开展基础评价、绘制规划底图、编制空间规划等主要任务。在统一规划基础信息前提下,开展资源环境承载能力评价和国土空间开发适宜性评价,划定“三区三线”,形成规划底图;结合国家、区域及城市发展战略,制定规划目标,在规划实施评估的基础上,进行要素配置,并叠加规划底图,形成空间布局方案,完成规划成果编制。规划辅助编制应用针对以上各任务,提供智能化的分析模块。
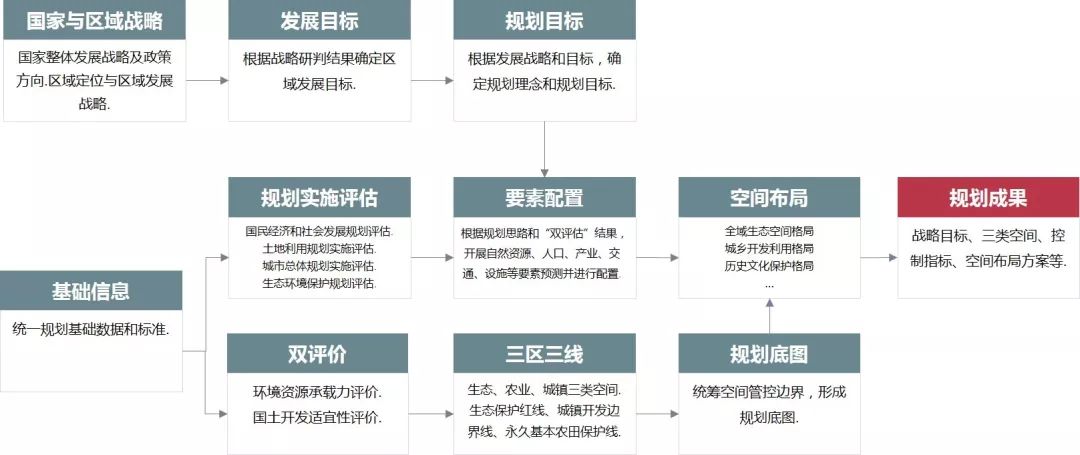

国土空间规划编制流程
|
模块1 |
规划基础信息数据处理 |
国土空间规划编制需要统一的规划基础信息数据支撑。但目前规划基础信息数据种类多样、来源不一,面临基准坐标、数据格式、时空精度不统一等问题。规划基础信息数据处理模块,建立国土空间规划数据存储、数据治理与数据使用规则;支持图表、文本、空间矢量、栅格、海量高时空精度社会大数据等各类型数据的存储、加载与展示;提供坐标转换、格式转换、时空精度转换等功能,为国土空间规划提供统一的规划基础信息数据。
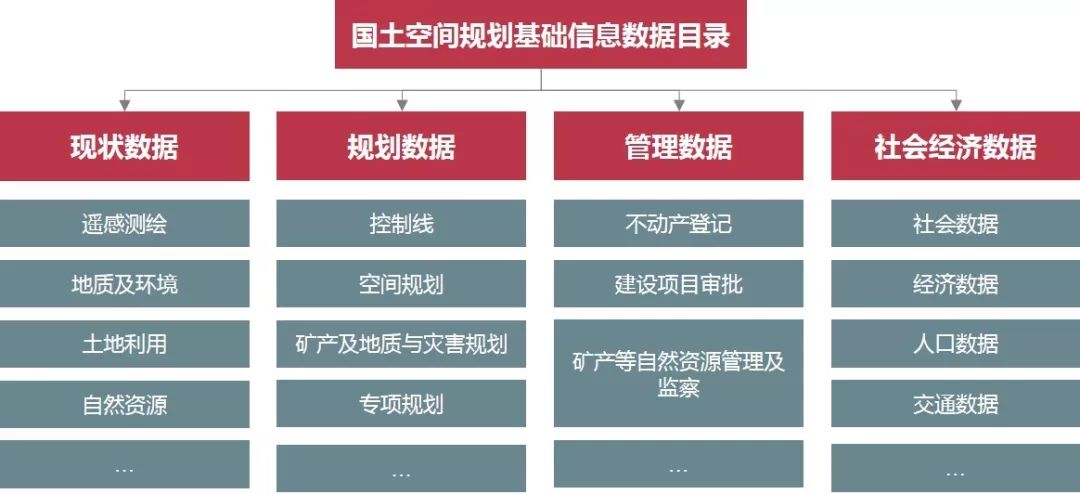
国土空间规划基础信息数据目录
|
模块2 |
“双评价” |
资源环境承载能力评价和国土空间开发适宜性评价(简称“双评价”)是开展国土空间规划编制的前提和基础。
其中,资源环境承载能力评价是指在土地资源、水资源、海洋资源、环境、生态、灾害等单项资源环境要素评价的基础上,开展生态功能、农业功能、城镇功能导向的资源环境承载能力集成评价。
国土空间开发适宜性评价以资源环境承载能力评价结果为基础,划定生态保护、农业生产、城镇建设适宜性分区。结合“双评价”结果,进行资源环境秉赋特征、问题与风险识别、潜力分析、情景分析等综合分析。
“双评价”模块以《资源环境承载能力和国土空间开发适宜性评价技术指南》为依据,为每项资源环境要素单项评价、集成评价提供数据处理、要素分级、阈值率定、优化修正、空间分析、统计图表等功能,实现智能化的评价分析、成果核验和输出。

“双评价”流程
 “双评价”模块界面
|
模块3 |
“三区三线”划定 |
“三区三线”作为空间规划底图的载体,是指在“双评价”的基础上,科学有序统筹布局生态、农业、城镇等功能空间,划定生态保护红线、永久基本农田、城镇开发边界等空间管控边界。
“三区三线”划定模块在综合考虑底线保护要求(永久基本农田、各类自然保护地、重点生态功能区、生态环境敏感区和脆弱区保护等)和社会经济发展要素(经济社会发展、产业布局、人口集聚趋势等)基础上,科学测算城镇、农业、生态三类空间比例和开发强度指标。
参照生态红线、城镇开发边界等划定指南,梳理生态保护要素,开展生态功能重要性评价、生态敏感性评价,划定生态保护红线;基于城镇发展现状研究、城镇发展定位和目标分析、城镇发展规模预测、城镇空间格局研究等,划定城镇开发边界;通过永久基本农田现状分析、占补平衡分析等,划定永久基本农田保护线。统筹“双评价”结果、三条控制线位置,初步划定生态、农业、城镇适宜空间。
“三区三线”划定模块提供边界初划的基本流程及分析工具,以及冲突检测、方案协调等功能,实现“三区三线”智能划定、成果检验和输出。
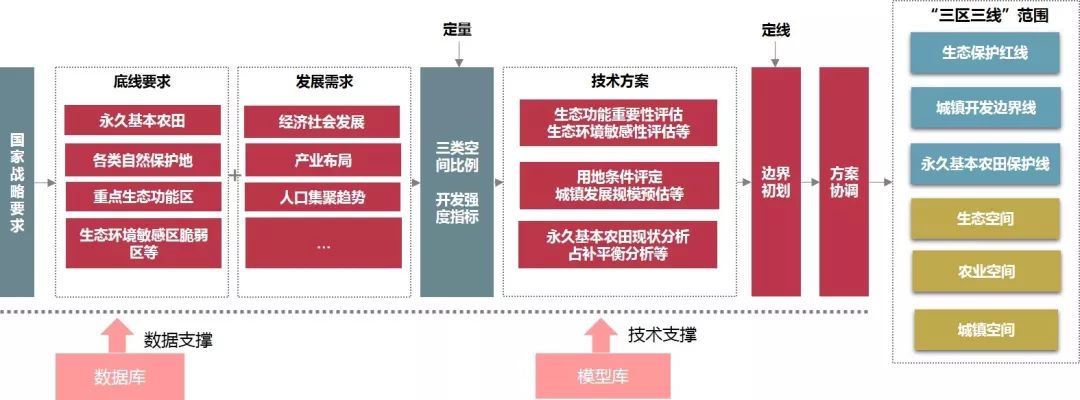
“三区三线”划定流程
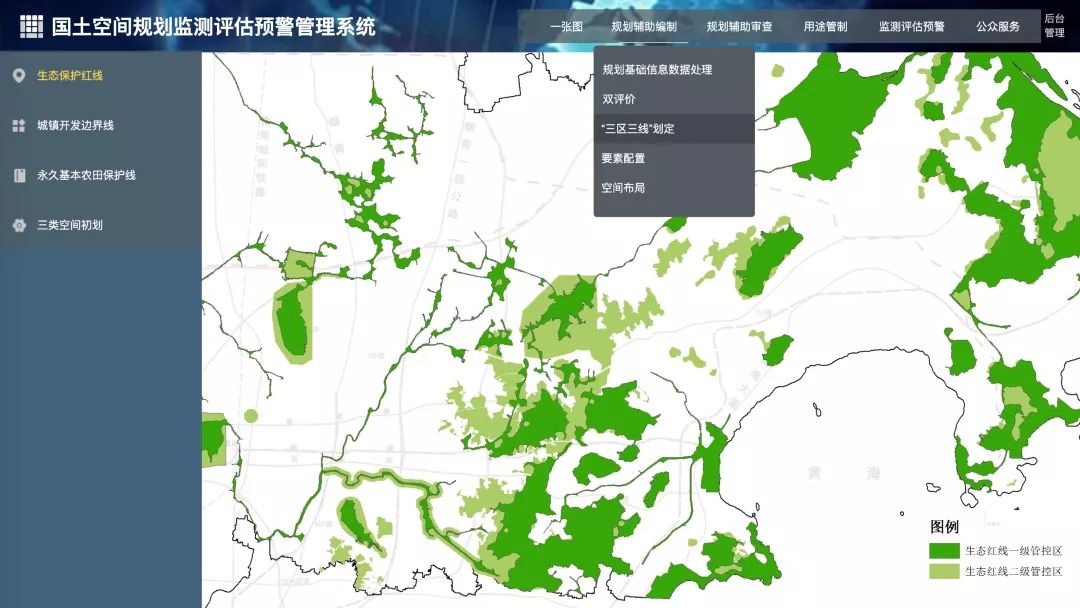
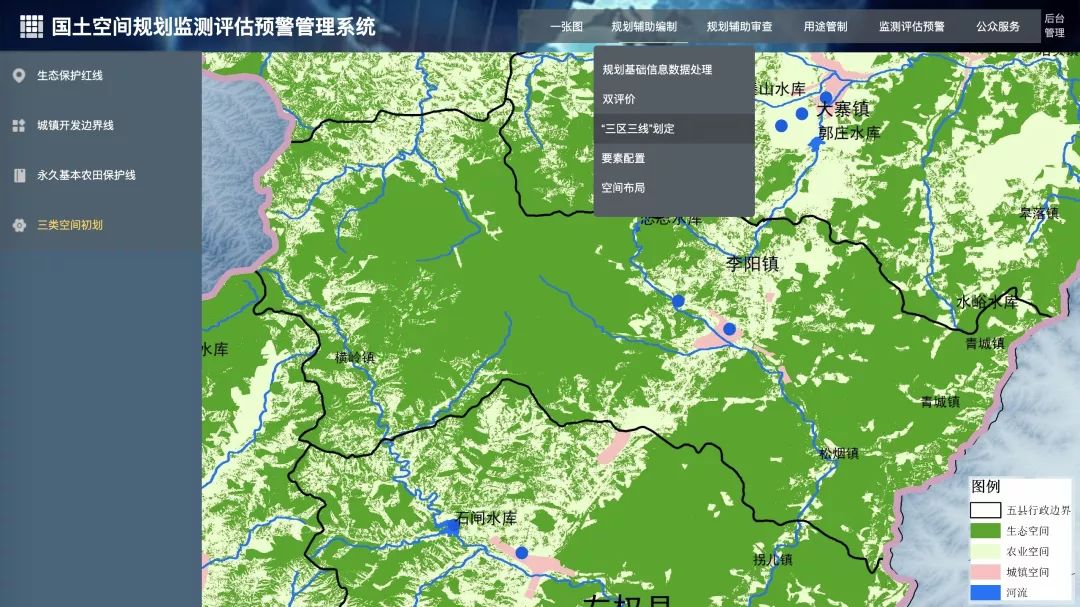
“三区三线”划定模块界面
|
模块4 |
要素配置及空间布局 |
围绕底线约束、绿色发展、城乡融合、区域协同、以人为本、品质提升等发展要求,重点解决要素配置问题。通过高时空精度大数据和灵活的专业模型,进行自然资源、生态环境、人口、产业、交通、基础设施等要素现状评估与发展预测模拟,为各类要素定类别、定规模、定位置、定关系,提供科学量化支撑。
<html>

<head>

  <meta charset="utf-8" />

  <meta

    name="viewport"

    content="initial-scale=1,maximum-scale=1,user-scalable=no"

  />

<title>Point clustering - advanced configuration | Sample | ArcGIS API for JavaScript 4.19</title>

<link rel="stylesheet" href="https://js.arcgis.com/4.19/esri/themes/dark/main.css" />

<script src="https://js.arcgis.com/4.19/"></script>

<style>

  html, body, #viewDiv {

    height: 100%;

    width: 100%;

    margin: 0;

    padding: 0;

  }

  #infoDiv {

    padding: 10px;

    width: 275px;

  }

  #sliderValue{

    font-weight: bolder;

  }

  #legendDiv{

    width: 260px;

  }

  #description{

    padding: 10px 0 10px 0;

  }

</style>

<script>

  require([

    "esri/Map",

    "esri/views/MapView",

    "esri/layers/FeatureLayer",

    "esri/widgets/Legend",

    "esri/widgets/Slider",

    "esri/widgets/Expand"

  ], (Map, MapView, FeatureLayer, Legend, Slider, Expand

  ) => {

    // Configure clustering on the layer with a

    // popupTemplate displaying the predominant

    // fuel type of the power plants in the cluster

    const clusterLabelThreshold = 1500;

    const haloColor = "#373837";

    const color = "#f0f0f0";

    const clusterConfig = {

      type: "cluster",

      popupTemplate: {

        title: "Cluster summary",

        content: [

          {

            type: "text",

            text: `

            This cluster represents <b>{cluster_count}</b> power plants with an average capacity of <b>{cluster_avg_capacity_mw} megawatts</b>.

             The power plants in this cluster produce a total of <b>{expression/total-mw} megawatts</b> of power.`

          },

          {

            type: "text",

            text: "Most power plants in this cluster generate power from <b>{cluster_type_fuel1}</b>."

          }

        ],

        fieldInfos: [{

          fieldName: "cluster_count",

          format: {

            places: 0,

            digitSeparator: true

          }

        }, {

          fieldName: "cluster_avg_capacity_mw",

          format: {

            places: 2,

            digitSeparator: true

          }

        }, {

          fieldName: "expression/total-mw",

          format: {

            places: 0,

            digitSeparator: true

          }

        }],

        expressionInfos: [{

          name: "total-mw",

          title: "total megawatts",

          expression: "$feature.cluster_avg_capacity_mw * $feature.cluster_count"

        }]

      },

      // larger radii look better with multiple label classes

      // smaller radii looks better visually

      clusterRadius: "120px",

      labelsVisible: true,

      labelingInfo: [{

        symbol: {

          type: "text",

          haloColor,

          haloSize: "1px",

          color,

          font: {

            family: "Noto Sans",

            size: "11px"

          },

          xoffset: 0,

          yoffset: "-15px",

        },

        labelPlacement: "center-center",

        labelExpressionInfo: {

          expression: "Text($feature.cluster_count, '#,### plants')"

        },

        where: `cluster_avg_capacity_mw > ${clusterLabelThreshold}`

      }, {

        symbol: {

          type: "text",

          haloColor,

          haloSize: "2px",

          color,

          font: {

            weight: "bold",

            family: "Noto Sans",

            size: "18px"

          },

          xoffset: 0,

          yoffset: 0

        },

        labelPlacement: "center-center",

        labelExpressionInfo: {

          expression: "$feature.cluster_type_fuel1"

        },

        where: `cluster_avg_capacity_mw > ${clusterLabelThreshold}`

      }, {

        symbol: {

          type: "text",

          haloColor,

          haloSize: "1px",

          color,

          font: {

            weight: "bold",

            family: "Noto Sans",

            size: "12px"

          },

          xoffset: 0,

          yoffset: "15px"

        },

        deconflictionStrategy: "none",

        labelPlacement: "center-center",

        labelExpressionInfo: {

          expression: `

          var value = $feature.cluster_avg_capacity_mw;

          var num = Count(Text(Round(value)));

          Decode(num,

            4, Text(value / Pow(10, 3), "##.0k"),

            5, Text(value / Pow(10, 3), "##k"),

            6, Text(value / Pow(10, 3), "##k"),

            7, Text(value / Pow(10, 6), "##.0m"),

            Text(value, "#,###")

          );

          `

        },

        where: `cluster_avg_capacity_mw > ${clusterLabelThreshold}`

      }, {

        symbol: {

          type: "text",

          haloColor,

          haloSize: "1px",

          color,

          font: {

            family: "Noto Sans",

            size: "11px"

          },

          xoffset: 0,

          yoffset: "-15px",

        },

        labelPlacement: "above-right",

        labelExpressionInfo: {

          expression: "Text($feature.cluster_count, '#,### plants')"

        },

        where: `cluster_avg_capacity_mw <= ${clusterLabelThreshold}`

      }, {

        symbol: {

          type: "text",

          haloColor,

          haloSize: "2px",

          color,

          font: {

            weight: "bold",

            family: "Noto Sans",

            size: "18px"

          }

        },

        labelPlacement: "above-right",

        labelExpressionInfo: {

          expression: "$feature.cluster_type_fuel1"

        },

        where: `cluster_avg_capacity_mw <= ${clusterLabelThreshold}`

      },  {

        symbol: {

          type: "text",

          haloColor,

          haloSize: "1px",

          color,

          font: {

            weight: "bold",

            family: "Noto Sans",

            size: "12px"

          },

          xoffset: 0,

          yoffset: 0

        },

        labelPlacement: "center-center",

        labelExpressionInfo: {

          expression: `

          var value = $feature.cluster_avg_capacity_mw;

          var num = Count(Text(Round(value)));

          Decode(num,

            4, Text(value / Pow(10, 3), "##.0k"),

            5, Text(value / Pow(10, 3), "##k"),

            6, Text(value / Pow(10, 3), "##k"),

            7, Text(value / Pow(10, 6), "##.0m"),

            Text(value, "#,###")

          );

          `

        },

        where: `cluster_avg_capacity_mw <= ${clusterLabelThreshold}`

      }]

    };

    const layer = new FeatureLayer({

      portalItem: {

        id: "eb54b44c65b846cca12914b87b315169"

      },

      featureReduction: clusterConfig,

      popupEnabled: true,

      labelsVisible: true,

      labelingInfo: [{

        symbol: {

          type: "text",

          haloColor,

          haloSize: "1px",

          color,

          font: {

            family: "Noto Sans",

            size: "11px"

          },

          xoffset: 0,

          yoffset: "-15px",

        },

        labelPlacement: "center-center",

        labelExpressionInfo: {

          expression: "$feature.name"

        },

        where: `capacity_mw > ${clusterLabelThreshold}`

      }, {

        symbol: {

          type: "text",

          haloColor,

          haloSize: "2px",

          color,

          font: {

            weight: "bold",

            family: "Noto Sans",

            size: "18px"

          },

          xoffset: 0,

          yoffset: 0

        },

        labelPlacement: "center-center",

        labelExpressionInfo: {

          expression: "$feature.fuel1"

        },

        where: `capacity_mw > ${clusterLabelThreshold}`

      }, {

        symbol: {

          type: "text",

          haloColor,

          haloSize: "1px",

          color,

          font: {

            weight: "bold",

            family: "Noto Sans",

            size: "12px"

          },

          xoffset: 0,

          yoffset: "15px"

        },

        labelPlacement: "center-center",

        labelExpressionInfo: {

          expression: `

          var value = $feature.capacity_mw;

          var num = Count(Text(Round(value)));

          Decode(num,

            4, Text(value / Pow(10, 3), "##.0k"),

            5, Text(value / Pow(10, 3), "##k"),

            6, Text(value / Pow(10, 3), "##k"),

            7, Text(value / Pow(10, 6), "##.0m"),

            Text(value, "#,###")

          );

          `

        },

        where: `capacity_mw > ${clusterLabelThreshold}`

      }, {

        symbol: {

          type: "text",

          haloColor,

          haloSize: "1px",

          color,

          font: {

            family: "Noto Sans",

            size: "11px"

          },

          xoffset: 0,

          yoffset: "-15px",

        },

        labelPlacement: "above-right",

        labelExpressionInfo: {

          expression: "$feature.name"

        },

        where: `capacity_mw <= ${clusterLabelThreshold}`

      }, {

        symbol: {

          type: "text",

          haloColor,

          haloSize: "2px",

          color,

          font: {

            weight: "bold",

            family: "Noto Sans",

            size: "18px"

          }

        },

        labelPlacement: "above-right",

        labelExpressionInfo: {

          expression: "$feature.fuel1"

        },

        where: `capacity_mw <= ${clusterLabelThreshold}`

      }, {

        symbol: {

          type: "text",

          haloColor,

          haloSize: "1px",

          color,

          font: {

            weight: "bold",

            family: "Noto Sans",

            size: "12px"

          },

          xoffset: 0,

          yoffset: 0

        },

        labelPlacement: "center-center",

        labelExpressionInfo: {

          expression: `

          var value = $feature.cluster_avg_capacity_mw;

          var num = Count(Text(Round(value)));

          Decode(num,

            4, Text(value / Pow(10, 3), "##.0k"),

            5, Text(value / Pow(10, 3), "##k"),

            6, Text(value / Pow(10, 3), "##k"),

            7, Text(value / Pow(10, 6), "##.0m"),

            Text(value, "#,###")

          );

          `

        },

        where: `cluster_avg_capacity_mw <= ${clusterLabelThreshold}`

      }]

    });

    const map = new Map({

      basemap: {

        portalItem: {

          id: "8d91bd39e873417ea21673e0fee87604"

        }

      },

      layers: [layer]

    });

    const view = new MapView({

      container: "viewDiv",

      map: map,

      extent: {

        spatialReference: {

          latestWkid: 3857,

          wkid: 102100

        },

        xmin: -42087672,

        ymin: 4108613,

        xmax: -36095009,

        ymax: 8340167

      }

    });

    layer.when().then(() =>{

      const renderer = layer.renderer.clone();

      renderer.visualVariables = [{

        type: "size",

        field: "capacity_mw",

        legendOptions: {

          title: "Capacity (MW)"

        },

        minSize: "24px",

        maxSize: "100px",

        minDataValue: 1,

        maxDataValue: 5000

      }];

      layer.renderer = renderer;

    });

    const legend = new Legend({

      view: view,

      container: "legendDiv"

    });

    const infoDiv = document.getElementById("infoDiv");

    view.ui.add(

      new Expand({

        view: view,

        content: infoDiv,

        expandIconClass: "esri-icon-layer-list",

        expanded: true

      }),

      "top-right"

    );

    view.whenLayerView(layer).then((layerView) => {

      const field = "capacity_mw";

      const slider = new Slider({

        min: 0,

        max: 2000,

        values: [0],

        container: document.getElementById("sliderDiv"),

        visibleElements: {

          rangeLabels: true

        },

        precision: 0

      });

      const sliderValue = document.getElementById("sliderValue");

      // filter features by power plant capacity when the user

      // drags the slider thumb. If clustering is enabled,

      // clusters will recompute and render based on the number

      // and type of features that satisfy the filter where clause

      slider.on(["thumb-change", "thumb-drag"], (event) => {

        sliderValue.innerText = event.value;

        layerView.filter = {

          where: field + " >= " + event.value

        };

      });

    });

  });

</script>

</head>

<body>

  <div id="viewDiv"></div>

  <div id="infoDiv" class="esri-widget">

    <div id="description">

      Show power plants with at least <span id="sliderValue">0</span> megawatts of capacity

    </div>

    <div id="sliderContainer">

      <div id="sliderDiv"></div>

    </div>

    <div id="legendDiv"></div>

  </div>

</body>

</html>
同时,根据规划目标导向,统筹协调空间布局安排,将各要素在空间规划底图上进行有机叠加,形成空间布局方案,为国土空间用途管制提供依据。
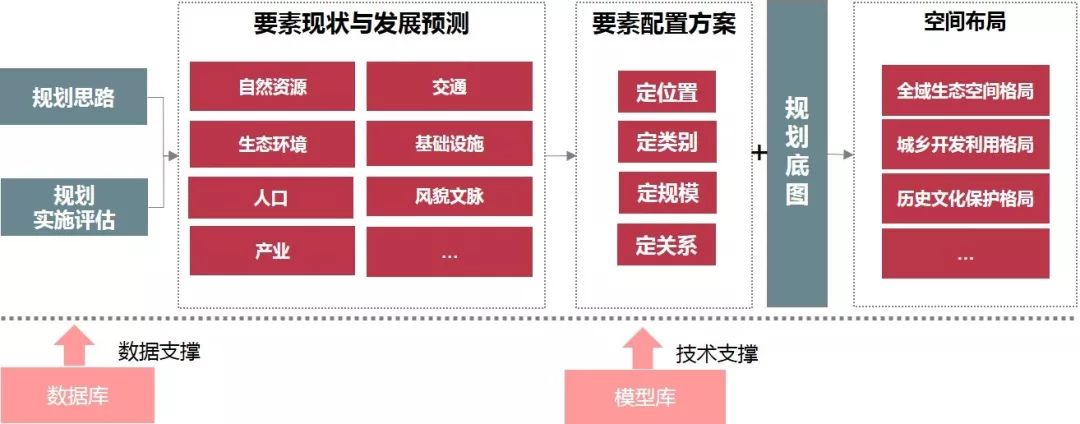
要素配置和空间布局流程
基于GIS的国土空间规划平台建设的更多相关文章
- 基于特定领域国土GIS应用框架设计及应用
基于特定领域国土GIS应用框架 设计及应用 何仕国 2012年8月16日 摘要: 本文首先讲述了什么是框架和特定领域框架,以及与国土GIS 这个特定领 ...
- 基于GIS的视频管理指挥平台
平台利用空间地理信息技术,以GIS地图为基础,将各类信息空间化.可视化,实现基于空间电子地图的可视化查询和分析,它能使情报.推理.分析与其他可用数据融为一体,提供依托于电子地图的清晰而精确的现场态势图 ...
- 基于MaxCompute的媒体大数据开放平台建设
摘要:随着自媒体的发展,传统媒体面临着巨大的压力和挑战,新华智云运用大数据和人工智能技术,致力于为媒体行业赋能.通过媒体大数据开放平台,将媒体行业全网数据汇总起来,借助平台数据处理能力和算法能力,将有 ...
- 一个大数据平台省了20个IT人力——敦奴数据平台建设案例分享
认识敦奴 敦奴集团创立于1987年,主营服装.酒店.地产,总部位于中国皮都-海宁.浙江敦奴联合实业股份有限公司(以下简称"敦奴")是一家集开发.设计.生产.销售于一体的大型专业服装 ...
- 基于UML网络教学管理平台模型的搭建
一.基本信息 标题:基于UML网络教学管理平台模型的搭建 时间:2013 出版源:网络安全技术与应用 领域分类:UML:网络教学管理平台:模型 二.研究背景 问题定义:网络教学管理平台模型的搭建 难点 ...
- 美团点评基于 Flink 的实时数仓建设实践
https://mp.weixin.qq.com/s?__biz=MjM5NjQ5MTI5OA==&mid=2651749037&idx=1&sn=4a448647b3dae5 ...
- 时间序列大数据平台建设(Time Series Data,简称TSD)
来源:https://blog.csdn.net/bluishglc/article/details/79277455 引言在大数据的生态系统里,时间序列数据(Time Series Data,简称T ...
- TOP100summit 2017:【案例分享】魅族持续交付平台建设实践
本篇文章内容来自第10期魅族开放日魅族运维架构师林钟洪的现场分享.编辑:Cynthia 一.自动化建设历程1.1 魅族互联网发展的时间线 2003-2008年被称之为“互联网1.0时代”.2003年, ...
- 天马行空-Ops平台建设概述
1 概述 什么是Ops平台,Ops平台的目标是什么,建设的考虑点有哪些?本章节以实际生活中医院的例子来进行各形象的阐述. 医院包含各种诊断治疗设备,病历库,医生.一个孕妇需要到医院 ...
随机推荐
- Asp.NetCore 自定义中间件
这节演示一下自定义中间件,第一节我们讲到,中间件的处理流程就像一个俄罗斯套娃,那这种俄罗斯套娃型的流程内部是如何实现的呢,下面请看代码. 第一种写法是直接写在Configure方法中的,使用app ...
- ElasticSearch实战系列十一: ElasticSearch错误问题解决方案
前言 本文主要介绍ElasticSearch在使用过程中出现的各种问题解决思路和办法. ElasticSearch环境安装问题 1,max virtual memory areas vm.max_ma ...
- Linux后台执行命令:&和nohup nohup和&后台运行,进程查看及终止
nohup和&后台运行,进程查看及终止 阅读目录 nohup和&后台运行,进程查看及终止 1.nohup 2.& 3.nohup和&的区别 &:是指在后台运 ...
- nginx版本无缝升级与回滚
chookie和session 你们公司的会话保持怎么做的? 1.开发做的:记录用户登陆的状态,将用户登陆状态保存到,redis服务器中,nfs,mysql. 记录用户的登陆状态. 通过登陆用 ...
- Could not open device at /dev/ipmi0
Could not open device at /dev/ipmi0 分类: LINUX 2013-09-02 17:01:37 Could not open device at /dev/ip ...
- Redis 快速集群环境搭建
环境 Linux :centos 7 redis:redis-5.0.9 Redis 集群环境搭建步骤 早期 redis 版本集群环境搭建需要安装 ruby 运行环境,搭建步骤比较繁琐: redis ...
- Scala 中为什么不建议用 return 关键字
在scala中使用 return 的话,编译的时候会提示the latest statement is method is automatically returned, use of th retu ...
- 发现新大陆 --21lic
21lic网上发单平台 http://project.21ic.com/p/97250
- Hadoop系列番外篇之一文搞懂Hadoop RPC框架及细节实现
@ 目录 Hadoop RPC 框架解析 1.Hadoop RPC框架概述 1.1 RPC框架特点 1.2 Hadoop RPC框架 2.Java基础知识回顾 2.1 Java反射机制与动态代理 2. ...
- AtCoder Regular Contest 121 D - 1 or 2
题目链接:点我点我 Problem Statement Snuke has a blackboard and NN candies. The tastiness of the ii-th candy ...