Linux性能优化-理解平均负载
1 理解CPU
CPU(Cental Processing Unit)是计算机系统的运算和控制核心,是信息处理、程序运行的最终执行单元,相当系统的“大脑”。
当 cpu 过于繁忙,就像“人脑”并发处理过多事情,会降低做事效率,严重时甚至会导致崩溃“宕机”。因此,理解 CPU 工作原理,合理控制资源,是保障系统稳定持续运行的重要手段。
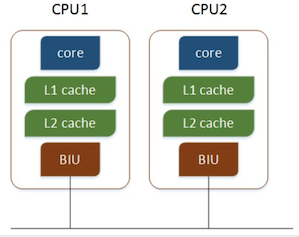
1.1 多 cpu 和多核 cpu
多个物理CPU,CPU通过总线进行通信,效率比较低:
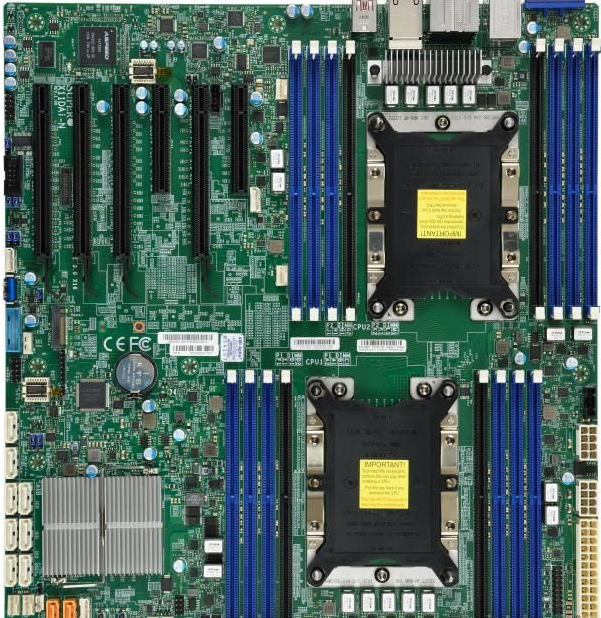
用于双路Xeon可扩展的主板:超微X11DAi-N
多核CPU,不同的核通过L2 cache进行通信,存储和外设通过总线与CPU通信:
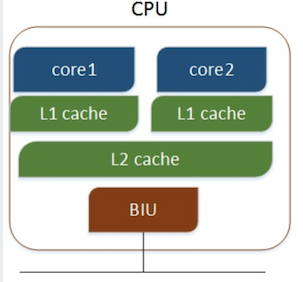

用于单路Xeon-W的主板:超微X11SRA
2 查询CPU信息
[root@localhost ~]# cat /proc/cpuinfo | grep 'physical id' | sort | uniq | wc -l  //查看 cpu 个数

[root@localhost ~]# cat /proc/cpuinfo | grep 'cpu cores' | sort | uniq     // 查看cpu物理核数

cpu cores    :

[root@localhost ~]# cat /proc/cpuinfo | grep 'siblings' | sort | uniq     // 查看 cpu 逻辑核数

siblings    :
3 平均负载含义
当系统变慢的时候,我们一般使用 top 或 uptime 命令来查看系统平均负载情况。
正确定义:单位时间内,系统中处于 可运行状态(R,Running/Runnable)和不可中断睡眠状态(D,Disk Sleep) 的平均进程数。
错误定义:单位时间内的 cpu 使用率。
可运行状态的进程:正在使用 cpu 或者正在等待 cpu 的进程,即 ps aux 命令下 STAT 处于 R 状态的进程
不可中断状态的进程:处于内核态关键流程中的进程,且不可被打断,如等待硬件设备IO响应,ps命令D状态的进程。
理想状态:每个 cpu 上都有一个活跃进程,即平均负载数等于 cpu 数。
过载经验值:平均负载高于 cpu 数量 70% 的时候。
假如在一个单 cpu 系统上看到 1.73 0.60 7.98,表示在过去一分钟内系统有73%的超载,而在15分钟内,有698%的超载。
注:可运行状态进程包括正在使用cpu或等待cpu的进程;不可中断状态进程是指处于内核关键流程中的进程,并且该流程不可被打断,比如当进程向磁盘写数据时,如果被打断,就可能出现磁盘数据与进程数据不一致。
不可中断进程状态,本质上是系统对进程和硬件设备的一种保护机制。
4 平均负载案例分析
系统环境和工具
系统环境和配置:CentOS 7 64bit 4G内存 2CPU
相关工具:stress、sysstat。
stress:一个Linux系统压力测试工具。
sysstat:监控和分析系统的性能工具,包括mpstat关于cpu详细信息(单独输出或分组输出)、pidstat(进程性能分析)命令、iostat等。
安装工具:yum install -y epel-release stress sysstat
同一个Linux系统开三个终端。
场景一:CPU密集型进程
第一个终端运行stress命令模拟一个cpu使用率100%
[root@localhost ~]# stress --cpu  --timeout

stress: info: [] dispatching hogs:  cpu,  io,  vm,  hdd
第二个终端运行uptime查看平均负载变化情况
#-d参数表示高亮显示变化的区域
[root@localhost ~]# watch -d uptime
第三个终端云溪mpstat查看cpu使用率变化情况
#-P ALL表示监控所有cpu,5表示间隔5秒输出一组数据
[root@localhost zhiwenwei]# mpstat -P ALL

Linux 3.10.-957.10..el7.x86_64 (localhost.localdomain)     2019年04月01日     _x86_64_    ( CPU)

22时33分45秒  CPU    %usr   %nice    %sys %iowait    %irq   %soft  %steal  %guest  %gnice   %idle

22时33分50秒  all   50.95    0.00    0.30    0.00    0.00    0.00    0.00    0.00    0.00   48.75

22时33分50秒        1.80    0.00    0.60    0.00    0.00    0.00    0.00    0.00    0.00   97.60

22时33分50秒      100.00    0.00    0.00    0.00    0.00    0.00    0.00    0.00    0.00    0.00
结论:从终端二看到1分钟的平均负载会慢慢增加到1.00;终端三正好有一个cpu使用率为100%,但它的iowait只有0,说明平均负载的升高正是由于cpu使用率的升高。
那么到底是哪个进程导致cpu使用率为100%,可以使用top命令来来查或使用pidstat命令。
[root@localhost zhiwenwei]# pidstat -u

Linux 3.10.-957.10..el7.x86_64 (localhost.localdomain)     2019年04月01日     _x86_64_    ( CPU)

22时37分09秒   UID       PID    %usr %system  %guest   %wait    %CPU   CPU  Command

22时37分14秒               0.00    0.20    0.00    0.00    0.20       xfsaild/dm-

22时37分14秒               1.20    0.20    0.00    0.00    1.40       mono

22时37分14秒               0.00    0.20    0.00    0.00    0.20       rsyslogd

22时37分14秒               0.00    0.20    0.00    0.00    0.20       watch

22时37分14秒            100.20    0.00    0.00    0.00  100.20       stress

22时37分14秒              0.20    0.20    0.00    0.00    0.40       pidstat

平均时间:   UID       PID    %usr %system  %guest   %wait    %CPU   CPU  Command

平均时间:               0.00    0.20    0.00    0.00    0.20     -  xfsaild/dm-

平均时间:               1.20    0.20    0.00    0.00    1.40     -  mono

平均时间:               0.00    0.20    0.00    0.00    0.20     -  rsyslogd

平均时间:               0.00    0.20    0.00    0.00    0.20     -  watch

平均时间:            100.20    0.00    0.00    0.00  100.20     -  stress

平均时间:              0.20    0.20    0.00    0.00    0.40     -  pidstat
场景二:I/O密集型进程
第一个终端运行stress命令模拟I/O压力
[root@localhost ~]# stress -i --timeout
第二个终端运行uptime查看当前平均负载变化情况
[root@localhost ~]# watch -d uptime
第三个终端运行mpstat查看cpu使用率变化情况
[zhiwenwei@localhost tmp]$ mpstat -P ALL

Linux 3.10.-957.10..el7.x86_64 (localhost.localdomain)     2019年04月02日     _x86_64_    ( CPU)

13时44分56秒  CPU    %usr   %nice    %sys %iowait    %irq   %soft  %steal  %guest  %gnice   %idle

13时45分01秒  all    1.41    0.00   47.43    0.00    0.00    0.00    0.00    0.00    0.00   51.16

13时45分01秒        1.61    0.00   89.52    0.00    0.00    0.00    0.00    0.00    0.00    8.87

13时45分01秒        1.21    0.00    5.43    0.00    0.00    0.00    0.00    0.00    0.00   93.36

平均时间:  CPU    %usr   %nice    %sys %iowait    %irq   %soft  %steal  %guest  %gnice   %idle

平均时间:  all    1.41    0.00   47.43    0.00    0.00    0.00    0.00    0.00    0.00   51.16

平均时间:        1.61    0.00   89.52    0.00    0.00    0.00    0.00    0.00    0.00    8.87

平均时间:        1.21    0.00    5.43    0.00    0.00    0.00    0.00    0.00    0.00   93.36
结论:1分钟的平均负载会慢慢增加到1,其中两个cpu平均使用率49.40,而idle平均达到50.40。说明平均负载的升高由于idle的升高。
查看导致idle升高的进程:
[zhiwenwei@localhost tmp]$ pidstat -u

Linux 3.10.-957.10..el7.x86_64 (localhost.localdomain)     2019年04月02日     _x86_64_    ( CPU)

13时50分46秒   UID       PID    %usr %system  %guest   %wait    %CPU   CPU  Command

13时50分51秒               0.00    8.58    0.00    1.60    8.58       kworker/u4:

13时50分51秒               1.40    0.00    0.00    0.00    1.40       mono

13时50分51秒               1.00   62.08    0.00    3.59   63.07       stress

13时50分51秒               0.00   14.77    0.00    1.60   14.77       kworker/u4:

13时50分51秒            0.00    0.20    0.00    0.00    0.20       pidstat

平均时间:   UID       PID    %usr %system  %guest   %wait    %CPU   CPU  Command

平均时间:               0.00    8.58    0.00    1.60    8.58     -  kworker/u4:

平均时间:               1.40    0.00    0.00    0.00    1.40     -  mono

平均时间:               1.00   62.08    0.00    3.59   63.07     -  stress

平均时间:               0.00   14.77    0.00    1.60   14.77     -  kworker/u4:

平均时间:            0.00    0.20    0.00    0.00    0.20     -  pidstat
可以发现是stress进程导致的。
场景三:大量进程
第一个终端使用stress命令模拟10个进程
[root@localhost ~]# stress -c --timeout
第二个终端用uptime查看平均负载变化情况
[root@localhost ~]# watch -d uptime
第三个终端pidstat查看进程情况
[root@localhost ~]# pidstat -u

Linux 3.10.-957.10..el7.x86_64 (localhost.localdomain)     2019年04月02日     _x86_64_    ( CPU)

13时55分59秒   UID       PID    %usr %system  %guest   %wait    %CPU   CPU  Command

13时56分04秒               1.38    0.20    0.00    0.00    1.58       mono

13时56分04秒              19.53    0.00    0.00   79.49   19.53       stress

13时56分04秒              19.72    0.00    0.00   79.49   19.72       stress

13时56分04秒              19.72    0.00    0.00   79.68   19.72       stress

13时56分04秒              19.72    0.00    0.00   79.68   19.72       stress

13时56分04秒              19.53    0.00    0.00   79.09   19.53       stress

13时56分04秒              19.72    0.00    0.00   79.29   19.72       stress

13时56分04秒              19.53    0.00    0.00   78.90   19.53       stress

13时56分04秒              19.72    0.00    0.00   80.08   19.72       stress

13时56分04秒              19.53    0.00    0.00   79.09   19.53       stress

13时56分04秒              19.72    0.00    0.00   79.29   19.72       stress

13时56分04秒               0.00    0.20    0.00    0.39    0.20       pidstat

平均时间:   UID       PID    %usr %system  %guest   %wait    %CPU   CPU  Command

平均时间:               1.38    0.20    0.00    0.00    1.58     -  mono

平均时间:              19.53    0.00    0.00   79.49   19.53     -  stress

平均时间:              19.72    0.00    0.00   79.49   19.72     -  stress

平均时间:              19.72    0.00    0.00   79.68   19.72     -  stress

平均时间:              19.72    0.00    0.00   79.68   19.72     -  stress

平均时间:              19.53    0.00    0.00   79.09   19.53     -  stress

平均时间:              19.72    0.00    0.00   79.29   19.72     -  stress

平均时间:              19.53    0.00    0.00   78.90   19.53     -  stress

平均时间:              19.72    0.00    0.00   80.08   19.72     -  stress

平均时间:              19.53    0.00    0.00   79.09   19.53     -  stress

平均时间:              19.72    0.00    0.00   79.29   19.72     -  stress

平均时间:               0.00    0.20    0.00    0.39    0.20     -  pidstat
总结:
平均负载高有可能是cpu密集型进程导致的;
平均负载高不一定是cpu使用率高,还有可能是I/O更繁忙
当发现负载高的时候,可以使用mpstat、pidstat等工具辅助分析负载高的根源。
参考文献
https://time.geekbang.org/column/article/69618
Linux性能优化-理解平均负载的更多相关文章
- linux性能优化cpu-02平均负载
每次我们系统变慢时,我们通常做的第一件事就是top命令或者uptime命令,看一下系统的负载情况,比如下面: 我在命令行中输入uptime 22:15:51 表示当前系统时间 up 13 min ...
- 1 linux性能优化之平均负载uptime
不知道onenote的笔记复制出来就是图片了...
- linux性能分析之平均负载
平均负载 1,执行 top 或者 uptime 命令 来了解系统负载 uptime 分析显示 当前时间,系统运行时间,正在登录用户数 平均负载是指单位时间内,系统处于可运行状态和不可中断状态的平均进程 ...
- Linux性能优化-平均负载
Linux性能优化-平均负载 目录 Linux性能优化-平均负载 平均负载的含义 平均负载为多少时合理 平均负载与 CPU 使用率 平均负载案例分析 场景一:CPU 密集型进程 场景二:I/O 密集型 ...
- 《Linux 性能优化实战—倪朋飞 》学习笔记 CPU 篇
平均负载 指单位时间内,系统处于可运行状态和不可中断状态的平均进程数,即平均活跃进程数 可运行状态:正在使用CPU或者正在等待CPU 的进程,也就是我们常用 ps 命令看到的,处于 R 状态 (Run ...
- 如何学习Linux性能优化?
如何学习Linux性能优化? 你是否也曾跟我一样,看了很多书.学了很多 Linux 性能工具,但在面对 Linux 性能问题时,还是束手无策?实际上,性能分析和优化始终是大多数软件工程师的一个痛点.但 ...
- Linux性能优化从入门到实战:01 Linux性能优化学习路线
我通过阅读各种相关书籍,从操作系统原理.到 Linux内核,再到硬件驱动程序等等. 把观察到的性能问题跟系统原理关联起来,特别是把系统从应用程序.库函数.系统调用.再到内核和硬件等不同的层级贯 ...
- Linux性能优化实战CPU篇之总结(四)
一.分析CPU瓶颈 1,性能指标 a>CPU使用率 CPU使用率描述了非空闲时间占总CPU时间的百分比,根据CPU上运行任务的不同可以分为:用户CPU.系统CPU.等待I/O CPU.软中断和硬 ...
- Linux 性能优化之 IO 子系统 系列 图
http://blog.sina.com.cn/s/articlelist_1029388674_11_1.html Linux 性能优化之 IO 子系统(一) 本文介绍了对 Linux IO 子系统 ...
随机推荐
- JL MTK 安防网关的 wifi 吞吐测试
基本配置: 删除桥接中的 eth3 : brctl delif br0 eth3 设置eth3的ip: ifconfig eth3 192.168.1.100 开启数据转发: ech ...
- [daily] emacs显示file name buffer的全路径
在用emacs看代码的时候,在文件间跳来跳去,如果工程太大的话,很可能会有重名文件,这个时候, 你就不知道自己在什么的地方了.需要一个查看当前正在编辑区的文件的名字的方法. emacs在这个地方,存储 ...
- Gitbook在Windows上安装
GitBook是基于Nodejs,使用Git/Github和Markdown制作电子书的命令行工具. 1.安装Nodejs 首先,安装Nodejs,官网地址:https://nodejs.org/en ...
- mysql数据类型和基础语句
阅读目录 转载 https://www.cnblogs.com/Eva-J/articles/9683316.html 数值类型 日期时间类型 字符串类型 ENUM和SET类型 返回顶部 数值类型 M ...
- java 各种数据类型的互相转换
StringBuilder转化为String StringBuilder stb = new StringBuilder(); String str=stb.toString(); //方法1 Str ...
- 彻底清空SharePoint回收站(仅限IE)
1.导航到回收站页面2.F12,在控制台输入javascript:emptyItems()3.回车 4.点击确定即可 注意:这种方法可能只适用于Internet Explorer
- 关于PL/SQL Developer与Oracle客户端
这是一个很简单的知识点,但这些年遇到过太多初学者反而受其困扰,所以还是决定记录一下. 背景:国内使用Oracle的群体,几乎都会使用PL/SQL Developer这个图形化的工具进行日常数据维护.这 ...
- linux----------centos下添加环境变量
1.添加PHP的环境变量.如图操作 其中在 /etc/profile里面编辑的内容是:只加了这一行,箭头所指的那一行. 2.需要添加其他环境变量就在后面用 :追加 PATH=$PATH:/usr/lo ...
- 学习DButils笔记
DBUtills: *********************** 1:创建对象:QueryRunner的对象,其中创建的方式有两种: ①QueryRunner qr = new QueryRunne ...
- js点击出现二级菜单,点击二级菜单主菜单换成二级菜单
点击出现二级菜单 *{ margin:0px auto; padding:0px; } .yiji{ width:200px; height:40px; background-color:red; c ...