Prometheus MySQL_exporter
MySQL Exporter
mysqld_exporter是用来搜集mysql的性能指标的,适用于mysql5.5及其以上版本
程序安装
下载地址:https://prometheus.io/download/#mysqld_exporter
安装mysqld_exporter
tar -zxvf mysqld_exporter-0.11.0.linux-amd64.tar.gz

mv mysqld_exporter-0.11.0.linux-amd64 /usr/local/mysqld_exporter
赋权
mysqld_exporter需要连接到Mysql,所以需要Mysql的权限,我们先为它创建用户并赋予所需的权限:
CREATE USER 'exporter'@'localhost' IDENTIFIED BY 'abc123' WITH MAX_USER_CONNECTIONS 3;

GRANT PROCESS, REPLICATION CLIENT, SELECT ON *.* TO 'exporter'@'localhost';
创建.my.cnf文件
cd /usr/local/mysqld_exporter

cat << EOF > .my.cnf

[client]

user=exporter

password=abc123

EOF
创建systemd服务
cat <<EOF > /etc/systemd/system/mysqld_exporter.service

[Unit]

Description=mysqld_exporter

After=network.target

[Service]

Type=simple

User=prometheus

ExecStart=/usr/local/mysqld_exporter/mysqld_exporter --config.my-cnf=/usr/local/mysqld_exporter/.my.cnf

Restart=on-failure

[Install]

WantedBy=multi-user.target

EOF
启动myslqd_exporter
systemctl daemon-reload

systemctl start mysqld_exporter

systemctl status mysqld_exporter

systemctl enable mysqld_exporter
验证
curl localhost:9104/metrics
拉取数据
利用 Prometheus 的 static_configs 来拉取 mysqld_exporter 的数据。
编辑prometheus.yml文件,添加内容
- job_name: 'mysql'

    static_configs:

    - targets: ['localhost:9104']
重启prometheus,然后在Prometheus页面中的Targets中就能看到新加入的mysql
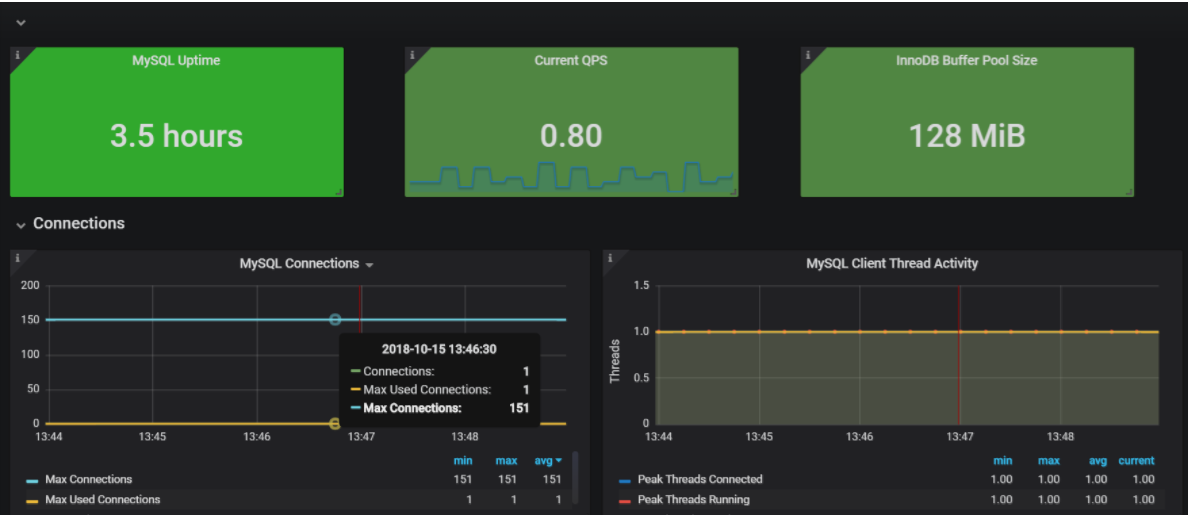
MySQL exporter Dashboard 模板
搜索mysql的Grafana Dashboard,导入进去
Prometheus MySQL_exporter的更多相关文章
- Prometheus+Grafana打造Mysql监控平台
prometheus/node_exporter/mysqld_exporter都是由go语言编写,需要先安装GoLang环境 下载node_exporter(监控服务器的CPU.内存.存储使用情况) ...
- prometheus监控linux系统
安装node exporter 创建Systemd服务 #vim /etc/systemd/system/node_exporter.service[Unit]Description=mysql_ex ...
- prometheus监控mysql
创建一个用于mysqld_exporter连接到MySQL的用户并赋予所需的权限 mysql> GRANT REPLICATION CLIENT, PROCESS ON *.* TO '; my ...
- Prometheus Operator 监控Kubernetes
Prometheus Operator 监控Kubernetes 1. Prometheus的基本架构 Prometheus是一个开源的完整监控解决方案,涵盖数据采集.查询.告警.展示整个监控流程 ...
- centos7下安装配置prometheus
prometheus官网:https://prometheus.io/download/ 搭建环境参考:https://blog.csdn.net/baidu_36943075/article/det ...
- Prometheus 监控Mysql服务器及Grafana可视化
Prometheus 监控Mysql服务器及Grafana可视化. mysql_exporter:用于收集MySQL性能信息. 使用版本 mysqld_exporter 0.11.0 官方地址 使用文 ...
- Prometheus初体验(三)
一.安装部署 Prometheus基于Golang编写,编译后的软件包,不依赖于任何的第三方依赖.用户只需要下载对应平台的二进制包,解压并且添加基本的配置即可正常启动Prometheus Server ...
- prometheus+grafana监控mysql
prometheus+grafana监控mysql 1.安装配置MySQL官方的 Yum Repository(有mysql只需设置监控账号即可) [root@localhost ~]# wget - ...
- 实战 Prometheus 搭建监控系统
实战 Prometheus 搭建监控系统 Prometheus 是一款基于时序数据库的开源监控告警系统,说起 Prometheus 则不得不提 SoundCloud,这是一个在线音乐分享的平台,类似于 ...
随机推荐
- M1事后分析汇报以及总结
一.设想和目标 1. 们的软件要解决什么问题?是否定义得很清楚?是否对典型用户和典型场景有清晰的描述? 我们的软件主要是为了提供周边美食和菜谱查询功能,为“吃货”们提供便利.对典型用户和场景有清晰的描 ...
- github的使用心得
我的github地址:https://github.com/gaino1/test GitHub 是一个用于使用Git版本控制系统的项目的基于互联网的存取服务. GitHub可以托管各种git库,并提 ...
- mysql执行 sql文件遇到USING BTREE ) ENGINE=MyISAM DEFAULT CHARSET=utf8错误
使用navcat在导入别人发的mysql数据的时候,报了下面这个错误: [Err] 1064 - You have an error in your SQL syntax; check the man ...
- my项目的总结2015.8.26编
这已经是上上个星期的事了,现在回顾一下: 负责的模块是"my",更精准的说应该是my里面的个人信息管理 由于项目分域,模块已经分好了,涉及到的只是在现有的基础上解决分域后遗留的历史 ...
- org.apache.ibatis.exceptions.PersistenceException: ### Error querying database. Cause: com.mysql.jdbc.exceptions.jdbc4.CommunicationsException: Communications link failure The last packet sent succ
数据库 没有开启 连接失败 org.apache.ibatis.exceptions.PersistenceException: ### Error querying database. Cause ...
- Mybatis源码分析
MyBatis 是支持定制化 SQL.存储过程以及高级映射的优秀的持久层框架.MyBatis 避免了几乎所有的 JDBC 代码和手动设置参数以及获取结果集.MyBatis 可以对配置和原生Map使用简 ...
- [日常工作] Inspur 服务器安装ESXi的简单过程
1. 公司里面使用虚拟化来进行功能测试 性能测试, 现阶段和之前主要是用虚拟机来搞. 前期用过hyperV 但是感觉 没有SystemCenter的VMM的授权比较难搞一些. 所以还是用ESXi的多了 ...
- 一个很初级的错误 Destructor忘记override导致内存泄露
TxxObj= class public Destructor Destroy(); override;!!!此处若无override,将导致内存泄露 end; Destru ...
- 研究VCL源码的原因和起点
---恢复内容开始--- 研究VCL源码的原因和起点 根本原因:当然是希望自己成为Delphi高手,因为这么多年过去,觉得自己始终不得要领,修改一个控件都无从下手,一直都只是个会拖控件的白痴.而我却拥 ...
- python之pygal:掷两个不同的骰子并统计大小出现次数
代码示例: # 掷两个不同的骰子并统计大小出现次数 import pygal from die_class import Die die = Die(6) # 实例化一个六面的骰子对象 die_10 ...